International Journal of Innovative Technology and Exploring Engineering (IJITEE) ISSN: 2278-3075, Volume-8 Issue-12, October 2019
Impact of Lithium Ion on Sustainable Development
Mohammad Nizamuddin Inamdar, Rohan Senanayake, Mohammed Nusari
Abstract: To define sustainable development in the area of energy: the concept of sustainable improvement, the relate with energy, sustainable development and environment, and the characteristics of developing the energetic sector in a sustainable manner. To analyze the different sources of energy: to present the main energetic resources in the global energy mix having into consideration their main technical and economical characteristics. To vitalizing development. Wastes are convertible to useful energy forms via H2, biogas, bio-alcohol, etc through
waste to energy technologies. Electrodes of ionic lithium battery tent to splinter due to wide mechanical stress and thermally not eligible or acceptable because of overheating of electrodes. In our current research we have consider about the thermal and mechanical aspects ionic battery electrodes. The preparation for the hot temperature creation and rakishness were used to produce a set of 4 materials indicative that classify ionic lithium battery material based on their thermal capacity to secure or prevent the runaway beneath the surplus loading condition. The report shows that silicon is the best anode material for ionic battery and on the other hand it shows the lithium ferrous phosphoric acid is the finest cathode material.
Keywords: Anode n Cathode electrodes, Lithium Ion Battery, Sustainable.
I. INTRODUCTION
The sustainable development improves the worth of life and allows public to survive in a well ecological condition, develop social and economic conditions for present and future generation. Since the world commission on environment and development, constrained Our Common Future, SD has achieve much interest in all nations and a report was published. Explain SD as meets the own needs of the present without effecting the power of future generations to meet their needs (Saachs and Warneer A). It would be a challenge of the twenty first century.
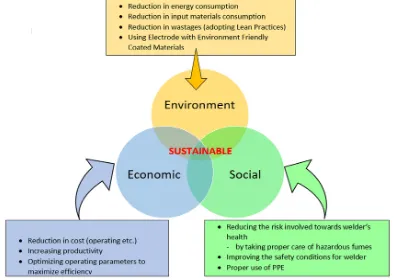
[image:1.595.315.541.442.577.2]Innovative, technologies and ideas of government are stable by sustainable development.
Figure 1: Triple bottom line for sustainable development
Revised Manuscript Received on October 05, 2019.
Mohammad Nizamuddin Inamdar, Department of Mechanical Engineering, Faculty of Engineering
Prof. Dr. Rohan Senanayake, Department of Civil Engineering, Faculty of Engineering
Dr. Mohammed Nusari, Lincoln University College, Malaysia
The sustainable development humanizing social, financial n ecological pays attention to build industries, factory etc, which is increasing financial conditions of industrial countries.
Basic triple bottom line conditions SEE, the European Commission said that 12 million workers are immediately appointed in the field.
In turn to enhance the sustainability in the industrial area LCA can be applied to make the decisions.
ISO 14001, LCA, Environment Foot Printing, Sustainable Technology Development etcetera, all these have achieved Worldwide acceptance in the previous decade by sustainable development.
The no. of programs and organizations have been supported. This range has lead to little confusion about the quality of the materials.
II. LITERATURE OF REVIEW
Principles of sustainable development Hermaan Daly
The word ‘sustainable development’ n ‘sustainable growth’ has become well-known while their meaning
has remained unclear. The Brundtland Commission Report has made an enormous role by emphasize the significance of sustainable development and in result
forcing it to the top of the schedule of the United Nation and the mutual progress banks.
Figure 2: The United States reflected universal handling, with petroleum, coal and natural gas represented more
than 80% of the total.
III. METHODOLOGY
[image:1.595.70.269.546.686.2]The world’s population is expected to increase by 2050 to 25 % based on recent growth trends. This raise is by now demanding invention and utilization pattern universal as mechanized and rising countries follow financial expansion beneath more and more global and connected stresses, for example climate change, ecological poverty, limited tactical metal accessibility, and volatile oil.
The alternative to trace or fossil fuels are wind power, energy storage system n solar voltaic cell for sustainable development but they also have the triple bottom line impact.
The National Academic of Science and Engineering Technology Sustainability lean a seminar on July 14, 2016. To explore the triple bottom line impacts.
The life conservancies were groping the sustainable suggestion of material demands n development process related to renewable source, mobilize n cheering said by roundtable co-chair person. We need to search ways to sustainable work via system as energy production increases for transportation n other desires.
The total yearly renewable electrical energy production, the U.S generates about 173 GW U.S acquire 2nd position. Ranking third goes to Germany that generates about 85 GW. India got the 4th position, Spain 5th n Italy 6th.
The electrical energy spending in Germany is 13% from the total, compared with U.S energy production which is about 8%.
Within the US renewable resource sector, hydro-power has the major share, followed in downward arrange by wood, bio fuels, wind power bio-mass desecrate, geothermal and solar.
Renewable resources are progressively more competitive compared to trace fuels, ranging from about $ 0.050/kWh for large scale hydropower to about $ 0.300/kWh for small scale solar photovoltaic in 2017.
A. Material Selection Based on Thermal Performance of Lithium-Ion Battery Electrode Materials
The primary work of a battery is to store energy. A part of this energy is rakishness in the form of heat. The chemo-thermal modeling provided us with a time dependent concentration profile which predicted the diffusion of lithium ions in/out of the electrode particle. The flux of lithium ions occurred due to a potential difference across the electrodes when the battery is charged/discharged. The charge transfer led to heat generation in the electrode particle.
B. Parametric Analysis
The heat generation in the lithium battery electrode was found due to three primary heat generation sources, i.e. polarization, entropic and joule. Each of these heat sources are dependent on material properties like electrode capacity, diffusivity, reaction rate, entropic capacity, internal resistance, etc. as well as physical conditions like diameter of particle, charging rate and state of charge.
Literature has shown that different materials intercalate differently and some undergoing phase transformation whiles others by reaction. Since the fundamental mechanism is the same, it is convenient to compare every possible candidate material on the basis of heat generation and a parametric analysis was based on four fundamentals. Figure 3 shows the process followed in development of the material indices. First step was the selection of a quantity or parameter that needed to be optimized. Next the governing equation representing the phenomena, like heat generation or diffusion was defined. Then a set of constraints were set by making suitable approximations. Finally, free variables were defined and substituted by the constraint into the parameter to be optimized to derive the indices. It was important to set certain constraints to limit the degree of variability in the material indices. The selection of constraints allowed comparison on a homogenous basis and also provided flexibility to set certain parameters common for all materials to be compared.
International Journal of Innovative Technology and Exploring Engineering (IJITEE) ISSN: 2278-3075, Volume-8 Issue-12, October 2019
Table I: Thermo-Chemical Material Properties for Lithium-Ion Battery Electrode Materials.
Properties LiMnO4 LiCO2 LiFePO4 Li2C Li2Si Li2TiO2
D (m2 /s) 7.08(10-15) 1.00(10-13) 7.96(10-16) 3.90(10-14) 1.00(10-16) 6.8(10-15)
P(kg/m2 ) 4100.00 5030.00 3600.00 2100.00 2328.00 3510.00
αc (mAh/g) 148.00 166.00 170.00 372.00 4200.00 175.00
Cmax(mol/m
3
)
2.29(10 4) 4.99(10 4) 2.12(104) 3.05(104 ) 8.87(104) 5.00(104)
Kr (m2
/mol-m3)
1.90(10-9) 5.18(10-9) 3.12(10-12) 5.03(10-11) 5.00(10-10) 5.00(10-10)
du/dt (mv/k)
0.50 0.25 0.30 0.14 0.50 0.10
Rint (mΩ) 63.00 38.40 20.00 1430.00 1620.00 1.00
Kh (W/m.K) 0.80 0.32 2,70 80.00 4.50 1.04
Most of the data have been obtained from previous experiments, mathematical models or interpolated based on a good approximation from the behavior of the material.
IV. WORKING PRINCIPLE
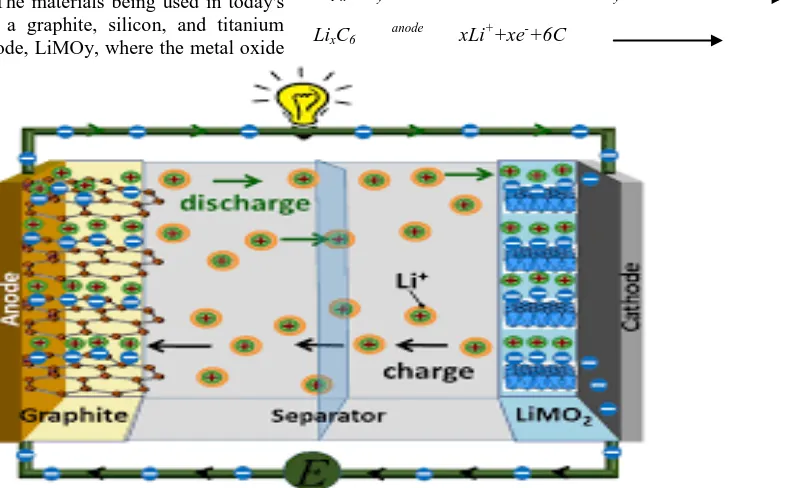
A basic ionic lithium battery cell comprises of: a electric ion collector, an anion and a cat- ion.
The material and microstructures of electrodes and separators vary widely. The materials being used in today's Li-ion batteries include a graphite, silicon, and titanium oxide for negative electrode, LiMOy, where the metal oxide
(MOy) can be manganese oxide, ferrous phosphate, cobalt oxide, etc. A polymeric separator is used to prevent short circuit due to direct contact between electrodes and are made of polypropylene or similar polymers.
The entire battery is immersed in the electrolyte made of lithium salts like lithium hexafluorophosphate, lithium hexa-fluoro-arsenate monohydrate, lithium triflate, etc. The electrolyte conducts the Li ion from the anode to the cathode during discharging cycle and vice-versa during charging as shown in the following reaction.
Li1-xMOy+xLi +
+xe- cathode LiMOy
LixC6 anode xLi++xe-+6C
Figure 4: Lithium ion Battery Representation. Li ion and electron transfer circuit diagram with porous electrode representation for lithium metal oxide battery during discharge.
The Figure 4 gives the 3D representation of a Li-ion battery. During charging, the electrons flow into the anode and the Li+ ion also flows towards the anode to bond with the graphite (reduction) by absorbing the electron. The Li+ ion is provided by the LiMOy, which oxidizes as it releases Li+ and electron. The opposite reaction occurs during discharge.
V. ADVANCEMENTS
From the time when the expansion of first profitable lithium ion batteries by Sonic in 1992, there has been supreme research n development associated to this battery segment. These ionic batteries were made through graphite anion n a lithium transition metal oxide as cathode.
Rigorous experimental and theoretical study have allowed the evolution and utilization of better electrode materials,
which show superior energy thickness, long life cycle n safer action.
[image:3.595.148.541.332.576.2]VI. RESULTS AND DISCUSSION
The thermo-chemical model was developed for a generalized material candidate for lithium ion battery electrodes. The materials were lithiated by ignoring any phase transformation during lithiation process.
[image:4.595.59.280.197.784.2]The power released as heat was estimated for an entire electrode of equal diffusion time in all materials to provide a uniformity of comparison. The lithium concentration required to solve the heat generation model was considered equal and constant for all materials. The partial differential equations were solved using Euler Explicit scheme. All calculations were performed on Mat lab platform.
Table- II: a) Heat generation in electrodes for cathode and anode material.
Material Q (m/W) (Charging) LiMnO4 768.46( 100.5)
LiCoO2 586.22 (101)
LiFePO4 5361.93 (103.8)
C 642.81 (101.5)
Si 7418.69 (104)
LTO 778.54 (102.5)
Table III: b) Heat generation in electrodes for cathode and anode materials.
Th-C Material Q(m/W) Charging
LiMnO4 898.64
LiCoO2 -620.28
LiFePO4 5351.86
C -783.81
Si 7189.25
LTO 694.64
a) 1 C
b) 15 C
Figure 5: Heat Generation in electrode for cathode and anode materials at different rate of charging; a) 1 C, b)
15 C.
Figure 5 shows the total heat generated by different battery materials at 1 C and 15 C charging rates. The calculation was based upon an averaged heating from the three mechanisms. The temperature for the above calculations is maintained at 298 K and the particle was lithiated for 2000 sec for all systems. The radius of each electrode material was selected based on equality of diffusion time. The electrolyte lithium concentration (cl) was assumed to be constant for all battery systems and equal to 1000 mol/m3. A common trend for both the plots was observed based upon the magnitude of heat generation.
Three cathode and anode materials were selected. Amongst the three cathode materials, lithium cobalt oxide showed the highest heat generation during lithiation while lithium ferrous phosphate showed the lowest. This means that cobalt oxide batteries have the potential to generate more heat during charging at the same rate when compared to other cathode materials while ferrous phosphate shows the least heating tendency. Among the anode materials, lithium titanate and silicon showed excellent thermal characteristics as they generated the least heat for the same diffusion rate. It was interesting to observe the shift in the proportions between the different heating mechanisms as the charging rate increases from 1 C to 15 C. For lower charging rates, entropic heating was significantly contributing with polarization heating. As the charging rate (current flux) increased, there was a transition occurring towards a dominant polarization heating because of the stronger influence of the over potential at higher current flux. With the increase in charging rates, the point of focus shifted towards the minimization of polarization heating component.
The predictions for heat generation require vast data from experimentation and therefore it is less practical to conduct a complete thermal modeling when deciding a new material. It is important to study material properties governing the thermal aspect of batteries. For selection of materials without actual testing, it is crucial to have a set of material indices to compare them with existing material pool and justify their viability.
Table IV: Heat Generation and Material Selection based on Polarization Heating Mechanism Th-C Material Q (m/W) (Charging
LiMnO4 9890.98
LiCoO2 987.96
LiFePO4 64271.63
C 6309.67
Si 74928.24
LTO 8970.69
0 2000 4000 6000 8000
LiMnO2 LiCoO2 LiFe
PO4
C Si
LT
O
Q(m/W)
Q(m/W)
-2000 0 2000 4000 6000 8000
LiMn
O2
LiCoO2 LiFe
PO4
C Si
LT
O
Q(m/W)
International Journal of Innovative Technology and Exploring Engineering (IJITEE) ISSN: 2278-3075, Volume-8 Issue-12, October 2019
Figure 6: Heat Generation and Material Selection based on Polarization Heating Mechanism; a) Heat
Generation, b) Selection based on minimization of Polarization Index.
Figure 6 represents the thermal generation and material selection based on polarization heating in cathode and anode materials for lithium-ion batteries. The objective was to reduce the heat due to the over potential created during lithiation of the electrode particle. From Figure 8, it was clear that heating due to surface potential difference was the most dominant factor in heating of the battery.
The comparison between the cathode materials showed that lithium ferrous phosphate had the best performance with heat generation several orders of magnitude lower than lithium cobalt oxide. From Figure 9(a) Cobalt oxide based electrodes generate three orders of magnitude more heat than other comparable materials. We believe that there are two primary properties that govern the polarization heating, i.e. density and mass diffusivity. A dense electrode material has a higher ability to store charge for the same capacity. This leads to a higher current absorption ability which is a primary cause of heating in batteries. Moreover, higher mass diffusivity can be related to larger particle radius, under the constraint of uniform diffusion time. Larger particles tend to generate more heat which also adds up to the increase in lithium absorption during lithiation. Lithium cobalt oxide has high density and low capacity amongst the cathode materials which justifies its high polarization heating tendency.
From materials like lithium ferrous phosphate and silicon were below the minimization line, closely followed by lithium titanate. The low diffusivity of lithium ferrous oxide means that its particle size would be small for same diffusion time.
VII. CONCLUSION
Electrodes of ionic lithium lean to break appropriate to wide-ranging motorized stress and thermally not succeed by due to more n more heating.
In this present research, we have calculated the thermal n mechanical aspect of ionic lithium battery electrodes. Heat generation formula and rakishness were used to make a set of three material based on their thermal recital and capacity to avoid runaway beneath the condition of surplus loading. The report represents or predicted that the best cathode material is lithium.
REFERENCES
1. Levin, S. A. (1992). MacArthur award lecture. Ecology, 73. 2. Pradier, J.P., & Pradier, C.M.(Eds.). (2014). Carbon di oxide
chemistry: environmental issues. ELsevier.
3. Maroto valer, M. M. song, C., & soong, Y. (Eds.). (2012). Springer science & Business Media.
4. Jabareen, Y. (2009). Building a conceptual framework: philosophy, definitions and procedure. International journal of qualitative methods, 8(4).
5. Weisz, P. B. (2004). fundamental choices and constraint on long term energy transfer. PHYSICS TODAY. 57(7), 47 -52.
6. Schubert, H. H., & Song, C. (2002). Fuel, 81(1). 15-32.
7. Song, C., & Pan, W. (2004). Prep. Pap-Am. Chem. Soc., Div. Fuel Chem., 49(1), 128.
8. Fava, J.A.(2006). The International Journal of life cycle Assessment, 11, 6-8.
9. International Organization for Standardization. (2006).
10. Asif, M., Muneer, T., & Kelley, r. (2007). Building and Environment, 42(3), 1391-1394.
11. Ometto, A. R., Guelere Filho, A., & Souza, M. P. D. (2006). 12. Ekins, P. (2002).
13. Schwartz, M. S., & Carroll, A. B. (2008). Business & Society, 47(2), 148-186.
14. Schmidt Bleek, F. (2013). Wieviel Umwelt braucht der Mensch?: MIPS – das Mab fur okologisches Wirtschaften. Springer Verlag. 15. 15. Song, C. (2006). Catalysis today, 115(1-4), 2-32.
16. 16. Steinberg, M. (2002). General Overview-2 CO2 Mitigation and Fuel Production. In ACS Symposium Series ( Vol. 809, pp.31-38). Washington, DC : American Chemical Society.
17. 17. Holland, H. (2005). Technician at AJA International. Inc. Telephone interview, 9.
18. 18. Chryssolouris, G. (2013). Manufacturing systems: theory and practice. Springer Science & Business Media.
19. 19. Eizenberg, E., & Shilon, M. (2016). Environment and planning B: Planning and Design, 43(6), 1118-1135.
20. 20. Flyvbjerg, B., & Richardson, T. (2004). n
AUTHORS PROFILE
Mohammad Nizamuddin Inamdar, Head of Mechanical Engineering Department, Faculty of Engineering, Lincoln University College, Malaysia. He completed his Master of Technology in the field of Thermal Power Energy / Mechanical Engineering and has research in energy and materials. nizamuddin@lincoln.edu.my
Dr. Rohan Senanayake, Professor in Mechanical Engineering Department, Faculty of Engineering, Lincoln University College, Malaysia. He has many Publications in various international Journals. He completed his PhD in Mechanical Engineering from Aston University, United Kingdom.
rohan@lincoln.edu.my
Dr. Mohammed Nusari, Head of Civil Engineering Department, Faculty of Engineering & Coordinator of Engineering in Post graduate Department, Lincoln University College, Malaysia. He has to his credit many papers published in Scopus indexed journals and presented papers in various conferences and seminar. He completed his PhD in water Resource/ Civil Engineering from University Putra Malaysia (UPM), Malaysia.