A Collaborative Framework for Scientific Data Analysis and Visualization
Jaliya Ekanayake, Shrideep Pallickara, and Geoffrey Fox
Department of Computer Science
Indiana University
Bloomington, IN, 47404
{
jekanaya, spallick, gcf
}
@
indiana.edu
ABSTRACT
Human interpretation is a common practice in many sci-entific data analyses. After the data is processed to a cer-tain extent, the remainder of the analyses is performed as a series of steps of processing and human interpretation. Many large scientific experiments span multiple organiza-tions, therefore, both the data and the teams involved in these experiments, are distributed across these organiza-tions. When the focus of an analysis is to extract new knowl-edge, collaboration is a key requirement. Real time or near real-time collaboration of expertise, on scientific data anal-yses, provides a better model of interpretation of the pro-cessed data. In this paper, we present a collaborative frame-work for scientific data analysis that is also secure and fault tolerant.
KEYWORDS:Collaboration Frameworks, Collabora-tive Distributed Systems, Scientific Computing.
1.
INTRODUCTION
The final step of most scientific data analyses is human in-terpretation. Experts in a particular area of study are located in different parts of the country and in different countries. Collaborative scientific data analysis is a promising field of study, since its goal is to bring the expertise scattered all over the world to a single data analysis session. The typical steps of a large-scale scientific data analysis are:
• Locate the data from experiments (typically a large volume of data).
• Execute various analysis functions on this data.
• Further process the analyzed data to produce graphs or simulations.
• Interpretation by scientists.
The collaborative approach yields tremendous benefits to the final interpretation, since it provides a framework for different experts to participate in the final step of the pro-cessing.
Typically, these analyses are performed in a server cluster, computational grid, or in a group of voluntary participants’ computers, as in the case of many projects under Berke-ley Open Infrastructure for Network Computing [1]. These analyses may produce a different number of outputs (re-sults), and these outputs may be generated at different time intervals. These factors decide the way a collaborative ses-sion can be set up for the interpretation of data produced by an analysis. If the analysis phase has multiple steps, and each phase takes fairly less time, then synchronous collab-oration would be the right model. On the other hand, if the analysis takes a longer time to complete, then it is better to run the analysis first, and collaborate on the interpretation of the results in an asynchronous manner. In either case, the sharing of results can be done as shared displays or shared events.
The shared display model fits best for simply sharing re-sults. Therefore, the scientists who only wanted to see the results of an ongoing experiment can see them without fur-ther processing at their sites using this model. The shared event model, on the other hand, permits the scientists to par-ticipate in an experiment actively. They can either, perform further processing such as fitting models on the received events or simply merge the results. Both these paradigms have their own merits and demerits, which we will discuss extensively when we present the architecture of the pro-posed system.
High Energy Physics (HEP) data analysis is an example of composable data analysis. Typically, the aim of such data analysis is to identify a particular type of events within the millions of events, generated by HEP experiments. The result of such analysis would be a histogram of possible events. The task of the analysis is to go through all the events available, and identify a particular set of events. We can easily break down the initial data set into smaller sub-sets, and run the same analysis software on these subsets concurrently. The resulting histograms can then be com-bined to produce the final result. In a collaborative ses-sion, each participant will receive these histograms (under a shared event model) and see them being merged in real-time. Please note that the term“event”in“shared event”
has no correlation to the events in the HEP data analysis.
As explained above, the scientists participating in a collab-orative session will not be from only one organization or a single administrative domain. It will be a global partic-ipation. Therefore, supporting such collaboration requires careful attention to the security aspects of the framework for collaboration. How to authenticate various participants and how to authorize them to perform various activities are some of the questions that should be answered by the col-laborative framework.
When many scientists participate in a collaborative session for data analysis, it is crucial to consider the fault tolerance aspect of the framework as well. A single failure in the processing entities or the software components should not waste the total man hours put into the analysis task. The framework should be able to respond to these failures and proceed with the analysis.
Typical collaborative frameworks in the scientific commu-nity fall into two categories. First is the framework for shar-ing data and heterogeneous distributed resources and, sec-ond is the framework for supporting collaboration among multiple participants. Most grid portal frameworks such as OGCE[2] and GridSphere[3] fall into the first category, and form a more static version of collaboration. Sharing data and resources among the participants is a key strength in these technologies. Software such as NEESGrid[4] extends the goal of sharing data and resources into near real-time tele-observation of sensor and experimental data and also to tele-operation of remote equipment control systems, al-lowing a dynamic form of collaboration among the partici-pants. The collaborative frameworks such as Enabling Vir-tual Organizations(EVO)[5] and Anabas[6] fall into the sec-ond category. They focus on developing tools for collabora-tion, such as shared white boards, audio video conferencing, recording, playback etc. Although the above systems sup-port different aspects of collaborative data analysis, there is no support for real-time (synchronous) collaborative data
analysis in either major Grid or Web 2.0 systems.
Our architecture provides a solution to both data analysis and real-time or near real-time sharing of results for a set of collaborative participants. The support for executing the data analyses in a close network proximity to the data min-imizes the overall data movement, and thereby favors sci-entific data analyses involving large volumes of distributed data. The multiple modes of collaboration, supported by the proposed framework enable the scientists to join a collabo-rative data analysis session using a model of their choice. For example, a scientist with limited computer power can decide to join a collaborative session using the shared dis-play mode. In addition, a scientist who joins in late to a col-laborative session can retrieve the results (events) as shared events or shared displays. This form of collaboration is best suited for the final steps of most scientific data analyses, which focus on extracting knowledge from the processed data. The goal of the proposed framework is to support this type of collaboration with secure and fault tolerant manner.
In this paper, we present a secure and fault tolerant frame-work for collaborative data analysis that supports different collaborative modes. Section 2 discusses the proposed ar-chitecture and the core software components. Section 3 of the paper discusses the advanced research prototype of the system and section 4 presents the performance evaluation of our system. Section 5 discusses the related work in this area of research. We present our conclusions and future work in section 6.
2.
ARCHITECTURE
Before presenting the architecture of the proposed frame-work, it is important to identify the key features, which are expected from the proposed framework. We will use the fol-lowing terms in our discussion. Master client- the user inter-face program that a scientist uses to initiate the data analysis task. Client - a user interface program used by other scien-tists who participate in the collaborative data analysis. The collaborative data analysis framework should support:
• Functionality to create an experimental session to keep track of relevant content such as analysis scripts, con-figuration files, and communication topics.
• Execution of the analysis in multiple geographic loca-tions where the data is available.
• Multiple modes of collaboration such as shared events, shared displays, synchronous, and asynchronous col-laboration.
• Capability to perform different post processing on the results received.
A framework capable of supporting the above requirements can be designed by incorporating three main software com-ponents:
1. A gateway to compute resources i.e. a server capable of operating at the head node of a cluster or as a grid enabled web service framework.
2. Content distribution framework as the communication layer. Publish/ subscribe messaging systems are best suited for this purpose, since we need to disseminate results and messages to all the participating entities within the collaborative session.
3. Software components to keep track of the state of the entire system, including the collaborative sessions and the available compute resources. In our implementa-tion, we have called these agents, and we use multiple instances of these to sustain failures.
2.1. Software Subsystems
We use Clarens server[7], developed at Caltech, for the data analysis framework and NaradaBrokering[8], a pub-lish/subscribe messaging substrate, as our communication layer.
2.1.1 Clarens Server
Clarens is a grid enabled web service framework, imple-mented in Python, which supports most common web ser-vice protocol stacks comprising HTTP and SOAP/XML-RPC with SSL/TLS encryption and X.509 certificate-based authentication. Although the server implementation of Clarens is Python-based, it provides client libraries for other languages such as Python, Iguana, JavaScript, and most im-portantly, the C++ based interpreted language supported by the ROOT Analysis framework[9]. Support for all the above features as well as the integrated support for ROOT makes Clarens a key framework for various scientific data analy-ses.
2.1.2 NaradaBrokering
NaradaBrokering is a content distribution infrastructure. The NaradaBrokering substrate itself comprises a dis-tributed network of cooperating broker nodes. It can be used as a message-oriented middleware or as a notifica-tion framework. Communicanotifica-tion within NaradaBrokering is asynchronous, and the substrate places no constraints on the size, rate, or scope of the interactions encapsulated within events or the number of entities present in the sys-tem. In addition, it incorporates support for wide verity of transport protocols making it an ideal communications in-frastructure for heterogeneous distributed systems.
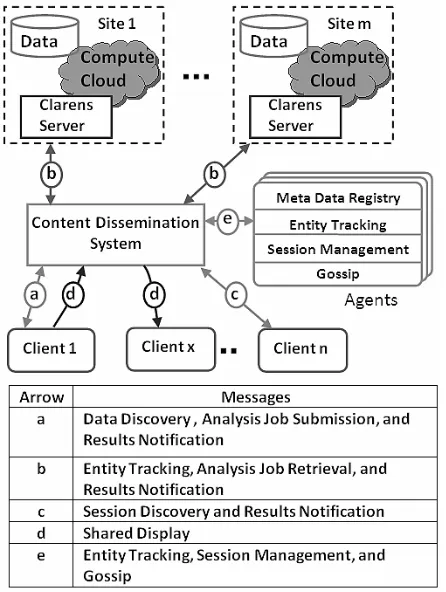
[image:3.612.325.548.144.440.2]2.2. Collaborative Data Analysis Framework
Figure 1 shows the architecture diagram of the system with the above software components, and how they interact to provide a scalable framework for collaborative data analy-sis.
Figure 1. Architecture of the Proposed Collaborative Data Analysis Framework
client software. After this initialization step, the scientist who initiates the analysis (client 1 in Figure 1) informs the agent to start the analysis. The Agent notifies the Clarens servers about the availability of the analysis jobs, and the Clarens servers starts processing them (shown by the ar-rowb). This approach decouples the communication logics associated with the computational servers from the client implementation. Once an analysis job is completed, the Clarens servers notify the results to the collaborating clients (shown by the arrowsaandc).
2.3. Collaboration Modes
The above architecture supports most of the typical collab-orative modes such as synchronous and asynchronous col-laboration each with either shared event or shared display modes.
2.3.1 Synchronous with Shared Event Mode
We support two main approaches within this type of collab-oration based on the way the results of the analysis are trans-ferred to the participating entities. One approach is based on the “push paradigm”, where the Clarens server publishes the result of an analysis job once it is available. The main ad-vantage of this approach is that the participating clients do not need to connect to the servers to retrieve results. Once they discover the topic over which the results are published, the results will be delivered to them as and when they are available at the servers. When the results are available at the client it can then perform additional processing on the results, which is a main benefit of this approach, if needed or simply save the results.
Another approach that we support is to let the Clarens servers publish the location of the result of a particular anal-ysis job once it is completed. These can be the inputs for another level of processing (if required). Although we have not yet explored this, the above feature enables a hierarchi-cal data analysis using our framework.
2.3.2 Synchronous with Shared Display Mode
In the shared display mode of collaboration, the mas-ter client handles the control of the collaborative session. When the master client receives a result from a Clarens server, it performs the necessary post processing such as fitting and plotting functions. If there is a change in the user interface, then the client program captures it, and pub-lishes it using the NaradaBrokering. Collaborating entities who are only interested in seeing the results of an experi-ment without actively participating in processing these re-sults (shown by the arrowd) receive these events. The client programs, used by scientists, will simply render the images
sent to them by the master client. This approach has many advantages, since it simply expands the number of ways of distributing the results of a particular analysis. The only post processing required at the client program is simply ren-dering these images. Another possibility is to upload the images to a web server so that they can be publicly avail-able.
2.3.3 Asynchronous Collaboration
Although a collaborative session is more interactive when all the participants are participating in real-time (in syn-chronous fashion), getting all the interested participants to participate in a session at the right time will be hard. This is especially true when they are participating from locations around the globe that are in different time zones. Therefore, we should expect to support participants who come late into a collaborative session or participants who need to only see the results of an already terminated collaborative session.
Our architecture supports both these types of collaborations in the following manner. When a master client creates a collaborative session with an agent, the agent keeps track of the collaborative session. It stores information such as the communication topics under which various events re-lated the experiment are disseminated, analysis functions, and the location of the data files. Nardabrokering’s reli-able delivery feature[11, 12] guarantees that once a client is subscribed to a particular topic it can retrieve all the events that have been published to the same topic from the creation of that topic. To eliminate the possibilities of overlapping topic names, master client appends a 128 bit long univer-sally unique identifier to each topic that it creates for a data analysis session. If a scientist joins a collaborative session, after it has been started, or after it has finished, the scien-tist can simply retrieve the events related to that experiment. Here also, the scientists can retrieve results events either as they were and perform further processing of their own or simply see the screenshots published by the master client. With the former method, the scientists will be able to see the results as if it is being performed in real-time.
2.4. Security
be able to discover topics and publish data to those topics. In a companion paper, S. Pallickara et al.[15] have given a detailed description of NaradaBrokering’s framework for the secure and authorized end-to-end delivery of streams. Clarens server uses the user credentials available in the pub-lish/subscribe messages for the authentication and autho-rization. This ensures that only the authorized scientists can perform analysis jobs using Clarens. This will ensure that only the authorized entities can create experimental sessions with an agent, and publish or subscribe to topics used.
2.5. Fault Tolerance
The proposed architecture does not have any central con-trol point such as a “portal” and hence poses no threat of a single-point-of-failure. The messaging infrastructure can be configured as a set of broker network, which supports fault tolerance[12]. Agents keep track of the ongoing ex-periments and other bookkeeping information relevant to the experiments. We incorporate a discovery mechanism for agents wherein the client is allowed to discover an avail-able agent based on certain criteria such as response time. Once such an agent is discovered, the client uses that agent to run the experiments. Agents also use a gossip protocol to synchronize the experiment’s metadata between them; this allows the system to tolerate individual agent failures. Clarens server failures during the execution of a data anal-ysis task can cause an incomplete result set. However, the composability property of the data analysis allows users to restart the analysis in a different Clarens server for the data files that have not been analyzed if the same data is available in the new location as well. In our current architecture, user intervention is required in selecting a new Clarens server and for restarting the analysis.
3.
IMPLEMENTATION
We selected a particle physics data analysis task as our main use-case and built a proof of concept implementation to see how the overall system works. Physicists at Caltech were using the Clarens server and ROOT to perform var-ious data analyses tasks relating to particle physics experi-ments. ROOT was the data analysis framework for the parti-cle physicist, and the Clarens server also supports execution of data analysis functions written in ROOT. However, their use of these technologies did not help them to collaborate over an analysis task or to process data available at differ-ent geographic locations. We have access to their analy-sis scripts, and demonstrated that our system can perform the data analysis in a collaborative and much more scalable manner than before.
ROOT also comes with a C++ interpreter named CINT[16], which can be used for rapid prototyping. Thus, we also
de-cided to use CINT as our user interface programming lan-guage. With this decision, our implementation uses ROOT as an object oriented data analysis framework, of which the analysis functions are written, and as a language for devel-oping user interfaces.
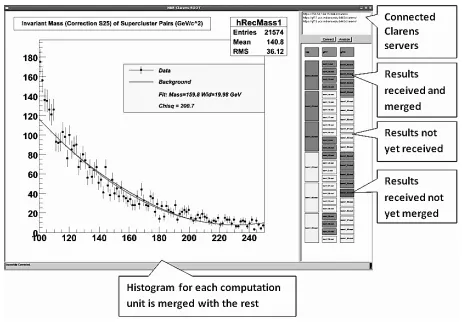
[image:5.612.320.551.389.550.2]Integrating three software systems that are completely het-erogeneous with respect to the implementation details is one of the major challenges we faced i.e. integrating NaradaBrokering written in Java with user interfaces writ-ten in ROOT and with Clarens server writwrit-ten in Python. The architecture uses a publish/ subscribe messaging infrastruc-ture as the communication medium, and hence it should be accessible to all the entities in the system irrespective of the language they were written. We implemented a pub-lish/ subscribe client in C++, and incorporated the necessary changes into Clarens in the Python language. This allows both Clarens and the user interfaces written in ROOT to ac-cess the publish/ subscribe capabilities of NaradaBrokering. During the first phase of the work, we exclude the imple-mentation of agents, and we are currently working on com-pleting the implementation to comply with the proposed ar-chitecture. Figure 2 shows the user interface of the client program that a physicist can use for collaborative data anal-ysis.
Figure 2. User Interface of Proof of Concept Implementation
jobs (we call themrootlets) the user interface starts submit-ting these jobs to the appropriate servers. This step happens only in the master client. The rest of the participants, once connected to a collaboration session, simply await the re-sults.
At the end of processing each rootlet, the respective Clarens servers notify the clients publishing the results. Once an event is received, the user interface performs the necessary post-processing. The cells shown at the right hand side of the screenshot (Figure 2) are the individual analysis jobs. In our use-case, the size of a single data file is 33MB and we group multiple of these files for a single execution unit (rootlet) for analysis. The resulting histogram of an analysis job is nearly 9KB in size. Once a histogram is received by the user interface, it merges the histogram with the existing histograms and executes a “fitting” function to fit a curve to the available data, and finally, it updates the current result displayed in the canvas.
4.
RESULTS
[image:6.612.327.555.73.262.2]We performed several benchmarks using our proof of con-cept implementation. First, we measured the time for vari-ous execution tasks in our framework. Figure 3 shows the experiential setup that was used, while Figure 4 highlights the key metrics that we obtained.
Figure 3. Benchmark Setup
After identifying key execution times we measured the propagation time of events from the end of the data anal-ysis phase till it reaches the shared event clients and from thereon to the shared display clients. We measured this by varying the number of participants within the collaboration session to see the effect of the number of participants on the event propagation latencies.
[image:6.612.95.256.410.560.2]The results obtained by the above benchmark are shown in
Figure 4. Main Processing Tasks and their Execution Times
the Figure 5 in which the event propagation time is shown in a logarithmic scale. In our architecture, at least one par-ticipant, typically, the master client should publish screen-shots of the client software to support the shared display mode of collaboration. The additional cost in capturing the screen and publishing it adds a delay to the shared display events. This is the reason for having a higher event propaga-tion time for shared display type collaborapropaga-tion in the graph. From these results, it is evident that the number of collabo-rators does not cause any performance implications on the event propagation time. Typically, these numbers of par-ticipants are significantly lower than the scalability and the peak throughputs that can be sustained by NaradaBrokering messaging substrate.
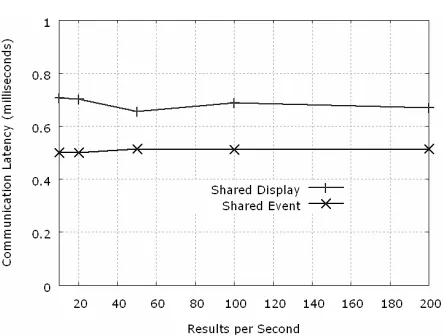
Next, we performed a benchmark to see how the network overhead varies with the increase in the rate at which the results are generated from the analysis. We also went on to generate a high number of shared display events such as 200 images per second to see the network overhead caused by the higher rates. Figure 6 shows our results.
Figure 5. Latencies Involved for Interactions in Different Collaboration Modes
Figure 6. Network Overhead for Collaborative Interactions under Varying Results Stream Rates
the characteristics of the underlying data analysis task.
5.
RELATED WORK
Collaboration among various entities is a well studied field in both industry and the academic communities. Many of proprietary collaborative frameworks such as WebEx[17], Windows Meeting Space [18] and Anabas [6] are all fo-cused on sharing multimedia content over a collaborative session. These include audio, video streams, desktop shar-ing, online meetings, collaborative whiteboards and presen-tations. Academia also has similar set of applications focus-ing on data sharfocus-ing and multimedia collaborations. EVO[5] (the successor of the Virtual Room Videoconferencing Sys-tem) is a tool from Caltech which supports instant messag-ing, video conferencing and desktop sharing functionalities.
These functionalities make them essential software compo-nents for interactive collaborative sessions where group of people can exchange data, ideas and suggestions. However, use of these systems for sharing real-time results of scien-tific data analysis is not straight forward where the focus is more towards dissemination of content irrespective of the format of the content.
The Data Trubine[19] presented by S. Tilak et.al. is a con-tent dissemination framework for scientific and engineering applications. They claim that the many content dissemina-tion systems based on messaging architectures do not suit well for scientific data dissemination. However, we argue that the content dissemination should be decoupled from the complexities of the specific data type used by the scientific application. In our implementation we used NaradaBroker-ing, a publish/ subscribe messaging framework, to transfer information relating to the collaborative sessions as well as data files generated during the analyses. Higher level APIs provide the specific level of abstractions for the data that the system transfers. For example, when an analysis job is com-pleted we can either publish the location of the output or the output itself using Naradabroking. Real-time Data Viewer (RDV)[20] is an interface for viewing real-time, synchro-nized, streaming data from an equipment site. RDV can also be configured to receive streams from the Data Turbine server. This setup is the only close implantation that we found similar to our work. However, RDV supports only the time series data from equipments where as in our archi-tecture we pose no limitation on the way the scientist can process the received data. Collaborating participants can re-ceive any form of data depending on the analyses task and they can perform various posts processing on these data as well.
Portal frameworks such as OGCE, uPortal[21] and Grid-Sphere support collaboration by providing a coherent framework for sharing data, compute resources and services to its participants. The web browser based interface allows minimal software for accessing data and services provided by portals, and also they support portlets for monitoring and visualizing data streams generated by scientific applications or sensors. Our user interface can be made into a portlet so that the participants can see the result on the portal. V. Watson presents[22] design criteria for scientific collabora-tive applications where he discusses different collaboracollabora-tive modes such as synchronous and asynchronous collabora-tion.
6.
CONCLUSION AND FUTURE WORK
[image:7.612.65.287.290.458.2]fo-cusing on delivering multimedia content to the participants. Our architecture integrates processing entities, content dis-semination sub system, session management entities and end users into a single framework. Participants can collab-orate over data analyses where the results of a particular analysis is relayed to all the participants either in its raw format or as screenshots, produced after post processing, in real-time. We have successfully converted a stand-alone application used by particle physicist researchers at Caltech into a collaborative application using our architecture.
Although our framework can withstand failures of agents and individual collaborative client applications, failure of Clarens servers results in an incomplete result set. The com-posability feature of the data analysis allows restarting of the experiment only for the failed server, as the analysis does not depend on the order in which the results of sub analyses are combined. The framework requires user inter-vention in selecting the data set at a different site (if avail-able). In our future work, we will explore the possibility of using the agents to automatically identify the available Clarens servers attached to the same data set and restart the analysis without user interventions. Currently, the user terfaces of our application is implemented in ROOT’s in-terpreted language CINT which is the de-facto standard for data analysis toolkit in particle physics research. However, R[23] is an another data analysis toolkits used by many scientific data analyses. Supporting multiple data analy-sis toolkits to expand the usability of our implementation is also one of our research goals.
REFERENCES
[1] David P. Anderson, “BOINC: A System for Public-Resource Computing and Storage,” GRID 2004, p. 4-10.
[2] OGCE -The Open Grid Computing Environments Portal and Gateway Toolkit, http://www.collab-ogce.org
[3] J. Novotny et al, “GridSphere: a portal framework for build-ing collaborations,” Concurrency and Computation: Practice & Experience, Vol. 16, No. 5, 2004, p.503-513.
[4] S. Gullapalli et al, “Showcasing the Features and Capabilities of NEESgrid: A Grid Based System for the Earthquake Engi-neering Domain,” Proceedings. 13th IEEE International Sym-posium on High performance Distributed Computing, 2004.
[5] EVO Collaboration Network, http://evo.caltech.edu/
[6] Anabas Inc., http://www.anabas.com/
[7] F. Van Lingen et al, “The Clarens Web service framework for distributed scientific analysis in grid projects,” Proceedings
of the 2005 International Conference on Parallel Processing Workshops ( ICPPW’05), p. 45 - 52
[8] S. Pallickara, G. Fox, “NaradaBrokering: A Distributed Mid-dleware Framework and Architecture for Enabling Durable Peer-to-Peer Grids,” Middleware 2003, p. 41-61
[9] ROOT - An Object Oriented Data Analysis Framework, http://root.cern.ch/
[10] S. Pallickara, J. Ekanayake, G. Fox: “A Scalable Approach for the Secure and Authorized Tracking of the Availability of Entities in Distributed Systems,” IPDPS 2007: 1-10.
[11] S. Pallickara et al, “On the Costs for Reliable Messaging in Web/Grid Service Environments,” Proceedings of the 2005 IEEE International Conference on e-Science & Grid Comput-ing. Melbourne, Australia.pp 344-351.
[12] S. Pallickara, H. Bulut, G. Fox, “Fault-Tolerant Reliable Delivery of Messages in Distributed Publish/Subscribe Sys-tems,” Proceedings of the 4th IEEE International Conference on Autonomic Computing.
[13] Steenberg et al, “The Clarens Web Services Architecture,” Proceedings of CHEP2003, La Jolla, Paper MONT008, 2003.
[14] I. Foster and C. Kesselman, “Globus: A Metacomputing In-frastructure Toolkit,” Proceedings of the Workshop on Envi-ronments and Tools for Parallel Scientific Computing, SIAM, Lyon, France, August 1996.
[15] S. Pallickara et al., “A Framework for Secure End-to-End Delivery of Messages in publish/Subscribe Systems,” GRID 2006, p.215-222.
[16] CINT - The CINT C/C++ Interpreter, http://root.cern.ch/twiki/bin/view/ROOT/CINT
[17] WebEx - Cisco Web Meetings and Collaboration Solutions, http://www.webex.com/
[18] Windows Meeting Space, http://www.microsoft.com/windows/products/ win-dowsvista/features/details/meetingspace.mspx
[19] S. Tilaky et al, “The Ring Buffer Network Bus (RBNB) DataTurbine Streaming Data Middleware for Environmental Observing Systems,” at third IEEE International Conference on E-Science and Grid Computing, India, 2007.
[20] RDV-Real-time Data Viewer, http://it.nees.org/software/rdv/
[21] uPortal, http://www.uportal.org/
[22] V. Watson, “Supporting Scientific Analysis within Collab-orative Problem Solving Environments,” Proceedings of the 34th Annual Hawaii International Conference on System Sci-ences ( HICSS-34, 2001.