This is a repository copy of
Force and Topography Reconstruction Using GP and MOR for
the TACTIP Soft Sensor System
.
White Rose Research Online URL for this paper:
http://eprints.whiterose.ac.uk/101732/
Version: Accepted Version
Proceedings Paper:
de Boer, G, Wang, H orcid.org/0000-0002-6546-1241, Ghajari, M et al. (3 more authors)
(2016) Force and Topography Reconstruction Using GP and MOR for the TACTIP Soft
Sensor System. In: Alboul, L, Damian, D and Aitken, JM, (eds.) Towards Autonomous
Robotic Systems (Lecture Notes in Computer Science). 17th Annual Conference, TAROS
2016, Sheffield, UK, June 26--July 1, 2016, Proceedings, 28-30 Jun 2016, Sheffield, UK.
Springer . ISBN 978-3-319-40378-6
https://doi.org/10.1007/978-3-319-40379-3_7
© 2016, Springer International Publishing. This is an author produced version of a paper
published in Towards Autonomous Robotic Systems (Lecture Notes in Computer Science).
Uploaded in accordance with the publisher's self-archiving policy. The final publication is
available at Springer via http://dx.doi.org/10.1007/978-3-319-40379-3_7
[email protected] https://eprints.whiterose.ac.uk/ Reuse
Unless indicated otherwise, fulltext items are protected by copyright with all rights reserved. The copyright exception in section 29 of the Copyright, Designs and Patents Act 1988 allows the making of a single copy solely for the purpose of non-commercial research or private study within the limits of fair dealing. The publisher or other rights-holder may allow further reproduction and re-use of this version - refer to the White Rose Research Online record for this item. Where records identify the publisher as the copyright holder, users can verify any specific terms of use on the publisher’s website.
Takedown
If you consider content in White Rose Research Online to be in breach of UK law, please notify us by
Force and Topography Reconstruction using GP and MOR
for the TACTIP Soft Sensor System
G. de Boer1,*, H. Wang2, M. Ghajari1, A. Alazmani2, R. Hewson1, P. Culmer2
1
Department of Aeronautics, Imperial College London, London, SW7 2AZ, UK
{g.de-boer,m.ghajari,r.hewson}@imperial.ac.uk
2
School of Mechanical Engineering, University of Leeds, Leeds, LS2 9JT, UK
{h.wang1,a.alazmani,p.r.culmer}@leeds.ac.uk
Abstract. Sensors take measurements and provide feedback to the user via a calibrated system, in soft sensing the development of such systems is compli-cated by the presence of nonlinearities, e.g. contact, material properties and complex geometries. When designing soft-sensors it is desirable for them to be inexpensive and capable of providing high resolution output. Often these constraints limit the complexity of the sensing components and their low reso-lution data capture, this means that the usefulness of the sensor relies heavily upon the system design. This work delivers a force and topography sensing framework for a soft sensor. A system was designed to allow the data corre-sponding to the deformation of the sensor to be related to outputs of force and topography. This system utilised Genetic Programming and Model Order Reduction methods to generate the required relationships. Using a range of 3D printed samples it was demonstrated that the system is capable of recon-structing the outputs within an error of one order of magnitude.
Keywords: Soft-sensing, Genetic Programming, Model Order Reduction
1
Introduction
The biologically inspired TACTIP system, which features a deformable 'finger-tip' membrane upon which traceable elements are placed [6, 7], is a robust and economic soft sensor. The TACTIP system has previously been used for shape recognition [8], edge detection analysis [9] and determining surface texture [10]. However, obtaining quantitative force and topography informa-tion from TACTIP is non-trivial and complicated by the presence of nonlinear material behaviour, larger deformations, and complex geometries.
Computational optimisation techniques provide an efficient way to address these challenges. GP is a biologically inspired evolutionary based algorithm for defining an equation which gives the best evaluation of an output based on a set of inputs [11]. GP has been used to design sensors associated with autonomous robotics [12], vision [13], and locomotion [14]. GP has also been successfully applied to soft sensors associated with biochemical applications [15, 16]. Other methods have also been used in the design of soft sensor systems such as Artificial Neural Networks (ANN) [17] and Response Surface Methods (RSM) [18]. In conjunction, Singular Value Decomposition (SVD) provides a means to decompose a set of discrete data into a lower order model which maintains the highest possible level of accuracy [19]. This is a useful approach because it efficiently and accurately provides a method, known as Model Order Reduction (MOR), for describing a large amount of data with a much smaller subset. MOR has been used in the design of piezo-electric [20], magnetic resonance [21] and soft sensing applications [18].
2
Materials & Methods
2.1 TACTIP sensor
The TACTIP sensor is a biologically inspired soft tactile sensor designed by the Bristol Robotics Laboratory [6], it uses a camera to track the movement of markers on a compliant skin. As shown in Fig 1(a) TACTIP consisted of a compliant skin with markers on the inner surface, a soft body covered by the compliant skin was filled with clear Gel, an IR LED is the illumination source, a clear Acrylic sheet separates the Gel inside the soft body with the camera system, and a USB HD camera captures the image of the inner surface of the skin. Details of the marked skin design and manufacture are described in [7]. A photograph of the TACTIP indenting a surface is presented in Fig. 1(b), and the images captured by the internal USB HD camera are given in Fig. 2. In order to recognize the white markers (pins) and track their movement, a real-time image processing programme was implemented in LabVIEW (Na-tional Instruments, USA).
Fig.1. TACTIP sensor (a) Cross-section schematic and (b) test bed.
2.2 Indentation test apparatus
A test platform was built to repeatedly probe the sensor system (Fig. 3) and includes a micropositioning linear stage (T-LSR75B, Zaber Technologies Inc., Canada), the TACTIP sensor with USB camera, a 6-axis load cell (Nano 17-E, ATI Industrial Automation, USA), and a computer based data acquisition sys-tem (myRio, National Instruments, USA). The linear stage has a min step of
T
was capable of a measuring a range of ±35 N in the Z axis, with a resolution of 6.25 mN.
Fig.3. Photograph of the indentation test apparatus.
2.3 Topography
In order to investigate a range of topographies a selection of samples with axisymmetric features were manufactured. Fig. 4(a) illustrates the cross sec-tion of the topography, the maximum radius of the samples was 21 mm. The height of topography h is described by Eq. (1),
h = A exp r 2
where r is the sample radius. A and c are parameters which differ for the
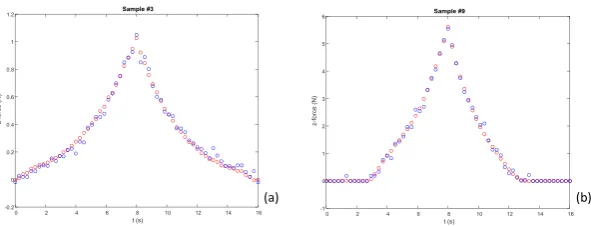
m = 12 samples, A represents the maximum height and c the rate of decay with increasing radius. Parametrising the topography as according to Eq. (1) means that a lower order model can be used to accurately reconstruct the range of shapes, this is because the modal decomposition of the paramet-rised topography will have similar properties (see Section 3.2). The values of the parameters relating to topography for the samples used are given in Ta-ble 1. Each sample was manufactured by 3D printer (Objet 1000, Stratasys Ltd., USA) with ABS material. The material of the manufactured samples is rigid in comparison to the surface of the TACTIP sensor, therefore during indentation only the surface of the probe deforms and the topography re-mains unchanged. Two example 3D printed samples with topography are shown in Fig. 4(b).
[image:6.595.129.467.362.463.2]
Fig. 4. (a) Cross-section of the parameterised topography. (b) Photography of 3D printed Sam-ples #3 and #9.
Sample #1 #2 #3 #4 #5 #6 #7 #8 #9 #10 #11 #12
A [mm] 5 5 5 3 3 1 -5 -5 -5 -3 -3 -1
c [mm] 8 4 2 6 3 2 8 4 2 6 3 2
Table 1. Topography parameters for the 3D printed samples.
3
Theory
3.1 Force reconstruction
The normal forces, , were recorded by the force sensor over the duration of indentation and range of samples. This is defined by Eq. (2),
[image:6.595.117.478.503.549.2]= Fz1,1 Fz1,n Fzm ,1 Fzm ,n (2)
where Fzi,j is the normal force for t As
there are m samples and n time steps, the size of is 1 × mn . is the TACTIP pin deformations which correspond to the same time steps and sam-ples used to construct the normal force vector as described by Eq. (3), where
Dx,ki,j , Dy,ki,j
step. As there are p samples and the size of is 2p × mn.
=
D1,1x,1 Dx,11,n Dx,1m ,1 Dx,1m ,n
Dx,p1,1 Dx,p1,n Dx,pm ,1 Dx,pm ,n
Dy,11,1 Dy,11,n Dy,1m ,1 Dy,1m ,n
Dy,p1,1 Dy,p1,n Dy,pm ,1 Dy,pm ,n
(3)
In order to correlate the force as a function of time and sample selection to the pin deformations, is related to the matrix using GP. GP was used to create an equation linking the pin deformations to normal force by generat-ing a range of possible algebraic descriptions from combinations of the input variables. These descriptions can contain any set of prescribed expressions and as such can describe complex non-linear trends which are not obtained through simple data fitting analyses. The general statement of the expres-sion obtained from GP in this case is given by Eq. (4),
= f Dx,q, Dy,q q p+ (4)
This equation does not necessarily contain all input variables as their useful-ness is evaluated in determining the output, hence q describes a subset of all
3.2 Topography reconstruction
The topography heights for the samples are arranged into a matrix which is defined by Eq. (5),
=
h11 h1m
h1s hsm
(5)
where hji location I s heights
per sample and the size of is s × m . Importantly the definition of topog-raphy is discrete such that any numerical description of topogtopog-raphy can be included and does not rely on the analytical description of Eq. (1) for the 3D printed topography. The SVD of allows the matrix to be written as the product of three component matrices , , and T. The SVD of can be truncated by defining a rank K which determines the amount of information kept by the approximation. This leads to Eq. (6) which gives the MOD of ,
K K KT , K min m, s (6)
where Kis the first K columns of s × K , K is the first K columns and rows of K × K , and K is the first K columns of m × K. The matrix K are known as the modes of the SVD of . is defined as a matrix of pin de-formations at a specific instance in time. In order to correlate the modes of topography to the pin deformations each component in KT K × m were related to the matrix 2p × m by using GP in a similar way to that de-scribed in Section 3.1. The relationships which are generated describe the correlation between the pin deformations and modes of the reduced order model for topography as given by Eq. (7),
VlT = f dx,q, dy,q l = 1, , K q p+ (7)
4
Results & Discussion
4.1 Force reconstruction
linearly increased over time to the maximum 6 mm at the halfway point and then back to zero, in total p = 134 pins were recorded during the indenta-tion. Analysing the data produced using the multi-gene GP toolbox in Matlab
gptips [22] produced expressions for the normal force as a function of a sub-set of pin deformations. The GP solver was run 10 times and the result which produced the lowest root-mean-squared-error over the complete set was selected as the overall best fit. The number of generations used was 500, the population size was 300, the number of genes was 6, and the number of terms each gene could have was 12. The total time to compute was ~120 minutes using a 2.8 GHz 4-core CPU running with 3GB of RAM for the process, the minimum RMS error over all samples and time steps achieved was
0.0532 N with a mean of 0.0344 N and variance of 0.0098 N.
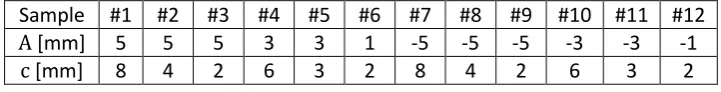
The equation generated by GP indicates how the normal force can be recon-structed from the pin deformations, not all of the pins are included in the terms and as such only those pins with a significant influence are used. Fig. 5 shows the normal force reconstruction for two of the manufactured samples, in these plots blue represents the reconstructed and red represents the corded data. The accuracy of the reconstructed points compared to the re-corded is reasonable for each of the forces investigated, with the error found to be an order of magnitude smaller than the recorded forces themselves. Generally the shape of the force responses is well represented and the peak value is obtained to within an order of magnitude. The low resolution of the pin deformations can be seen to influence the types of responses generated by using them, whereby a higher resolution result is generated but is still subjected to certain regions of pixilation. Sub-pixel tracking of pin deforma-tions would allow a continuous expression to be generated in this way.
Fig. 5. Normal force reconstruction for (a) Sample #3, (b) Sample #9.
4.2 Topography reconstruction
Topography coordinates were generated for the samples and arranged into the matrix as outlined in Section 3.2, the SVD of was undertaken using Matlab (TheMathsWork Inc., USA) and the reduced order model for topogra-phy was then chosen by setting the rank K = 3, this represents 25% of the total number of modes. Using the same procedure as described in Section 4.1 the modes of topography were correlated to the maximum pin deforma-tions using GP. The equadeforma-tions generated indicate how the modes of the to-pography can be reconstructed from the pin deformations at the maximum indentation as a function of the sample selection.
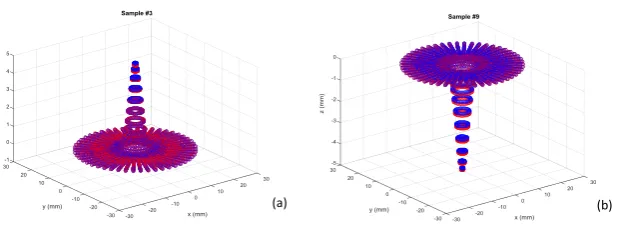
Fig. 6 shows two of the three mode reconstructions using the equations gen-erated by GP. This is because m = 12 points need to be considered for to-pography reconstruction in comparison to mn = 732 for the force recon-struction. Increasing the number of samples tested increases the likelihood that the reconstruction will be of a lower accuracy. It is interesting to note that each of the modes has a very different type of response and that GP is able to find a relationship that accurately correlates them all to the pin de-formations, which themselves have similar trends. Using the modes deter-mined from GP the topography was subsequently reconstructed. Fig. 7 shows the topography reconstructions for two samples #3 and #8, chosen as an example. In this figure blue represents the reconstructed and red repre-sents the recorded data, the reconstructed topography can be seen to be accurate to within an order of magnitude using MOR and GP.
The minimum RMS error in the topography reconstruction was 0.0512 mm with a mean of 0.0813 mm and variance of 0.00578 mm. The error in the reconstructed points is at least two orders of magnitude smaller than the range of recorded topography data. The rank of K = 3 was chosen to dem-onstrate that the topographies can be accurately reconstructed from a lim-ited number of modes. As the number of modes is increased the accuracy of the reconstruction increases however so does the computational expense.
Fig. 6. Reconstruction of topography modes, (a) 1st mode, (b) 2nd mode.
Fig. 7. Topography reconstruction for (a) Sample #3 (b) Sample #9.
5
Conclusion
A method for soft-sensor force and topography reconstruction using the TACTIP sensor as an example is presented. Physical testing was undertaken to evaluate a novel method in which GP derived equations were obtained to link the sensor pin deformations and force/topography. In the case of topog-raphy MOR was used to decompose the response into modes which simpli-fied the reconstruction process. Both force and topography were
recon-0 2 4 6 8 10 12
-0.5 -0.4 -0.3 -0.2 -0.1 0 0.1 0.2 0.3 0.4 0.5 Sample # M o d e 1 (a)
0 2 4 6 8 10 12
-0.5 -0.4 -0.3 -0.2 -0.1 0 0.1 0.2 0.3 0.4 0.5 Sample # M o d e 2 (b)
[image:11.595.141.450.417.530.2]structed to within an order of magnitude of the known values using GP. It was shown for the force reconstruction that low resolution pin deformations can be used to give a high resolution result via the GP procedure and that inaccuracies in the resulting relationships could be improved by sub-pixel resolution imaging. While this work focuses on the TACTIP soft sensor, the method provides a more general approach to reconstructing physical quanti-ties with high fidelity from non-linear inputs a process which is non-trivial or impossible with analytical approaches. The method is a promising ap-proach to be further explored in soft sensing applications such as grasping and edge detection, for real-time sensing ANN or RSM may be used in place of GP to develop the relationships required.
Acknowledgements
We would like to thank and acknowledge The Leverhulme Trust (Grant num-ber: RPG-2014-381) for funding this work.
References
1. Y T L P J R D H I
IEEE R A M 2014.
2. K “ F -shaped gelforce: sensor for measuring surface traction fields for
H IEEE T -47.
3. D. Xu, G. E. Loeb, J A F T B atio
Robotics and Automation (ICRA), 2013 IEEE International Conference on. IEEE, 2013: 3056-3061.
4. N. Wettles, V. J. Santos, R. S. Johansson, G. E. Loeb. B T “ A .
Advanced Robotics, 2008, 22: 829-849.
5. T A “ E -inspired artificial
finger-tip in real- “ -2577.
6. C C C M T P J R D T “ B
B I E E D
7. B W G G C M T P J R TACTIP Tactile Fingertip
De-vice, Challenges in r P
8. T A C C J R T P C “ C M R time Processing of
B I T “ E F “ R T
Autonomous Robotic Systems (TAROS) conference. Plymouth, UK., 2010.
9. C R C M T P D D C C D -Based Tactile Feedback
Using a Biologically-I “ M D T 124,
2011.
10. B. Winstone, et al. "TACTIP-tactile fingertip device, texture analysis through optical
track-ing of skin features." Biomimetic and Biohybrid Systems. Sprtrack-inger Berlin Heidelberg, 2013. 323-334.
11. J. Koza, Genetic programming: on the programming of computers by means of natural
se-lection. Vol. 1. MIT press, 1992.
12. S. Terence, R. Heckendorn. "A practical platform for on-line genetic programming for
ro-botics." Genetic Programming Theory and Practice X. Springer New York, 2013. 15-29.
13. W. Chih-Hung, et al. "Target Position Estimation by Genetic Expression Programming for
Mobile Robots With Vision Sensors." Instrumentation and Measurement, IEEE Transac-tions on 62.12 (2013): 3218-3230.
14. S. Pedro, et al. "Automatic generation of biped locomotion controllers using genetic
pro-gramming." Robotics and Autonomous Systems 62.10 (2014): 1531-1548.
15. A K G “ E J E R R tion of
P o-ceedings of the 2002 Congress on Evolutionary Computation, vol. 1, 12 17 May (2002), pp. 896 901.
16. S. Suraj, S. Tambe, "Soft-sensor development for biochemical systems using genetic
pro-gramming." Biochemical Engineering Journal 85 (2014): 89-100.
17. A. Alexandridis, "Evolving RBF neural networks for adaptive soft-sensor
de-sign." International journal of neural systems 23.06 (2013): 1350029.
18. J. Shi, L. Xing-Gao, "Product quality prediction by a neural soft-sensor based on MSA and
PCA." International Journal of Automation and Computing 3.1 (2006): 17-22.
19. V. Buljak, Inverse Analyses with Model Reduction: Proper Orthogonal Decomposition in
Structural Mechanics, Computational Fluid and Solid Mechanics, Springer, 2012.
20. Q. Zu-Q A
Smart Materials and Structures, 10(4), pp 807-818, 2001.
21. M. Kudryavtsev, et al. "A compact parametric model of magnetic resonance micro
sen-sor." Thermal, Mechanical and Multi-Physics Simulation and Experiments in Microelec-tronics and Microsystems (EuroSimE), 2015 16th International Conference on. IEEE, 2015.
22. D. Searson, "GPTIPS". https://sites.google.com/site/gptips4matlab/. [Accessed online]