2 6 M a y 2 0 1 6 | V O L 5 3 3 | N a T U R E | 5 2 1
LETTER
doi:10.1038/nature17953Ion-induced nucleation of pure biogenic particles
Jasper Kirkby1,2, Jonathan Duplissy3,4, Kamalika Sengupta5, Carla Frege6, Hamish Gordon2, Christina Williamson1†, Martin Heinritzi1,7, Mario Simon1, Chao yan3, João almeida1,2, Jasmin Tröstl6, Tuomo Nieminen3,4, Ismael K. Ortega8, Robert Wagner3, alexey adamov3, antonio amorim9, anne-Kathrin Bernhammer7,10, Federico Bianchi6,11,Martin Breitenlechner7,10, Sophia Brilke1, Xuemeng Chen3, Jill Craven12, antonio Dias2, Sebastian Ehrhart1,2, Richard C. Flagan12, alessandro Franchin3, Claudia Fuchs6, Roberto Guida2, Jani Hakala3, Christopher R. Hoyle6,13, Tuija Jokinen3, Heikki Junninen3, Juha Kangasluoma3, Jaeseok Kim14†, Manuel Krapf6, andreas Kürten1, ari Laaksonen14,15, Katrianne Lehtipalo3,6,
Vladimir Makhmutov16, Serge Mathot2, Ugo Molteni6, antti Onnela2, Otso Peräkylä3, Felix Piel1, Tuukka Petäjä3,
arnaud P. Praplan3, Kirsty Pringle5, alexandru Rap5, Nigel a. D. Richards5,17, Ilona Riipinen18, Matti P. Rissanen3, Linda Rondo1, Nina Sarnela3, Siegfried Schobesberger3†, Catherine E. Scott5, John H. Seinfeld12, Mikko Sipilä3,4, Gerhard Steiner3,7,19,
yuri Stozhkov16, Frank Stratmann20, antonio Tomé21, annele Virtanen14, alexander L. Vogel2, andrea C. Wagner1, Paul E. Wagner19, Ernest Weingartner6, Daniela Wimmer1,3, Paul M. Winkler19, Penglin ye22, Xuan Zhang12, armin Hansel7,10, Josef Dommen6, Neil M. Donahue22, Douglas R. Worsnop3,14,23, Urs Baltensperger6, Markku Kulmala3,4, Kenneth S. Carslaw5 & Joachim Curtius1
Atmospheric aerosols and their effect on clouds are thought to be important for anthropogenic radiative forcing of the climate, yet remain poorly understood1. Globally, around half of cloud condensation nuclei originate from nucleation of atmospheric vapours2. It is thought that sulfuric acid is essential to initiate most particle formation in the atmosphere3,4, and that ions have a relatively minor role5. Some laboratory studies, however, have reported organic particle formation without the intentional addition of sulfuric acid, although contamination could not be excluded6,7. Here we present evidence for the formation of aerosol particles from highly oxidized biogenic vapours in the absence of sulfuric acid in a large chamber under atmospheric conditions. The highly oxygenated molecules (HOMs) are produced by ozonolysis of α-pinene. We find that ions from Galactic cosmic rays increase the nucleation rate by one to two orders of magnitude compared with neutral nucleation. Our experimental findings are supported by quantum chemical calculations of the cluster binding energies of representative HOMs. Ion-induced nucleation of pure organic particles constitutes a potentially widespread source of aerosol particles in terrestrial environments with low sulfuric acid pollution.
It is thought that aerosol particles rarely form in the atmosphere without sulfuric acid3,4, except in certain coastal regions where iodine oxides are involved8. Furthermore, ions are thought to be relatively unimportant in the continental boundary layer, accounting for only around 10% of particle formation5. Sulfuric acid derives from anthro-pogenic and volcanic sulfur dioxide emissions as well as dimethyl sulfide from marine biota. However, typical daytime sulfuric acid concentrations (105–107 cm−3, or 0.004–0.4 parts per trillion by vol-ume (p.p.t.v.) at standard conditions) are too low for sulfuric acid and water alone to account for the particle formation rates observed in the lower atmosphere9, so additional vapours are required to stabilize any embryonic sulfuric acid clusters against evaporation. Base species such as amines can do this and can explain part of atmospheric particle
nucleation10. It is well established that oxidation products of volatile organic compounds (VOCs) are important for particle growth11, but whether their role in the smallest particles is in nucleation or growth alone has remained ambiguous4,12,13. Recently, however, it has been shown that oxidized organic compounds do indeed help to stabilize sulfuric acid clusters and probably play a major role in atmospheric particle nucleation6,14,15. We refer to these compounds as HOMs (highly oxygenated molecules) rather than ELVOCs (extremely low-volatility organic compounds)16 because the measured compounds span a wide range of low volatilities.
Here we report atmospheric particle formation solely from bio-genic vapours. The data were obtained at the CERN CLOUD chamber (Cosmics Leaving OUtdoor Droplets; see Methods for experimental details) between October 2012 and November 2013. In contrast with other works that have reported organic particle formation without intentional addition of sulfuric acid6,7, here we measure the cluster chemistry and the role of ions, and rule out contamination.
Precursor VOCs in the atmosphere arise predominantly from nat-ural sources such as vegetation and largely comprise isoprene (C5H8), monoterpenes (C10H16), sesquiterpenes (C15H24) and diterpenes (C20H32). Here we have studied α-pinene (C10H16) because it is the most abundant monoterpene, often exceeding 50 p.p.t.v. in the conti-nental boundary layer17. We oxidized α-pinene by exposure to ozone and also to hydroxyl radicals (OH·) produced from ozone photoly-sis and secondary reactions. To measure the relative importance of these oxidants we also performed a few pure ozonolysis experiments (in which we removed OH· with a 0.1% H2 scavenger) and a few pure hydroxyl experiments (in which we generated OH· by photolysis of gas-phase nitrous acid, HONO). Two nitrate chemical ionization atmospheric pressure interface time-of-flight (CI-APi-TOF) mass spectrometers measured neutral gas-phase compounds in the cham-ber (H2SO4 and HOMs). Therefore, for this study, HOMs are implic-itly defined as oxidized organic compounds that can be detected by a nitrate CI-APi-TOF; related molecules with a lower oxidation state
1Goethe University Frankfurt, Institute for Atmospheric and Environmental Sciences, 60438 Frankfurt am Main, Germany. 2CERN, CH-1211 Geneva, Switzerland. 3Department of Physics, University of Helsinki, FI-00014 Helsinki, Finland. 4Helsinki Institute of Physics, University of Helsinki, FI-00014 Helsinki, Finland. 5School of Earth and Environment, University of Leeds, Leeds LS2 9JT, UK. 6Paul Scherrer Institute, Laboratory of Atmospheric Chemistry, CH-5232 Villigen, Switzerland. 7Institute for Ion and Applied Physics, University of Innsbruck, 6020 Innsbruck, Austria. 8Onera—The French Aerospace Lab, F-91123 Palaiseau, France. 9SIM, University of Lisbon, 1849-016 Lisbon, Portugal. 10Ionicon Analytik GmbH, 6020 Innsbruck, Austria. 11Institute for Atmospheric and Climate Science, ETH Zurich, CH-8092 Zurich, Switzerland. 12Division of Chemistry and Chemical Engineering, California Institute of Technology, Pasadena, California 91125, USA. 13WSL Institute for Snow and Avalanche Research SLF, CH-7260 Davos, Switzerland. 14University of Eastern Finland, FI-70211 Kuopio, Finland. 15Finnish Meteorological Institute, FI-00101 Helsinki, Finland. 16Solar and Cosmic Ray Research Laboratory, Lebedev Physical Institute, 119991 Moscow, Russia. 17University of Leeds, National Centre for Earth Observation, Leeds LS2 9JT, UK. 18Department of Applied Environmental Science, University of Stockholm, SE-10961 Stockholm, Sweden. 19Faculty of Physics, University of Vienna, 1090 Vienna, Austria. 20Leibniz Institute for Tropospheric Research, 04318 Leipzig, Germany. 21University of Beira Interior, 6201-001 Covilhã, Portugal. 22Center for Atmospheric Particle Studies, Carnegie Mellon University, Pittsburgh, Pennsylvania 15213, USA. 23Aerodyne Research Inc., Billerica, Massachusetts 01821, USA. †Present addresses: CIRES, University of Colorado Boulder, Boulder, Colorado 80309, USA (C.W.); Arctic Research Center, Korea Polar Research Institute, Incheon 406-840, South Korea (J. Kim); Department of Atmospheric Sciences, University of Washington, Seattle, Washington 98195, USA (S.S.).
OPEN
5 2 2 | N a T U R E | V O L 5 3 3 | 2 6 M a y 2 0 1 6
or different functional groups could be present in the chamber, but undetected by our nitrate chemical ionization set-up.
Before starting measurements, we carefully cleaned the CLOUD chamber (see Methods) and established extremely low contaminant concentrations: at 38% relative humidity and 278 K, the contaminants were below the detection limit for SO2 (<15 p.p.t.v.) and H2SO4 (<5 × 104 cm−3), and total organics (largely comprising high volatility C1–C3 compounds) were below 150 p.p.t.v. Contaminants with a high proton affinity or a high gas-phase acidity can be detected as ions by the APi-TOF operating in positive or negative mode, respectively, even at neutral molecule concentrations as low as 104 cm−3. The APi-TOF measured contaminant C5H5NH+ (protonated pyridine) and contam-inant NO−
3 to be the dominant positive and negative ions, respectively,
before we added any trace gases to the chamber other than water vapour and ozone (Extended Data Fig. 1a, b). Despite its higher gas-phase acidity, we detected contaminant HSO−
4 at only 1% of the NO−3
signal (Extended Data Fig. 1b), ruling out any contribution of sulfuric acid to the nucleation measurements. From previous studies and molecular analysis of the charged clusters (see below), the most abun-dant positive ion is likely to be contaminant ammonium (NH+
4), but its
mass is below the acceptance cut-off of the APi-TOF as operated in this study.
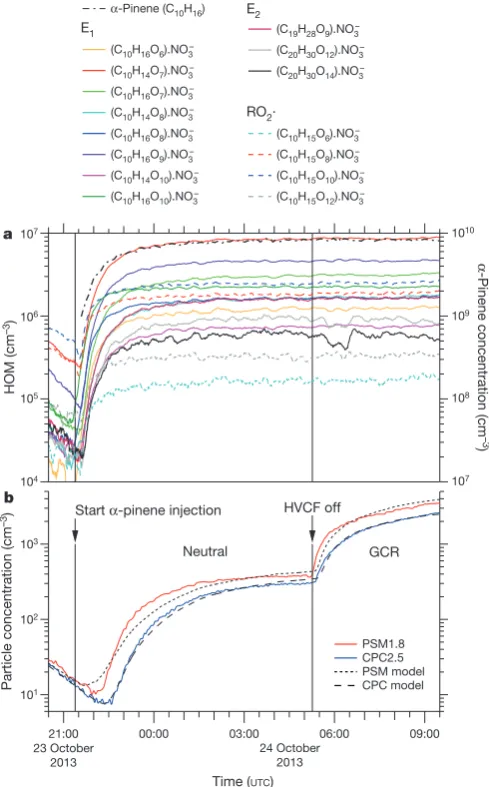
Within a few minutes of the initial exposure of α-pinene to O3 in the chamber, we detected gas-phase HOM monomers and dimers (Fig. 1a). Particles appeared shortly afterwards (Fig. 1b). HOM monomers (denoted E1) broadly comprise highly oxidized C8–10H14,16O6–12 species with an oxygen-to-carbon ratio (O/C) above about 0.6. HOM dimers (E2) are two covalently bound monomers (see below), which generally have lower oxygen-to-carbon ratios, but, almost certainly, a lower volatility. For the present study we define E1 (E2) to be the summed HOM peaks in the mass/charge range m/z = 235–424 Th (425–625 Th), where 1 Th = 1 Da/e and e is the elementary charge. This definition excludes peaks in the E1 mass band distinguished by an odd H number (C10H15O6,8,10,12), which we assign to the RO2· peroxy radical. These m/z values include a contribution of 62 Th due to the NO−
3 ion from
the CI-APi-TOF ionizer. We define the total HOMs as the sum RO2· + E1 + E2.
We measure high HOM molar yields (Extended Data Fig. 2): approx-imately 1.2% per hydroxyl radical (OH·) reaction with α-pinene, 3.2% per ozone reaction with α-pinene, and 2.9% from pure ozonolysis. We find a high E2 yield from ozonolysis (10%–20% of total HOMs), but negligible E2 yield from hydroxyl-initiated oxidation. Neutral trim-ers are close to the detection limit of the CI-APi-TOF (below 0.1% of total HOMs). High yields of these same HOMs have previously been reported6,16, although our ozonolysis yields are less than half those of ref. 16. For our experiments, α-pinene was in the range 0.1–2 parts per billion by volume (p.p.b.v.), with 20–40 p.p.b.v. of O3. The OH· concentrations were (0.5–0.8) × 106 cm−3 during ozonolysis experi-ments, and (0.4–2) × 105 cm−3 during pure hydroxyl experiments with 0.5–3 p.p.b.v. of HONO.
This remarkably fast production of HOMs is likely to proceed via an autoxidation mechanism involving peroxy radicals16,18–20 (Extended Data Fig. 3). There is simply insufficient time for oxidation to proceed in multiple steps through stable intermediate molecules. Here, initial ozonolysis of an α-pinene molecule proceeds via a Criegee intermediate and further steps to form an RO2· radical, followed by several repeated cycles of intramolecular H abstraction and O2 addition to re-form a new RO2· radical. We measure an RO2· fraction of total HOMs between 15% and 1% for HOMs from 0.1 p.p.t.v. to 10 p.p.t.v., respectively. A combination reaction of differently oxidized peroxy radicals explains the rapid high yield of covalently bound E2. The negligible E2 yield from hydroxyl-initiated oxidation could result from additional NOx chemistry that terminates the peroxy radicals before they can combine. Our theoretical calculations further indicate that E2 must be cova-lently bound because the neutral molecular cluster formed from two monomers (denoted E1.E1) is expected to be unstable (see below).
We measured nucleation rates under neutral (Jn), Galactic cos-mic ray (GCR; Jgcr) and π+ beam (Jπ) conditions, corresponding to ion-pair concentrations of around 0 cm−3, 700 cm−3 and 3,000 cm−3, respectively. This range spans atmospheric ion concentrations between ground level and 15-km altitude. The nucleation rate Jn describes the neutral rate alone, whereas Jgcr and Jπ describe the sum of the neutral and ion-induced rates, Jn +Jiin. We determine the nucleation rates at Figure 1 | Evolution of HOMs and particles during a typical run.
a, Evolution of selected HOM monomers (E1), dimers (E2) and peroxy
radicals (RO2·) at 300 p.p.t.v. α-pinene, 33 p.p.b.v. O3, zero H2 or HONO,
38% relative humidity, 278 K and [H2SO4] < 5 × 104 cm−3 (the same run as
shown in Extended Data Fig. 4). The HOMs start to appear soon after the
first injection of α-pinene into the chamber at 21:22, 23 October 2013.
A HOM monomer is a highly oxygenated molecule derived from α-pinene
(C10H16), and a HOM dimer is a covalently bound pair of monomers.
Peroxy radicals are identified by an odd H number. The HOMs are charged
with an NO−
3 ion in the CI-APi-TOF mass spectrometer. The systematic
scale uncertainty on the HOM concentrations is +80%/−45%.
b, Evolution of the particle number concentrations measured in the
PSM1.8 (red curve) and CPC2.5 (blue curve) particle counters. The high-voltage clearing field (HVCF) was switched off at 05:16, 24 October 2013, marking the transition from neutral (ion-free) to GCR conditions in the chamber. A sharp increase in the rate of particle formation is seen, due to ion-induced nucleation of pure biogenic particles. However, no change
occurs in the HOM concentrations (a), because these are predominantly
neutral gas-phase molecules. The dotted and dashed curves in b show the
PSM1.8 and CPC2.5 distributions, respectively, simulated for this run with the AEROCLOUD kinetic model, which is used to derive the experimental nucleation rates (see Methods).
101
102
103
Particle concentration (cm
–3) 1010 107 106 105 104 109 108 107 α
-Pinene concentration (cm
–3 ) HOM (cm –3) 21:00 23 October 2013
00:00 03:00 06:00 09:00
Time (UTC) α-Pinene (C10H16)
E1
(C10H16O6).NO3–
(C10H14O7).NO3–
(C10H16O7).NO3–
(C10H14O8).NO3–
(C10H16O8).NO3–
(C10H16O9).NO3–
(C10H14O10).NO3–
(C10H16O10).NO3–
E2
(C19H28O9).NO3–
(C20H30O12).NO3–
(C20H30O14).NO3–
RO2∙
(C10H15O6).NO3–
(C10H15O8).NO3–
(C10H15O10).NO3–
(C10H15O12).NO3–
Start α-pinene injection HVCF off
Neutral GCR PSM1.8 CPC2.5 PSM model CPC model a b 24 October 2013
2 6 M a y 2 0 1 6 | V O L 5 3 3 | N a T U R E | 5 2 3
1.7-nm mobility diameter, at which size a particle is generally con-sidered to be stable against evaporation. To determine the nucleation rates, we fit the time-dependent particle concentrations with a numer-ical model that treats particle nucleation and growth kinetnumer-ically at the molecular level (an example is shown in Fig. 1b; see Methods for further details).
A typical run sequence (Extended Data Fig. 4) begins by establishing ion-free conditions with a high-voltage clearing field and introducing α-pinene to the chamber, where it mixes with ozone. Particles then start to form and, after measuring Jn at steady-state α-pinene concentration, we turn off the high voltage and measure Jgcr under otherwise identi-cal chamber conditions. A sharp enhancement of particle formation is seen when the high voltage was turned off (Extended Data Fig. 4b, e), due to ion-induced nucleation of both charge signs (Extended Data Figs 4c, d and 5).
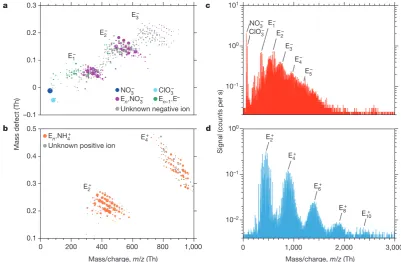
Figure 2 shows the molecular composition and mass spectra of neg-atively and positively charged ions, monomers, dimers and clusters during ion-induced nucleation events. The dominant core ions in the clusters are identified as NH+
4, NO−3 and E−. Here E− is inferred for
negatively charged ions or clusters that contain only C, H and O; the E− ion corresponds to a HOM of high gas-phase acidity. In contrast to negative clusters, the positive clusters nucleate only with dimers, producing distinct mass bands that are detected up to E10 in the APi-TOF (Fig. 2c, d). This indicates the importance of dimers for pure biogenic nucleation. Dimers are expected to be less volatile than mon-omers, owing primarily to higher molecular weight, but also to addi-tional funcaddi-tional groups. Our previously described definition for neutral gas-phase HOMs encompasses compounds with a wide range
of low volatilities19,21, of which only a subset drive nucleation
(ELVOCs, which comprise about 36% of measured total HOMs21).
From the strong ion enhancement of nucleation we conclude that the APi-TOF mass peaks above the dimer in Fig. 2 are clusters of ELVOC monomers and dimers. Although we can precisely determine their molecular composition (CxHyOz), we can only infer their specific structure and functional groups.
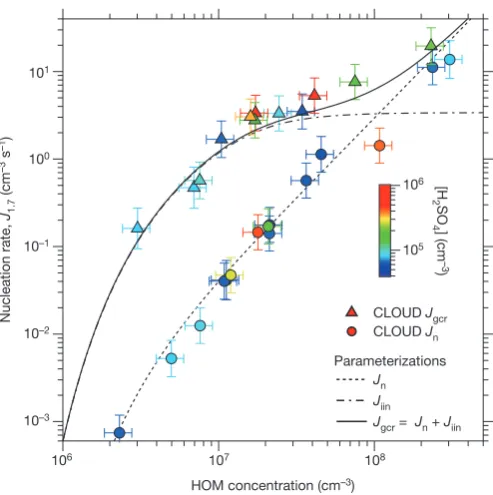
We show the experimental neutral and GCR nucleation rates in Fig. 3 over the total HOMs range 0.1–10 p.p.t.v., which spans the range of atmospheric interest. Below 1 p.p.t.v. HOM, ionization at ground-level GCR intensities enhances the nucleation rate by between one and two orders of magnitude compared with neutral nucleation. At higher concentrations, the neutral and GCR nucleation rates converge because the ion-induced rate, Jiin, reaches the limit set by the GCR total ion production rate (3.4 cm−3 s−1). Positive and negative clusters nucleate at comparable rates (an example is shown in Extended Data Fig. 5). Relative humidity has little effect on Jgcr over the range 6%–80% relative humidity, whereas Jn increases substantially at higher relative humidity (Extended Data Fig. 6).
The large GCR enhancement indicates that biogenic molecular clus-ters are relatively unstable unless an ion is present. A charged cluster is also likely to experience higher collision rates with HOMs because they are expected to have high electric polarizability and, depending on their structure, large dipole moments. We further investigated the depend-ence on ion species by adding small amounts of SO2 to the chamber, up to around 1,000 p.p.t.v. When [H2SO4] exceeds about 1 × 105 cm−3, the major negative ion species shift to HSO−
4, SO−5 and SO−4 (Extended
[image:3.595.97.499.55.317.2]Data Fig. 1c), owing to their lower proton affinity (higher gas-phase Figure 2 | Molecular composition and mass spectra of charged clusters
during GCR nucleation events without sulfuric acid. a, b, Cluster mass
defect (difference from integer mass) versus m/z of negatively (a) and
positively (b) charged clusters measured with the APi-TOF at 240 p.p.t.v.
α-pinene, 34 p.p.b.v. O3, zero H2 or HONO, 38% relative humidity, 278 K
and [H2SO4] below the detection limit (5 × 104 cm−3). The values of
Jgcr and total HOMs concentration are, respectively, 3.4 cm−3 s−1 and
1.7 × 107 cm−3 (a), and 3.3 cm−3 s−1 and 2.4 × 107 cm−3 (b). The mass
bands are labelled according to the number of HOM monomer units
in the cluster, En. Each circle represents a distinct molecular composition
and its area represents the counts per second. The most highly oxidized compounds are located at the lower right-hand edge of each band.
The dark blue circle represents NO−
3 ions; the light blue circle represents
−
ClO3 ions. Clusters with fully identified molecular composition are
coloured according to their core ion: purple (NO−
3), green (E−) or orange
(NH+
4). Grey circles are unidentified clusters. c, d, Mass spectra from the
same events for negative (c) and positive (d) clusters up to m/z= 3,000 Th.
A particle of 1.7-nm mobility diameter has a mass of about 1,200 Th.
The ‘Nessie’ plot (d) shows that positive-ion-induced nucleation involves
HOM dimers alone (E1.NH+4 clusters are not seen owing to instrument
tuning). The decreasing signal amplitude at larger masses is due to the lower concentration and decreasing detection efficiency of the APi-TOF
mass spectrometer (the efficiency versus m/z depends on the instrument
tune and polarity). 10–2 10–1 100
Signal (counts per s)
3,000 2,000 1,000 0 10–1 100 101 d c
E1– E2–
E2+
E4+
E6+
E8+ E10+ E3–
E4– E5– NO3–
ClO3–
0.5
0.4
0.3
0.2
0.1
Mass defect (Th)
1,000 800 600 400 200 0
Mass/charge, m/z (Th) Mass/charge, m/z (Th) 0.3
0.2
0.1
0
–0.1
En·NH4+
Unknown positive ion
b
E2+
E4+
a
E1– E2–
E3–
NO3– ClO 3– En·NO3– E
n–1·E–
Unknown negative ion
5 2 4 | N a T U R E | V O L 5 3 3 | 2 6 M a y 2 0 1 6
acidity) than contaminant compounds. However, the nucleation rates with sulfur ion species remain unchanged (Fig. 3). Taken together, our observations therefore show that ubiquitous ion species can stabilize embryonic biogenic clusters. However, we do not observe chlorine in nucleating clusters, even though contaminant chlorine ion species are present (Fig. 2 and Extended Data Fig. 1), which indicates that not all ions have a suitable chemical structure to bond strongly with the oxidized organic compounds22.
Figure 4 shows the CLOUD biogenic nucleation rates extended to [H2SO4] = 6 × 106 cm−3 and compared with atmospheric boundary- layer observations3,4,23,24. Biogenic nucleation rates show no signifi-cant dependence on sulfuric acid concentration over this range (that is, within the experimental measurement errors, the nucleation rate is consistent with zero dependency on sulfuric acid concentration). This finding sharply contrasts with base-stabilized nucleation of sul-furic acid in the presence of ammonia9 or amines10, where nucleation rates at 1.7 nm show a steep dependency on [H2SO4] above 106 cm−3. Comparison of the atmospheric observations (Fig. 4) with our meas-urements therefore suggests that nucleation in the lower atmosphere may involve a mixture of two distinct mechanisms. The first, which is more important in polluted environments, involves nucleation of sulfuric acid and water together with a combination of amines or ammonia with oxidized organics, and has a strong dependence on sulfuric acid. The second, which is more important in pristine envi-ronments, involves nucleation of pure organic particles and depends on only oxidized organics and ions.
To gain further insight into the stability of initial neutral and charged clusters of highly oxidized biogenic molecules, we calculated their Gibbs free energies of formation, ΔG, using quantum chemical meth-ods (see Methmeth-ods). For this study we chose C10H14O7 and C20H30O14 as E1 and E2 surrogates, respectively (Extended Data Fig. 7). We observe these compounds both in the gas (Fig. 1) and particle phases in the CLOUD chamber. We show proposed formation mechanisms and structures19,20 in Extended Data Fig. 3. Our calculations, summarized in Extended Data Table 1 and Extended Data Fig. 8, confirm that
ELVOC clusters formed with an E−
1, HSO−4, NO−3 or NH+4 ion are
expected to be stable (that is, their growth rate exceeds the evaporation rate) at around 0.1 p.p.t.v. ELVOC, or below. In contrast, the initial neu-tral clusters are weakly bound and so neuneu-tral nucleation is expected to be weaker. Although limited to a single surrogate pair, our theoretical calculations thus provide independent support for the experimental measurements.
Comparisons with atmospheric observations should be considered as preliminary because our measurements were made at only one temper-ature, with a single monoterpene, in the absence of isoprene and mostly in the absence of NOx, which can influence HOM yields. Nevertheless, our results may provide fresh insights into several seemingly disparate
101 100 10–1 10–2 10–3 Nucleation rate,
J1.7
(c
m
–3 s –1)
106 107 108
HOM concentration (cm–3)
105 106 [H
2SO
4] (cm
–3
)
CLOUD Jgcr
CLOUD Jn
Parameterizations
Jn Jiin
Jgcr = Jn + Jiin
Figure 3 | Pure biogenic nucleation rates versus HOM concentration.
Neutral (Jn; circles) and GCR (Jgcr; triangles) nucleation rates versus
total HOMs concentration (RO2· + E1+ E2). The fraction of total HOMs
that participate in nucleation (ELVOCs) is about 36% (ref. 21). The
experimental conditions are 10–1,300 p.p.t.v. α-pinene (for measurements
below J1.7= 10 cm−3 s−1), 30–35 p.p.b.v. O3, zero H2 or HONO, 38%
relative humidity, 278 K and <8 × 105 cm−3 H2SO4. The colour scale shows
[H2SO4]; purple and blue points correspond to contaminant level (below
the detection threshold); other colours correspond to measurements after
SO2 was added to the chamber. The fitted curves show parameterizations
(described in Methods) for Jn (dashed), Jgcr (solid) and ion-induced
nucleation (Jiin=Jgcr−Jn; dot-dashed). The Jiin parameterization assumes
that the nucleation rate falls steeply at HOM concentrations below the
experimental measurements, following a similar slope to that for Jn.
The bars indicate 1σ total errors, although the overall systematic scale
uncertainty of +80%/−45% on the HOM concentration is not shown.
103
102
104 105 106 107 108
100 10–1 101 10–2 10–3 Nucleation rate,
J1.7
(c
m
–3 s –1)
Sulfuric acid concentration (cm–3) 106 107 108 [H
OM] (c
m
–3
)
CLOUD JS
CLOUD Jgcr
CLOUD Jn
Atmospheric observations Ground-level GCR ion production limit J1.7 J3 Sulfuric acid kinetic limit
Figure 4 | Experimental and atmospheric nucleation rates versus H2SO4 concentration. CLOUD measurements of the neutral (Jn; circles), GCR
(Jgcr; triangles) and π beam (Jπ; diamonds) biogenic nucleation rates at
1.7 nm (J1.7) versus [H2SO4]. The CLOUD experimental conditions are
10–1,300 p.p.t.v. α-pinene (for measurements below J1.7= 10 cm−3 s−1),
25–35 p.p.b.v. O3, zero H2 or HONO, 20%–40% relative humidity and
278 K. Measurements below 1 × 105 cm−3 for [H2SO4] are near to the
detection limit of the CI-APi-TOF and should be considered as
upper-estimates (to avoid overlap, some data points at the H2SO4 detection
limit are displaced by up to 1 × 104 cm−3). The total HOMs concentration
from α-pinene oxidation is indicated by the colour scale. Observations
of particle formation in the atmospheric boundary layer (mainly at
3-nm threshold size) are indicated by small grey circles3,4,23,24. Following
convention, the H2SO4 concentration refers to monomers alone; that is,
H2SO4 bound in molecular clusters is not included. The kinetic upper limit
on sulfuric acid nucleation is indicated by the blue band, which is bounded
by dashed lines indicating J1.7 and J3. This band assumes the CLOUD
condensation sink, which is comparable to that of a pristine atmosphere.
The upper limit on Jiin from the GCR ion-pair production rate at ground
level is indicated by the dot-dashed line. The bars indicate 1σ total errors,
although the overall +50%/−33% systematic scale uncertainty on [H2SO4]
is not shown.
2 6 M a y 2 0 1 6 | V O L 5 3 3 | N a T U R E | 5 2 5
phenomena associated with low atmospheric concentrations of sulfu-ric acid. First, pure HOM nucleation could provide a mechanism to account for nucleation-mode particles observed at night-time, under low-[H2SO4] conditions25,26. Second, although observations are rare, nucleation-mode particles are seen in the Amazon27, where SO2 levels are extremely low (20–30 p.p.t.v.). Peak particle concentrations often occur at sunrise and sunset27, and appear to be associated with rain, which reduces the aerosol condensation sink and may generate high ion concentrations by evaporation of charged droplets at the Rayleigh limit. Third, pure biogenic nucleation could explain new particle for-mation observed in the upper troposphere in cloud outflows depleted of SO2, such as over the Amazon27–29. Low-solubility biogenic precursor vapours can be efficiently convected inside clouds to high altitudes where HOMs will form in the cloud outflows on exposure to oxidants, and nucleation is likely to be enhanced by the low temperatures. Fourth, since high HOM yields are also found from other organic compounds with an endocyclic double bond such as cyclohexene16, pure HOM nucleation involving anthropogenic organic precursors could be expected when [H2SO4] is low30. Finally, ion-induced pure biogenic nucleation might shed new light on the long-standing question of a physical mechanism for solar-climate variability in the pristine pre-industrial climate31,32.
Direct observational evidence of pure biogenic nucleation has not been reported so far, owing to atmospheric pollution or lack of suitable instrumentation. The pure biogenic mechanism is likely to dominate nucleation in pristine terrestrial regions such as tropical rainforests or at higher altitudes above forests in convective cloud outflows. Pure bio-genic nucleation might also take place over forested areas at high north-ern latitudes during periods of especially low pollution. Identification of pure biogenic nucleation in the atmosphere will require simultane-ous measurements with several newly developed mass spectrometers, APi-TOF (for molecular composition of ions and nucleating charged clusters) and CI-APi-TOF (gas-phase HOMs and H2SO4), together with standard instruments such as low-threshold particle counters, PTR-TOF (precursor organic vapours) and NAIS (size spectra of ions and charged particles).
In summary, we find that highly oxidized organic compounds play a role in atmospheric particle nucleation comparable to that of sulfuric acid; together with a suitable stabilizing agent, each has sufficiently low volatility to form new particles in the lower atmosphere at vapour concentrations near 107 cm−3. The stabilizing agent for pure biogenic particles is a suitable ion, whereas for sulfuric acid particles the stabiliz-ing agents are amines, or ammonia with oxidized organics. Ion-induced nucleation of pure biogenic particles may have important consequences for pristine climates because it provides a mechanism by which nature produces particles without pollution. This could raise the baseline aerosol state of the pristine pre-industrial atmosphere and so could reduce the estimated anthropogenic radiative forcing from increased aerosol-cloud albedo over the industrial period.
Online Content Methods, along with any additional Extended Data display items and Source Data, are available in the online version of the paper; references unique to these sections appear only in the online paper.
received 6 July 2015; accepted 16 March 2016.
1. Boucher, O. et al. in Climate Change 2013: The Physical Science Basis. Working Group I Contribution to the Fifth Assessment Report of the Intergovernmental Panel on Climate Change (eds Stocker, T. F. et al.) 571–658 (Cambridge Univ. Press, 2013).
2. Merikanto, J., Spracklen, D. V., Mann, G. W., Pickering, S. J. & Carslaw, K. S.
Impact of nucleation on global CCN. Atmos. Chem. Phys. 9, 8601–8616
(2009).
3. Kuang, C., McMurry, P. H., McCormick, A. V. & Eisele, F. L. Dependence of nucleation rates on sulfuric acid vapor concentration in diverse atmospheric
locations. J. Geophys. Res. Atmos. 113, D10209 (2008).
4. Kulmala, M. et al. Direct observations of atmospheric aerosol nucleation. Science 339, 943–946 (2013).
5. Hirsikko, A. et al. Atmospheric ions and nucleation: a review of observations. Atmos. Chem. Phys. 11, 767–798 (2011).
6. Zhao, J., Ortega, J., Chen, M., McMurry, P. H. & Smith, J. N. Dependence of particle nucleation and growth on high-molecular-weight gas-phase
products during ozonolysis of α-pinene. Atmos. Chem. Phys. 13, 7631–7644
(2013).
7. Gao, S. et al. Low-molecular-weight and oligomeric components in secondary
organic aerosol from the ozonolysis of cycloalkenes and α-pinene. J. Phys.
Chem. A 108, 10147–10164 (2004).
8. O’Dowd, C. D. et al. Marine aerosol formation from biogenic iodine emissions. Nature 417, 632–636 (2002).
9. Kirkby, J. et al. Role of sulphuric acid, ammonia and galactic cosmic rays in
atmospheric aerosol nucleation. Nature 476, 429–433 (2011).
10. Almeida, J. et al. Molecular understanding of sulphuric acid–amine particle
nucleation in the atmosphere. Nature 502, 359–363 (2013).
11. Riipinen, I. et al. Organic condensation: a vital link connecting aerosol formation to cloud condensation nuclei (CCN) concentrations. Atmos. Chem. Phys. 11, 3865–3878 (2011).
12. Zhang, R. et al. Atmospheric new particle formation enhanced by organic
acids. Science 304, 1487–1490 (2004).
13. Metzger, A. et al. Evidence for the role of organics in aerosol particle formation
under atmospheric conditions. Proc. Natl Acad. Sci. USA 107, 6646–6651
(2010).
14. Schobesberger, S. et al. Molecular understanding of atmospheric particle formation from sulfuric acid and large oxidized organic molecules. Proc. Natl Acad. Sci. USA 110, 17223–17228 (2013).
15. Riccobono, F. et al. Oxidation products of biogenic emissions contribute to
nucleation of atmospheric particles. Science 344, 717–721 (2014).
16. Ehn, M. et al. A large source of low-volatility secondary organic aerosol. Nature
506, 476–479 (2014).
17. Guenther, A. B. et al. The Model of Emissions of Gases and Aerosols from Nature version 2.1 (MEGAN2.1): an extended and updated framework for
modeling biogenic emissions. Geosci. Model Dev. 5, 1471–1492 (2012).
18. Crounse, J. D., Nielsen, L. B., Jørgensen, S., Kjaergaard, H. G. & Wennberg, P. O.
Autoxidation of organic compounds in the atmosphere. J. Phys. Chem. Lett. 4,
3513–3520 (2013).
19. Zhang, X. et al. Formation and evolution of molecular products in α-pinene
secondary organic aerosol. Proc. Natl Acad. Sci. USA 112, 14168–14173
(2015).
20. Kurtén, T. et al. Computational study of hydrogen shifts and ring-opening
mechanisms in α-pinene ozonolysis products. J. Phys. Chem. A 119,
11366–11375 (2015).
21. Tröstl, J. et al. The role of low-volatility organic compounds in initial particle
growth in the atmosphere. Nature 533, http://dx.doi.org/10.1038/
nature18271 (2016).
22. Kathmann, S. M., Schenter, G. K. & Garrett, B. C. Ion-induced nucleation:
the importance of chemistry. Phys. Rev. Lett. 94, 116104 (2005).
23. Paasonen, P. et al. On the roles of sulphuric acid and low-volatility organic vapours in the initial steps of atmospheric new particle formation. Atmos. Chem. Phys. 10, 11223–11242 (2010).
24. Sihto, S.-L. et al. Atmospheric sulphuric acid and aerosol formation: implications from atmospheric measurements for nucleation and early
growth mechanisms. Atmos. Chem. Phys. 6, 4079–4091 (2006).
25. Suni, T. et al. Formation and characteristics of ions and charged aerosol
particles in a native Australian eucalyptus forest. Atmos. Chem. Phys. 8,
129–139 (2008).
26. Lee, S.-H. et al. Observations of nighttime new particle formation in the
troposphere. J. Geophys. Res. Atmos. 113, D10210 (2008).
27. Martin, S. T. et al. Sources and properties of Amazonian aerosol particles. Rev. Geophys. 48, RG2002 (2010).
28. Kulmala, M. et al. Deep convective clouds as aerosol production engines:
role of insoluble organics. J. Geophys. Res. Atmos. 111, D17202 (2006).
29. Ekman, A. M. L. et al. Do organics contribute to small particle formation in the
Amazonian upper troposphere? Geophys. Res. Lett. 35, L17810 (2008).
30. Bianchi, F. et al. New particle formation in the free troposphere: a question of
chemistry and timing. Science 352, http://dx.doi.org/10.1126/science.
aad5456 (2016).
31. Herschel, W. Observations tending to investigate the nature of the Sun, in order to find the causes or symptoms of its variable emission of light and heat; with remarks on the use that may possibly be drawn from solar observations. Philos. Trans. R. Soc. Lond. 91, 265–318 (1801).
32. Kirkby, J. Cosmic rays and climate. Surv. Geophys. 28, 333–375 (2007).
Acknowledgements We thank CERN for supporting CLOUD with important technical and financial resources, and for providing a particle beam from the CERN Proton Synchrotron. We also thank P. Carrie, L.-P. De Menezes, J. Dumollard, F. Josa, I. Krasin, R. Kristic, A. Laassiri, O. S. Maksumov, B. Marichy, H. Martinati, S. V. Mizin, R. Sitals, A. Wasem and M. Wilhelmsson for their contributions to the experiment. We thank the CSC Centre for Scientific Computing in Espoo, Finland for computer time. This research has received funding from the EC Seventh Framework Programme (Marie Curie Initial Training Network MC-ITN CLOUD-TRAIN no. 316662, EU Horizon 2020 Marie Curie grant no. 656994, ERC-Consolidator grant NANODYNAMITE no. 616075 and ERC-Advanced grant ATMNUCLE no. 227463), the German Federal Ministry of Education and Research (project no. 01LK1222A), the Swiss National Science Foundation (project nos 200020_135307, 200021_140663, 206021_144947/1 and 20FI20_149002/1), the Academy of Finland (Center of Excellence project no. 1118615), the Academy of Finland (135054, 133872,
5 2 6 | N a T U R E | V O L 5 3 3 | 2 6 M a y 2 0 1 6
251427, 139656, 139995, 137749, 141217, 141451), the Finnish Funding Agency for Technology and Innovation, the Väisälä Foundation, the Nessling Foundation, the Austrian Science Fund (FWF; project no. L593), the Portuguese Foundation for Science and Technology (project no. CERN/FP/116387/2010), the Swedish Research Council, Vetenskapsrådet (grant 2011-5120), the Presidium of the Russian Academy of Sciences and Russian Foundation for Basic Research (grant 12-02-91522-CERN), the UK Natural Environment Research Council (grant NE/K015966/1), the Royal Society (Wolfson Merit Award), the US National Science Foundation (grants AGS1136479, AGS1447056 and CHE1012293), Caltech ESE Grant (Davidow Foundation), Dreyfus Award EP-11-117, the French National Research Agency (ANR), the Nord-Pas de Calais, and the European Funds for Regional Economic Development (FEDER, Labex-Cappa, ANR-11-LABX-0005-01).
Author Contributions J.A., H.G., A.K., T.N., J.T. and C.W. analysed the nucleation rates; C.Fr. analysed the APi-TOF charged clusters; M.H., M.Sim. and C.Y.
performed the CI-APi-TOF HOM and H2SO4 analyses; A.-K.B. analysed the
PTR-TOF α-pinene; J.H.S. and X.Z. analysed the ELVOC structures and formation
mechanisms; I.K.O. performed the quantum chemical calculations; A.Ad., J.A., A.Am., A.-K.B., F.B., M.B., S.B., J.Cu., J.Cr., A.D., J.Do., J.Du., S.E., C.Fr., C.Fu., H.G., M.H., C.R.H., T.J., H.J., J.Ka., J. Kim, J.Kir., M.Kr., A.K., K.L., V.M., U.M., T.N., F.P., T.P., A.P.P., M.P.R., N.S., K.S., M.Sim., M.Sip., G.S., A.T., J.T., A.W., D.W., R.W., C.W.,
C.Y. and P.Y. collected the data and contributed to the analysis; K.S.C., H.G., K.P., A.R., N.A.D.R., K.S. and C.E.S. evaluated the atmospheric relevance; J.Kir. wrote the manuscript; J.A., J.Do., N.M.D., C.Fr., H.G., M.H., J.H.S., M.Sim., C.W., R.W., C.Y. and X.Z. contributed to Methods and Extended Data; and U.B., K.S.C., J.Cu., J.Do., N.M.D., R.C.F., A.H., J.Kir., M.Ku., J.H.S. and D.R.W. contributed to data interpretation and editing of manuscript. All authors contributed to the development of the CLOUD facility and analysis instruments, and commented on the manuscript.
Author Information Reprints and permissions information is available at www.nature.com/reprints. The authors declare no competing financial interests. Readers are welcome to comment on the online version of the paper. Correspondence and requests for materials should be addressed to J.Kir. (jasper.kirkby@cern.ch).
This work is licensed under a Creative Commons Attribution 4.0 International (CC BY 4.0) licence. The images or other third party material in this article are included in the article’s Creative Commons licence, unless indicated otherwise in the credit line; if the material is not included under the Creative Commons licence, users will need to obtain permission from the licence holder to reproduce the material. To view a copy of this licence, visit http://creativecommons.org/licenses/by/4.0/.
MEthOds
Overview of the CLOUD facility. The CLOUD experiment at CERN is designed to study the effects of cosmic rays on aerosols, cloud droplets and ice particles, under precisely controlled laboratory conditions. The 3-m-diameter stainless-steel CLOUD chamber and its gas system have been built to the highest technical standards of cleanliness and performance. The CLOUD chamber is periodically cleaned by rinsing the walls with ultra-pure water, followed by heating to 373 K and flushing at a high rate with humidified synthetic air and elevated ozone (several parts per million by volume). Contaminant levels of condensable vapours are in the sub-p.p.t.v. range. The high cleanliness of the chamber, together with
its large volume (26.1 m3) and highly stable operating conditions, allows particle
formation to be studied under atmospheric conditions at nucleation rates between
about 0.001 cm−3 s−1 and 100 cm−3 s−1. The loss rate of condensable vapours and
particles onto the chamber walls is comparable to the ambient condensation sink of the pristine boundary layer.
Ion production in the chamber can be controlled using an internal electric
clearing field (which creates an ion-free environment), GCRs or an adjustable π+
beam9,33 from the CERN Proton Synchrotron. The π+ beam is de-focused to a
transverse size of about 1.5 m × 1.5 m when it passes through the CLOUD chamber.
With the electric field set to zero, the equilibrium ion-pair concentration in the
chamber due to GCRs is around 700 cm−3. With the π+ beam, this can be increased
to any value up to about 3,000 cm−3. Hence, ion concentrations corresponding to
any altitude in the troposphere can be generated in the CLOUD chamber. The experiment has precise control of the trace vapours inside the chamber and also of the environmental temperature between 300 K and 203 K. Uniform mixing is achieved with magnetically coupled stainless-steel fans mounted at the top and bottom of the chamber. The characteristic gas mixing time in the cham-ber is a few minutes, depending on the fan speeds. Photochemical processes are initiated by illumination with an ultraviolet fibre-optic system, providing highly stable gas-phase reactions with a precise start time. The contents of the chamber are continuously analysed by instruments connected to sampling probes that pro-ject into the chamber. The sampling analysers are tailored for each experimen-tal campaign, but typically comprise around 30–35 instruments, of which up to 10 are mass spectrometers.
Summary of analysing instruments. For the results reported here, the analysing instruments attached to the chamber included a chemical ionization mass
spec-trometer (CIMS) for H2SO4 concentration34; an atmospheric pressure interface
time-of-flight (APi-TOF; Aerodyne Research Inc. and Tofwerk AG)35 mass
spec-trometer for molecular composition of positively or negatively charged ions and clusters; two chemical ionization atmospheric pressure interface time-of-flight
(CI-APi-TOF; Aerodyne Research Inc. and Tofwerk AG)36,37 mass spectrometers
for molecular composition and concentration of neutral gas-phase H2SO4 and
HOMs; a proton transfer reaction time-of-flight (PTR-TOF; Ionicon Analytik
GmbH)38 mass spectrometer for organic vapours; a neutral cluster and air ion
spectrometer (NAIS; Airel Ltd)39 for concentrations of positive ions, negative ions
and charged clusters in the range 1–40 nm; a nano-radial differential mobility
analyser (nRDMA)40 and a nano scanning mobility particle sizer (nano-SMPS)
for particle size spectra; and several condensation particle counters (CPCs) with 50% detection efficiency thresholds between 1 nm and 4 nm: two Airmodus A09
particle size magnifiers, PSM41, (one fixed-threshold and the other scanning), two
diethylene glycol CPCs, DEG-CPC42,43, a butanol TSI 3776 CPC and a water TSI
3786 CPC (TSI Inc.).
Additional gas analysers included dew-point sensors (EdgeTech), sulfur diox-ide (Thermo Fisher Scientific, Inc. 42i-TLE) and ozone (Thermo Environmental Instruments TEI 49C). For certain tests, HONO vapour was supplied to the
cham-ber and photolysed with ultraviolet light to produce OH· in the absence of O3.
The gaseous HONO was generated by continual mixing of H2SO4 with NaNO2
(ref. 44) in a specially designed stainless-steel reactor, and then steadily flowed into the chamber. The HONO analyser involved a specially designed probe that
passed samples of air from the chamber through a solution of H2SO4 and
sulfan-ilamide, which was then analysed online with a long path absorption photometer
(LOPAP)45.
Determination of the nucleation and growth rates. The nucleation rates (in
cm–3 s–1) were measured under neutral (Jn), ground-level GCR (Jgcr) and π+ beam
(Jπ) conditions. Neutral nucleation rates are measured with the clearing field
electrodes set to ±30 kV, which establishes an electric field of about 20 kV m−1 in
the chamber. This completely suppresses ion-induced nucleation because, under these conditions, small ions or molecular clusters are swept from the chamber in about 1 s. Because all of the nucleation and growth processes under considera-tion take place on substantially longer timescales, neutral nucleaconsidera-tion rates can be
measured with zero background from ion-induced nucleation. For GCR and π+
beam conditions, the electric field was set to zero, leading to equilibrium ion-pair
concentrations around 700 cm−3 and 3,000 cm−3, respectively. The nucleation rate
Jn measures the neutral rate alone, whereas Jgcr and Jπ measure the sum of the
neutral and ion-induced nucleation rates, Jn+Jiin.
The nucleation rates reported here were obtained primarily with the Airmodus scanning PSM at 1.8-nm threshold (PSM1.8) and the TSI 3776 CPC (CPC2.5),
nominally 2.5-nm threshold, but measured at 3.2-nm threshold with WOx
particles46. The nucleation rates J1.7 are determined at 1.7-nm mobility diameter
(1.4-nm mass diameter), at which size a particle is normally considered to be above its critical size and, therefore, thermodynamically stable. The critical size corres-ponds to the cluster size at which the evaporation and growth rates are equal. It varies with temperature, chemical species, charge and vapour concentrations, and may even be absent when evaporation rates are highly suppressed, such as for
sulfuric acid–dimethylamine clusters10,37. Our measurements indicate that the
smallest neutral HOM clusters are relatively unstable; therefore, 1.7 nm, which is equivalent to around 5 HOM monomer units, is a reasonable size at which to derive the experimental nucleation rates.
AEROCLOUD model. To determine nucleation rates at 1.7 nm, the time-dependent particle concentrations measured with the PSM1.8 and CPC2.5 are fitted with a simplified numerical model (AEROCLOUD) that treats particle nucleation and growth kinetically at the molecular level. The model uses HOM monomer, HOM
dimer and H2SO4 production rates derived from the CI-APi-TOF experimental
data. The measured HOM production rates are scaled by a factor of 1.8 to match the observed particle appearance times and growth rates. This scaling results in good agreement of the model with the experimental data over the full experimental range of HOM concentrations. The scaling factor is within the systematic meas-urement uncertainty of the CI-APi-TOF, and could arise if a nitrate CI-APi-TOF does not detect all the HOMs that contribute to particle growth.
Primary ions from GCRs are generated in the model at the known rate of q= 1.7
ion pairs per cubic centimetre per second. A fixed parameter of the model, fc,
accounts for the charge sign asymmetry due to differences in the diffusional loss rates of positive and negative primary ions to the chamber walls:
= ( ) = ( − )( ) +
−
q f q
q f q
2
1 2
c c
The parameter fc is determined by the experimentally measured positive and
negative ion concentrations in the NAIS to have the value 0.52.
Molecules and particles collide kinetically, and cluster with each other. The model uses a reduced clustering probability (termed a ‘sticking probability’ below) to account for unstable small clusters, rather than allowing clusters to evaporate once they have formed. This greatly increases the speed of the computation. If the particle formed by a collision exceeds a certain size (corresponding to around 1.7-nm mobility diameter for pure biogenic clusters; see below), then it is assumed to be effectively stable and subsequently grows at near the kinetic limit. The particle growth rate between the PSM1.8 and CPC2.5 is therefore implicitly treated in the model essentially as kinetically limited growth by particle coagulation plus
HOM and H2SO4 vapour condensation. Particles grow through size bins that are
linearly spaced for small sizes and logarithmically spaced from about 2 nm to a maximum size of 400 nm. The time-steps for clustering processes range from 0.9 s to 10 s, depending on the conditions of the experimental run under analysis. The time-step is 10 s for all other processes (for example, updates of gas concentrations, high-voltage clearing-field changes, fan changes, and particle losses due to dilution of the chamber contents or diffusion to the walls). The density of the pure HOM
clusters is fixed at 1.3 g cm−3, and at 1.85 g cm−3 for a pure H
2SO4 cluster.
For neutral–neutral collisions, the number of particles in size bins 1 and 2 that
coagulate in a time interval Δt to produce a particle of mass m12 is:
= ′ ∆ ( )
n12 K S n n V00 00 1 2 12 t 1
where K00 is the neutral–neutral collision kernel, n1, n2 and n12 are the particle
number concentrations, and V12 is the van der Waals enhancement factor (see
below). The neutral–neutral sticking probability for pure biogenic particles, ′
S00,B, is:
′ = − . ( / )
S00,B exp[ 0 693C mB 12SB]
where CB and SB are free parameters. The parameter CB effectively defines the
threshold mass of stable clusters because the sticking probability S′00,B= .0 5 when
CB=m12, whereas the parameter SB controls the sharpness of the threshold. The
sticking probability for collisions where at least one particle is mainly sulfuric acid is similarly defined as:
′ = − . ( / )
S00,A exp[ 0 693C mA 12 SA]
where CA and SA are free parameters.
The neutral–neutral collision kernel, K00, in equation (1) is the Fuchs form of the
Brownian coagulation coefficient47,48. The van der Waals enhancement factor is the
modification to Fuchs theory due to Sceats49, as described in ref. 50, for a Knudsen
number in the kinetic (free molecular) regime. The enhancement factor is:
= + ′/
+ ′ + ( + ′) + ( + ′)
V A
b A b A b A
1 3
1 ln 1 ln 1
12
0 1 2
3
where the reduced Hamaker constant, A′, is:
′ =
( + )
A A
kT r r r11 2r22
where r1,2 are the particle radii, A= 6.4 × 10⁻²⁰ J (the Hamaker constant for sulfuric
acid50), b0= 0.0151, b1=−0.186, b2=−0.0163, k is the Boltzmann constant and
T is temperature. The same Hamaker constant is used for both sulfuric acid and
HOMs because it does not noticeably change the model predictions.
Ions and charged clusters collide according to a similar expression as equation (1):
= ( × ) ′ ∆ ( )
n12 E K S n n t00 1 2 2
where E is an enhancement factor to obtain the charged collision kernels (described
below). The sticking probability for collisions between a neutral particle and a
charged particle, S′0 0+ −, is:
′+ −= − . ( / ) + −
S0 ,0 exp[ 0 693C m12S0 ,0 ]
where S0 ,0+ − is a free parameter and C=CB or CA for biogenic or acid particles,
respectively. Ion–ion recombination results in a neutral particle, which may evap-orate at small sizes. The model allows partial evaporation of such recombination particles; in this case the cluster divides into monomers and the mass is conserved.
The probability of cluster survival after ion–ion recombination, S′+−, is:
′+−= − . ( +−/ )+−
S exp[ 0 693C m12 S ]
where C+− is a free parameter. A power of unity (S+−= 1) is used because the data
do not constrain this parameter well.
To obtain the charged collision kernels, the neutral–neutral collision kernel is
multiplied by size-dependent enhancement factors, E:
′ = / = / = / + − + − ++ −− ++ −− +− +−
E K K
E K K
E K K
0 ,0 0 ,0 00 , , 00
00
where K are the collision kernels and the subscripts refer to the charge of the
col-liding particles. The charged collision kernels in equation (2) are obtained from ref. 51, which refers to sulfuric acid particles. Because biogenic particles may have different neutral–charged collision kernels, their enhancement factor is left free in the fit:
= ′ − + ( )
+ − + −
+ −
E E
f 1 1 3
0 ,0 0 ,0 0 ,0
where f0+,0− is a free parameter.
Ions, monomers, clusters and larger particles are continually lost by diffusion to the walls and by dilution of the chamber contents with fresh gas mixture. The
dilution lifetime is near 3 h (10−4 s−1), depending on the total sampling rate of
all instruments attached to the chamber. The wall loss rate is 1.8 × 10⁻³ s−1 for
H2SO4 monomers, and decreases with increasing cluster or molecule diameter as
1/d. The same scaling law is used to obtain the wall loss rate for HOMs; that is, it is
assumed that HOMs and particles that collide with the walls are irreversibly lost. For experimental runs for which there is a pre-existing population of particles in the chamber at the start of a run due to incomplete cleaning of the chamber, losses to this coagulation sink are accounted for by inserting the initial size distribution into the size bins of the model.
To determine the nucleation rates, the five free parameters of the model (SB, SA,
S0+,0−, f0+,0− and C+−) are fitted to the experimental particle concentrations in the
PSM1.8 and CPC2.5 versus time. For example, for neutral pure biogenic runs, only
one free parameter (SB) is involved in the fit. The value of SB ranges from 12 to 14,
SA from 4 to 6, S0+,0− from 0.1 to 1.0, f0+,0− is near 4 and C+− is near 10,000 Th.
The parameters CB, CA, S+− and fc were determined by a global fit to all runs in the
dataset and then subsequently fixed at these values. The fitted threshold masses
for CB and CA are around 1,300 Th and 700 Th, respectively. The parameter S+−
is set to 1.0 and fc is set to 0.52. The time development of the particle number
concentrations in both counters throughout all of the nucleation events in our dataset is well reproduced by the model (an example is shown in Extended Data Fig. 4b).
After fitting the data with the model, the nucleation rate J1.7 is determined as
the number of particles that grow to a mobility diameter of 1.7 nm or larger in any time-step, divided by the time increment. In each nucleation run at fixed
conditions, the time tmax is determined at which J1.7 is maximum; the value of
J1.7 for that run is then calculated as the mean measurement over the interval
(tmax± 300 s).
There are three major advantages of using a data-driven kinetic model to deter-mine nucleation rates rather than making direct measurements with the PSM1.8 or CPC2.5 data. First, it avoids the need for time derivatives of the data, which are subject to large errors at low counting rates. Second, particle growth rates are determined by kinetics and properly account for growth due to collisions both with monomers and with other particles. The model treatment of the data there-fore avoids the exponential sensitivity on experimental growth rates that occurs
with other methods52–55. Experimental growth rates are determined from particle
counter rise times and have relatively large uncertainties in the 1–3-nm size range. Finally, the model requires consistency between the PSM1.8 and CPC2.5 so the formation rates are experimentally constrained both near the 1.7-nm threshold size and near 3 nm.
Verification of the model nucleation rates. We performed extensive cross-checks of the nucleation rates obtained with the model by calculating the nucleation rates independently in two additional ways: (1) direct measurements at 1.8 nm using the scanning PSM and (2) CPC2.5 measurements that are stepwise-corrected to 1.7-nm threshold size. Within their experimental uncertainties, the nucleation rates obtained by both these methods agree well with the values obtained with the AEROCLOUD kinetic model.
The stepwise-corrected method is described in detail in ref. 55, but a brief sum-mary is provided here. The nucleation rates are derived from the rate of change of
the formation rates, dNCPC/dt, where NCPC is the particle number concentration
measured with the CPC2.5 above its detection threshold, dth. The formation rate
is corrected in two sequential steps for particle losses to chamber walls, dilution
and coagulation: (1) particle losses above dth and (2) particle losses during growth
from 1.7 nm to dth. The dilution and wall loss rates are the same as in the kinetic
model. To calculate the coagulation rate, the particles are divided into size bins
and then the loss rate in each bin i is computed by summing the size-dependent
collision (coagulation-loss) rate of the particles in bin i with those in all other bins.
The total coagulation loss rate is then the sum of the particle loss rates in each bin i.
Correcting for particle losses during growth from 1.7 nm to dth (item (2) above)
requires knowledge of the particle growth rate. This is experimentally determined with several instruments, for example, from the appearance times measured in
the scanning PSM56, which detects particles over a range of threshold diameters
between 1 nm and 2.5 nm. The growth rates were also measured over different size ranges with several other instruments, including a fixed-threshold PSM, two DEG-CPCs, a TSI 3776 CPC, an APi-TOF, an NAIS, an nRDMA and a nano-SMPS. The experimental growth rates are parameterized because they cannot be measured sufficiently precisely at each point in time during all events. To determine the
nucleation rate at 1.7 nm from the corrected formation rate at dth, the size interval
is divided into m log-normally spaced bins, dlog(Dp), chosen to match the
spac-ing of the SMPS bins at larger sizes. The residence time of a particle in each bin
is δt=δdi/(growth rate), where δdi is the size of bin i. Starting with the measured
particle distribution above dth, the size distribution and formation rate is then
extended towards 1.7 nm in a stepwise process. In the first step, using the known loss rates due to the chamber walls, dilution and coagulation, as well as the time
δt, the concentration in the largest new bin is calculated, as well as the formation
rate into this bin. Using this concentration, the size distribution is updated and the
process is repeated until, after m steps, the smallest size bin at 1.7 nm is reached,
where the nucleation rate is determined.
The NAIS. The neutral cluster and air ion spectrometer (NAIS)57 measures
the size distributions of positively and negatively charged particles, and also of total (charged plus neutral) particles, between mobility-equivalent diameters of 0.75 nm and 45 nm. Because the instrument includes two mobility analysers operating in parallel, positive and negative spectra are obtained simultaneously, each with 21 electrometers. Taking into account the internal diffusion losses, the mobility distribution is then calculated in 28 size bins from the measured electrometer currents.
The instrument operates sequentially in three modes: ion, particle and offset mode (one cycle takes 150 s). The aerosol sample first passes through a pre-conditioning section containing a discharger, an electric filter, a charger and a second electric filter (post-filter). The charger and discharger are corona needles of opposite polarities. In ion mode, the preconditioning unit is switched off and the sample passes through unaffected. In this way, the mobility analysers