This is a repository copy of Impact of pelvic floor muscle training on sexual function of women with urinary incontinence and a comparison of electrical stimulation versus
standard treatment (IPSU trial): a randomised controlled trial.
White Rose Research Online URL for this paper: http://eprints.whiterose.ac.uk/120436/
Version: Accepted Version
Article:
Jha, S., Walters, S.J. orcid.org/0000-0001-9000-8126, Bortolami, O. et al. (2 more authors) (2017) Impact of pelvic floor muscle training on sexual function of women with urinary incontinence and a comparison of electrical stimulation versus standard treatment (IPSU trial): a randomised controlled trial. Physiotherapy. ISSN 0031-9406
https://doi.org/10.1016/j.physio.2017.06.003
Article available under the terms of the CC-BY-NC-ND licence (https://creativecommons.org/licenses/by-nc-nd/4.0/).
[email protected] https://eprints.whiterose.ac.uk/
Reuse
This article is distributed under the terms of the Creative Commons Attribution-NonCommercial-NoDerivs (CC BY-NC-ND) licence. This licence only allows you to download this work and share it with others as long as you credit the authors, but you can’t change the article in any way or use it commercially. More
information and the full terms of the licence here: https://creativecommons.org/licenses/
Takedown
If you consider content in White Rose Research Online to be in breach of UK law, please notify us by
Title Page
Title Page
Title: Impact of Pelvic Floor Muscle Training on Sexual function of women with Urinary
Incontinence and a comparison of electrical stimulation versus standard treatment (IPSU
Trial): a randomised controlled trial
Short Running Title: IPSU Trial
Authors: Swati Jha1 *, Stephen J Walters2, Oscar Bortolami3, Simon Dixon4, Abualbishr
Alshreef5
1. Consultant Obstetrician and Gynaecologist and Honorary Senior Clinical Lecturer,
Subspecialist in Urogynaecology. Department of Urogynaecology, Sheffield Teaching
Hospitals NHS Foundation Trust.
* Author for Correspondence
Address: Sheffield Teaching Hospitals, Level 4, Jessop Wing, Tree Root Walk, Sheffield. S10
2SF
Email: [email protected]
Phone Number: 0044 (0)114 2268166
Fax: 0044 (0)114 2268165
2. Professor of Medical Statistics and Clinical Trials, School of Health & Related Research
(ScHARR), Sheffield University.
3. Senior Medical Statistician, School of Health & Related Research (ScHARR), Sheffield
University.
4. Professor of Health Economics, School of Health & Related Research (ScHARR), Sheffield
5. Research Associate in Health Economics, School of Health & Related Research (ScHARR),
Sheffield University.
Contribution of each author:
SJ: conceived the project, designed the study, recruited patients, wrote the paper
SJW: contributed to the design of study, analysis and interpretation of the data and the
drafting of the paper
OB: analysis and interpretation of the data
SD: contributed to the design of study, analysis and interpretation of the data and the
drafting of the paper
AA: analysis and interpretation of the data
Financial Disclosures:
None of the authors have any financial or personal relationship with people or organisations
that may inappropriately bias the work.
Disclosures:
No conflicts of interest to report for any of the authors.
Details of ethics approval: Formal ethical approval was obtained from the South Yorkshire
REC (11/YH/0170).
Trial registration: ISRCTN09586238
Funding: NIHR RfPB
Declaration: This paper presents independent research funded by the National Institute for
Health Research (NIHR) under its Research for Patient Benefit (RfPB) Programme (Grant
Reference Number PB-PG-0110-19276). The views expressed are those of the author(s) and
Acknowledgements: We wish to thank Kate Reece, Elizabeth Livesley, Julie Robbins and the
clerical team of Women’s health Physiotherapy at the Royal Hallamshire hospital, Sheffield,
UK.
Abstract
Aims
To evaluate the clinical and cost-effectiveness of electric stimulation plus standard pelvic floor muscle training compared to standard pelvic floor muscle training alone in women with urinary incontinence and sexual dysfunction.
Methods
Single centre two arm parallel group randomised controlled trial conducted in a Teaching hospital in England. Participants were women presenting with urinary incontinence and sexual dysfunction. The interventions compared were electric stimulation versus standard pelvic floor muscle training.
Outcome measures
included Prolapse and Incontinence Sexual function Questionnaire (PISQ) physical function dimension at post-treatment (primary); other dimensions of PISQ, SF-36; EQ-5D, EPAQ, resource use, adverse events and cost-effectiveness (secondary outcomes).
Results
114 women were randomised (Intervention n = 57; Control group n = 57). 64/114 (56%) participants had valid primary outcome data at follow-up (Intervention 30; Control 34). The mean PISQ-PF dimension scores at follow-up were 33.1 (SD 5.5) and 32.3 (SD 5.2) for the Intervention and Control groups respectively; with the Control group having a higher (better) score. After adjusting for baseline score, BMI, menopausal status, time from randomisation
0 (9 CI P
There was no differences between the groups in any of the secondary outcomes at follow-up. Within this study, the use of electrical stimulation was cost-effective with very small incremental costs and quality adjusted life years (QALYs).
Conclusions
In women presenting with urinary incontinence in conjunction with sexual dysfunction, physiotherapy is beneficial to improve overall sexual function. However no specific form of physiotherapy is beneficial over another.
Trial registration ISRCTN09586238.
Keywords
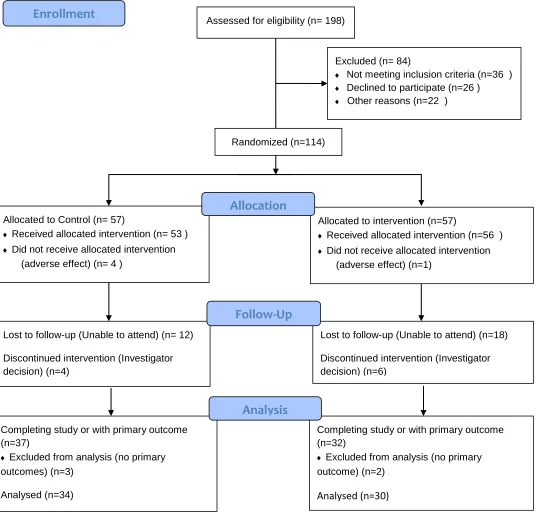
Figure 1: CONSORT Flow chart: Participant flow in the IPSU
Assessed for eligibility (n= 198)
Excluded (n= 84)
♦ Not meeting inclusion criteria (n=36 )
♦ Declined to participate (n=26 )
♦ Other reasons (n=22 )
Completing study or with primary outcome (n=37)
♦Excluded from analysis (no primary outcomes) (n=3)
Analysed (n=34)
Lost to follow-up (Unable to attend) (n= 12)
Discontinued intervention (Investigator decision) (n=4)
Allocated to Control (n= 57)
♦Received allocated intervention (n= 53 )
♦Did not receive allocated intervention (adverse effect) (n= 4 )
Lost to follow-up (Unable to attend) (n=18)
Discontinued intervention (Investigator decision) (n=6)
Allocated to intervention (n=57)
♦Received allocated intervention (n=56 )
♦Did not receive allocated intervention (adverse effect) (n=1)
Completing study or with primary outcome (n=32)
♦Excluded from analysis (no primary outcome) (n=2)
Analysed (n=30)
Allocation
Analysis Follow-Up
Randomized (n=114)
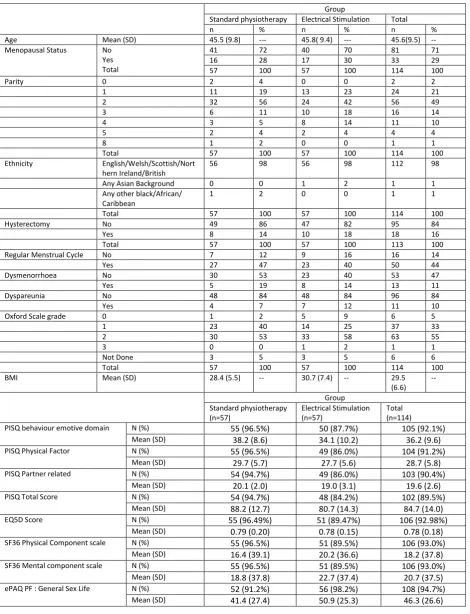
Table 1 Demographics and characteristics of participants at baseline
Group
Standard physiotherapy Electrical Stimulation Total
n % n % n %
Age Mean (SD) 45.5 (9.8) --- 45.8( 9.4) --- 45.6(9.5) -- Menopausal Status No
Yes Total
41 72 40 70 81 71
16 28 17 30 33 29
57 100 57 100 114 100
Parity 0 2 4 0 0 2 2
1 11 19 13 23 24 21
2 32 56 24 42 56 49
3 6 11 10 18 16 14
4 3 5 8 14 11 10
5 2 4 2 4 4 4
8 1 2 0 0 1 1
Total 57 100 57 100 114 100
Ethnicity English/Welsh/Scottish/Nort hern Ireland/British
56 98 56 98 112 98
Any Asian Background 0 0 1 2 1 1
Any other black/African/ Caribbean
1 2 0 0 1 1
Total 57 100 57 100 114 100
Hysterectomy No 49 86 47 82 95 84
Yes 8 14 10 18 18 16
Total 57 100 57 100 113 100
Regular Menstrual Cycle No 7 12 9 16 16 14
Yes 27 47 23 40 50 44
Dysmenorrhoea No 30 53 23 40 53 47
Yes 5 19 8 14 13 11
Dyspareunia No 48 84 48 84 96 84
Yes 4 7 7 12 11 10
Oxford Scale grade 0 1 2 5 9 6 5
1 23 40 14 25 37 33
2 30 53 33 58 63 55
3 0 0 1 2 1 1
Not Done 3 5 3 5 6 6
Total 57 100 57 100 114 100
BMI Mean (SD) 28.4 (5.5) -- 30.7 (7.4) -- 29.5 (6.6) -- Group Standard physiotherapy (n=57) Electrical Stimulation (n=57) Total (n=114) PISQ behaviour emotive domain N (%) 55 (96.5%) 50 (87.7%) 105 (92.1%)
Mean (SD) 38.2 (8.6) 34.1 (10.2) 36.2 (9.6)
PISQ Physical Factor N (%) 55 (96.5%) 49 (86.0%) 104 (91.2%)
Mean (SD) 29.7 (5.7) 27.7 (5.6) 28.7 (5.8)
PISQ Partner related N (%) 54 (94.7%) 49 (86.0%) 103 (90.4%)
Mean (SD) 20.1 (2.0) 19.0 (3.1) 19.6 (2.6)
PISQ Total Score N (%) 54 (94.7%) 48 (84.2%) 102 (89.5%)
Mean (SD) 88.2 (12.7) 80.7 (14.3) 84.7 (14.0)
EQ5D Score N (%) 55 (96.49%) 51 (89.47%) 106 (92.98%)
Mean (SD) 0.79 (0.20) 0.78 (0.15) 0.78 (0.18)
SF36 Physical Component scale N (%) 55 (96.5%) 51 (89.5%) 106 (93.0%)
Mean (SD) 16.4 (39.1) 20.2 (36.6) 18.2 (37.8)
SF36 Mental component scale N (%) 55 (96.5%) 51 (89.5%) 106 (93.0%)
Mean (SD) 18.8 (37.8) 22.7 (37.4) 20.7 (37.5)
ePAQ PF : General Sex Life N (%) 52 (91.2%) 56 (98.2%) 108 (94.7%)
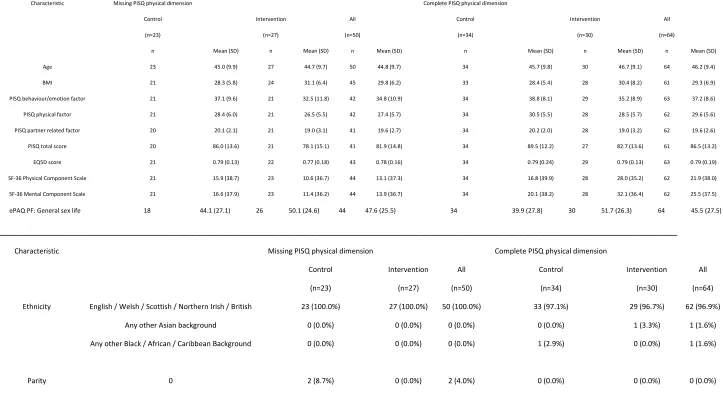
Table 2: Baseline characteristics by treatment group and missing data status
______________________________________________________________________________________________________________________
Characteristic Missing PISQ physical dimension Complete PISQ physical dimension
Control Intervention All Control Intervention All
(n=23) (n=27) (n=50) (n=34) (n=30) (n=64)
n Mean (SD) n Mean (SD) n Mean (SD) n Mean (SD) n Mean (SD) n Mean (SD)
Age 23 45.0 (9.9) 27 44.7 (9.7) 50 44.8 (9.7) 34 45.7 (9.8) 30 46.7 (9.1) 64 46.2 (9.4)
BMI 21 28.3 (5.8) 24 31.1 (6.4) 45 29.8 (6.2) 33 28.4 (5.4) 28 30.4 (8.2) 61 29.3 (6.9)
PISQ behaviour/emotion factor 21 37.1 (9.6) 21 32.5 (11.8) 42 34.8 (10.9) 34 38.8 (8.1) 29 35.2 (8.9) 63 37.2 (8.6)
PISQ physical factor 21 28.4 (6.0) 21 26.5 (5.5) 42 27.4 (5.7) 34 30.5 (5.5) 28 28.5 (5.7) 62 29.6 (5.6)
PISQ partner related factor 20 20.1 (2.1) 21 19.0 (3.1) 41 19.6 (2.7) 34 20.2 (2.0) 28 19.0 (3.2) 62 19.6 (2.6)
PISQ total score 20 86.0 (13.6) 21 78.1 (15.1) 41 81.9 (14.8) 34 89.5 (12.2) 27 82.7 (13.6) 61 86.5 (13.2)
EQ5D score 21 0.79 (0.13) 22 0.77 (0.18) 43 0.78 (0.16) 34 0.79 (0.24) 29 0.79 (0.13) 63 0.79 (0.19)
SF-36 Physical Component Scale 21 15.9 (38.7) 23 10.6 (36.7) 44 13.1 (37.3) 34 16.8 (39.9) 28 28.0 (35.2) 62 21.9 (38.0)
SF-36 Mental Component Scale 21 16.6 (37.9) 23 11.4 (36.2) 44 13.9 (36.7) 34 20.1 (38.2) 28 32.1 (36.4) 62 25.5 (37.5)
ePAQ PF: General sex life 18 44.1 (27.1) 26 50.1 (24.6) 44 47.6 (25.5) 34 39.9 (27.8) 30 51.7 (26.3) 64 45.5 (27.5)
_____________________________________________________________________________________________________________________________
Characteristic Missing PISQ physical dimension Complete PISQ physical dimension
Control Intervention All Control Intervention All
(n=23) (n=27) (n=50) (n=34) (n=30) (n=64)
Ethnicity English / Welsh / Scottish / Northern Irish / British 23 (100.0%) 27 (100.0%) 50 (100.0%) 33 (97.1%) 29 (96.7%) 62 (96.9%) Any other Asian background 0 (0.0%) 0 (0.0%) 0 (0.0%) 0 (0.0%) 1 (3.3%) 1 (1.6%) Any other Black / African / Caribbean Background 0 (0.0%) 0 (0.0%) 0 (0.0%) 1 (2.9%) 0 (0.0%) 1 (1.6%)
__________________________________________________________________________________________________________________________
1 4 (17.4%) 6 (22.2%) 10 (20.0%) 7 (20.6%) 7 (23.3%) 14 (21.9%) 2 11 (47.8%) 9 (33.3%) 20 (40.0%) 21 (61.8%) 15 (50.0%) 36 (56.3%)
3 2 (8.7%) 6 (22.2%) 8 (16.0%) 4 (11.8%) 4 (13.3%) 8 (12.5%)
4 2 (8.7%) 6 (22.2%) 8 (16.0%) 1 (2.9%) 2 (6.7%) 3 (4.7%)
5 1 (4.3%) 0 (0.0%) 1 (2.0%) 1 (2.9%) 2 (6.7%) 3 (4.7%)
8 1 (4.3%) 0 (0.0%) 1 (2.0%) 0 (0.0%) 0 (0.0%) 0 (0.0%)
Hysterectomy No 20 (87.0%) 23 (85.2%) 43 (86.0%) 28 (82.4%) 24 (80.0%) 52 (81.3%) Yes 3 (13.0%) 4 (14.8%) 7 (14.0%) 5 (14.7%) 6 (20.0%) 11 (17.2%)
Menopausal No 18 (78.3%) 21 (77.8%) 39 (78.0%) 23 (67.6%) 19 (63.3%) 42 (65.6%)
Yes 5 (21.7%) 6 (22.2%) 11 (22.0%) 11 (32.4%) 11 (36.7%) 22 (34.4%)
Regular menstrual cycle No 4 (17.4%) 7 (25.9%) 11 (22.0%) 3 (8.8%) 2 (6.7%) 5 (7.8%) Yes 11 (47.8%) 11 (40.7%) 22 (44.0%) 16 (47.1%) 12 (40.0%) 28 (43.8%) Dysmenorrhoea No 14 (60.9%) 12 (44.4%) 26 (52.0%) 16 (47.1%) 11 (36.7%) 27 (42.2%)
Yes 2 (8.7%) 6 (22.2%) 8 (16.0%) 3 (8.8%) 2 (6.7%) 5 (7.8%)
Dyspareunia No 18 (78.3%) 23 (85.2%) 41 (82.0%) 30 (88.2%) 25 (83.3%) 55 (85.9%)
Yes 2 (8.7%) 3 (11.1%) 5 (10.0%) 2 (5.9%) 4 (13.3%) 6 (9.4%)
Oxford scale grade 0 1 (4.3%) 3 (11.1%) 4 (8.0%) 0 (0.0%) 2 (6.7%) 2 (3.1%)
1 7 (30.4%) 8 (29.6%) 15 (30.0%) 16 (47.1%) 6 (20.0%) 22 (34.4%) 2 12 (52.2%) 11 (40.7%) 23 (46.0%) 18 (52.9%) 22 (73.3%) 40 (62.5%)
Table 3 Overall change in PISQ following physiotherapy (both types of treatment combined)
Outcome
n Mean change (SD) 95% CI p-value
PISQ behaviour/emotion
factor 63 2.3 (6.8) 0.6 to 4.0 0.009
PISQ physical factor 62 3.2 (6.2) 1.6 to 4.8 <0.001
PISQ partner related factor 62 0.5 (2.2) -0.1 to 1.0 0.094
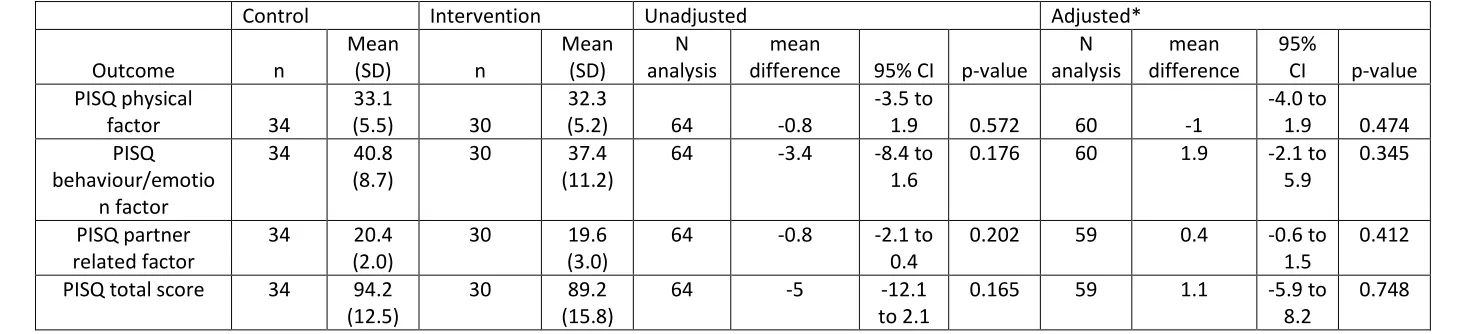
Table 4: Primary Outcomes: mean difference of PISQ domains between Control and Intervention
Control Intervention Unadjusted Adjusted*
Outcome n
Mean
(SD) n
Mean (SD)
N analysis
mean
difference 95% CI p-value N analysis
mean difference
95%
CI p-value PISQ physical
factor 34
33.1
(5.5) 30
32.3
(5.2) 64 -0.8
-3.5 to
1.9 0.572 60 -1
-4.0 to
1.9 0.474
PISQ behaviour/emotio
n factor
34 40.8
(8.7)
30 37.4
(11.2)
64 -3.4 -8.4 to
1.6
0.176 60 1.9 -2.1 to
5.9
0.345
PISQ partner related factor
34 20.4
(2.0)
30 19.6
(3.0)
64 -0.8 -2.1 to
0.4
0.202 59 0.4 -0.6 to
1.5
0.412
PISQ total score 34 94.2
(12.5)
30 89.2
(15.8)
64 -5 -12.1
to 2.1
0.165 59 1.1 -5.9 to
8.2
0.748
*Adjusted for baseline score, BMI, menopausal status, time from randomisation and oxford scale