White Rose Research Online URL for this paper:
http://eprints.whiterose.ac.uk/106795/
Version: Accepted Version
Article:
Bagni, C. orcid.org/0000-0003-1614-3009, Askes, H. orcid.org/0000-0002-4900-1376 and
Susmel, L. orcid.org/0000-0001-7753-9176 (2016) Gradient elasticity: a transformative
stress analysis tool to design notched components against uniaxial/multiaxial high-cycle
fatigue. Fatigue & Fracture of Engineering Materials & Structures, 39 (8). pp. 1012-1029.
ISSN 8756-758X
https://doi.org/10.1111/ffe.12447
This is the peer reviewed version of the following article: Bagni, C., Askes, H., Susmel, L.
Gradient elasticity: a transformative stress analysis tool to design notched components
against uniaxial/multiaxial high-cycle fatigue. Fatigue Fract Engng Mater Struct. 39 8, pp.
1012–1029, 2016 , which has been published in final form at
http://doi.org/10.1111/ffe.12447. This article may be used for non-commercial purposes in
accordance with Wiley Terms and Conditions for Self-Archiving.
[email protected] https://eprints.whiterose.ac.uk/ Reuse
Unless indicated otherwise, fulltext items are protected by copyright with all rights reserved. The copyright exception in section 29 of the Copyright, Designs and Patents Act 1988 allows the making of a single copy solely for the purpose of non-commercial research or private study within the limits of fair dealing. The publisher or other rights-holder may allow further reproduction and re-use of this version - refer to the White Rose Research Online record for this item. Where records identify the publisher as the copyright holder, users can verify any specific terms of use on the publisher’s website.
Takedown
If you consider content in White Rose Research Online to be in breach of UK law, please notify us by
Gradient elasticity: a transformative stress analysis tool to design
notched components against uniaxial/multiaxial high-cycle fatigue
Cristian Bagni, Harm Askes, Luca Susmel
Department of Civil and Structural Engineering, The University of Sheffield, Mappin Street, Sheffield S1 3JD, United Kingdom
Corresponding Author: Prof. Luca Susmel
Department of Civil and Structural Engineering
The University of Sheffield, Mappin Street, Sheffield, S1 3JD, UK Telephone: +44 (0) 114 222 5073
Fax: +44 (0) 114 222 5700 e-mail: [email protected]
Abstract
This paper investigates the accuracy of gradient elasticity in estimating high-cycle fatigue
strength of notched components subjected to both uniaxial and multiaxial fatigue loading. A
novel design methodology is formulated by combining Ru and Aifantis’ gradient elasticity
with the Theory of Critical Distances and the Modified Wöhler Curve Method. The
key-feature of this innovative design methodology is that, via the Theory of Critical Distances,
gradient elasticity’s length scale parameter is directly estimated from conventional material
fatigue properties (i.e., the plain fatigue limit and the threshold value of the stress intensity
factor). From a stress analysis point of view, the proposed approach directly post-processes
the gradient-enriched stress states determined, at the hot-spots, on the surface of the
component under investigation (and independently of the sharpness of the stress
concentrator being assessed). The accuracy and reliability of this design method was checked
by using a large number of experimental results taken from the literature and generated by
testing notched metallic samples under uniaxial as well as under multiaxial fatigue loading.
This comprehensive validation exercise demonstrates that the systematic usage of this
transformative design approach leads to the same level of accuracy as the one which is
obtained by applying the classic Theory of Critical Distances. This result is certainly
remarkable since the proposed approach is not only very efficient from a computational
point of view, but it also allows high-cycle fatigue damage to be assessed by directly
post-processing gradient-enriched stress states determined on the surface of the component being
assessed.
Nomenclature
r, θ = local polar coordinates R = load ratio
Kf = fatigue strength reduction factor
∆Kth = range of the threshold value of the stress intensity factor
rn = root radius
n = outward normal to the boundary
eff
ρ
= critical plane stress ratiog eff
ρ = gradient-enriched critical plane stress ratio at the hot-spot
lim
ρ
= limit value of the critical plane stress ratiog lim
ρ
= limit value of the gradient-enriched critical plane stress ratio at the hot-spot m = mean stress sensitivity indexNf = number of cycles to failure
N0 = reference number of cycles to failure
Kt = stress concentration factor under uniaxial loading
Ktt = stress concentration factor under torsion
kτ = negative inverse slope of the modified Wöhler curve
α, β, a, b = material constants in the MWCM approach L = critical distance
l = gradient elasticity length scale parameter Cijkl = elastic tensor
bi = body forces
uk = displacements c
k
u = classical (or local) displacements
g k
u = gradient-enriched (or non-local) displacements εij = infinitesimal strain tensor
σij = Cauchy’s stress tensor g
ij
σ
= gradient-enriched (or non-local) stress tensor∆σeff = range of the effective stress
∆σy = range of the linear-elastic normal stress
g y σ
∆ = range of the gradient-enriched normal stress at the notch tip
∆σ0 = range of the plain fatigue limit g
0 σ
∆ = gradient-enriched range of the plain fatigue limit at the surface of the specimen
m n,
σ = mean value of the stress normal to the critical plane g
m n,
σ = gradient-enriched mean value of the stress normal to the critical plane at the hot-spot
a n,
σ = amplitude of the stress normal to the critical plane g
a n,
σ = gradient-enriched amplitude of the stress normal to the critical plane at the hot-spot
0
σ = fully-reversed uniaxial fatigue limit at N0 cycles to failure g
0
σ = gradient-enriched uniaxial fatigue limit at the surface of the specimen
a
τ = shear stress amplitude on the critical plane
g a
τ = gradient-enriched shear stress amplitude on the critical plane at the hot-spot
τ0 = fully-reversed torsional fatigue limit at N0 cycles to failure g
0
τ = gradient-enriched torsional fatigue limit at the surface of the specimen
eq
τ = equivalent shear stress g
eq
τ = gradient-enriched equivalent shear stress at the hot-spot t = generic time instant
F0 = amplitude of the external uniaxial force in the fatigue limit condition
M0 = amplitude of the external bending moment in the fatigue limit condition
T0 = amplitude of the external torsional moment in the fatigue limit condition
[%]
E
σ = fatigue strength error index for Mode I fatigue loading[%]
E
τ = fatigue strength error index for multiaxial fatigue loadingINTRODUCTION
The complex geometries of real mechanical components often result in local stress
concentration phenomena that affect the overall fatigue strength of the components
themselves. According to the classic method due to Neuber [1] and Peterson [2], the
detrimental effect of stress raisers can be taken into account by correcting the plain material
SN curve via the so-called fatigue strength reduction factor, Kf. Owing to the fact that the
stress analysis has to be performed in terms of nominal net stresses, the in-field usage of this
approach requires the definition of suitable nominal net cross-sectional areas.
Unfortunately, in the presence of complex three-dimensional geometries this is not always
straightforward, leading to possible design ambiguities and errors.
As far as high-cycle fatigue strength is concerned, the extent of fatigue damage can somehow
be quantified also in terms of linear-elastic notch tip stresses [3]. The advantage of this
simplified approach is that linear-elastic notch root stresses can easily be determined via
conventional linear-elastic finite element (FE) models. However, even if this FE based
methodology is very straightforward, the resulting level of conservatism is seen to increase as
the sharpness of the geometrical feature being assessed increases [3]. Therefore, under
relatively large values of the stress concentration factors, this leads to components and
structures which are heavier and bigger than necessary, with a consequent inefficient usage
fatigue cracks and sharp notches, since the resulting linear-elastic local stress fields become
singular when crack/notch tip radii are taken equal to zero.
Examination of the state of the art shows that in recent years different theories have been
devised to specifically perform the high-cycle fatigue assessment of notched components
without missing the undoubted advantages of linear-elastic FE solutions. In this context, the
so-called Theory of Critical Distances (TCD) [3] has proven to be a reliable design tool
capable of accurately estimating high-cycle fatigue strength of components containing stress
risers of all kinds. Taking as a starting point Neuber and Peterson’s ideas [1, 2], the TCD
postulates that the extent of fatigue damage can be quantified via an effective stress whose
magnitude depends not only on the local linear-elastic stress fields in the vicinity of the
assumed crack initiation locations, but also on a specific material characteristic length. In the
TCD framework, such a critical distance is treated as a material property whose value
changes as the load ratio varies (mean stress effect in fatigue). However, despite its
undoubted accuracy and advantages, using the TCD to post-process linear-elastic stress
fields determined from FE models is not only cumbersome, but also demanding from a
computational viewpoint, a very refined mesh being required to accurately determine the
local stress fields in the presence of sharp notches and cracks.
To overcome these problems, the TCD can efficiently be applied numerically by
reinterpreting it in terms of gradient elasticity [4]. Gradient elasticity assumes that the
relevant stress fields ahead of crack/notch tips have to be calculated by directly incorporating
a length scale parameter into the adopted constitutive law, such a characteristic length being
representative of the underlying material microstructure.
Recently, the analogies between the TCD and gradient elasticity were investigated in detail
and an explicit relationship between the length scale parameters used by these two
approaches was established (see Refs [5-7]). In this context, Tovo and Livieri have recently
using gradient elasticity) is successful in estimating high-cycle fatigue strength of welded
joints [8, 9].
In this complex scenario, the aim of the present paper is to formulate an alternative fatigue
design approach which combines the TCD’s accuracy in estimating high-cycle notch fatigue
strength with the computational efficiency of gradient elasticity in determining non-local
stress fields in the vicinity of finite radius stress raisers.
GRADIENT ELASTICITY
Gradient elasticity represents a family of theories which allows the influence of the
underlying material microstructure to be taken into account directly. This is possible by
enriching the constitutive relations through high-order gradients of the relevant state
variables together with intrinsic length scale parameters. One of the most important
advantages of gradient elasticity is its ability to remove singularities from the linear-elastic
stress fields in the vicinity of cracks and sharp notches. Further, as far as finite radius stress
concentrators are concerned, the use of gradient elasticity leads to linear-elastic stress fields
having a magnitude lower than the corresponding one determined according to classic
continuum mechanics.
In this paper, the theory developed by Aifantis and co-workers in the early 1990s [4, 10, 11]
and recently implemented in a unified finite element framework [12, 13] is considered. This
approach consists in enriching the constitutive relations with the Laplacian of the strains as
follows:
(
kl,mm)
2 kl ijklij =C ε − ε
σ l (1)
where σij is the Cauchy stress tensor, εij is the infinitesimal strain tensor, Cijkl is the elastic
constitutive tensor and l is an intrinsic material length scale parameter. Eq. (1) leads to the
(
u)
b 0Cijkl k,jl−l2εk,jlmm + i = (2)
where uk are the displacements and bi the body forces.
Eq. (2) represents a system of fourth-order partial differential equations which require
continuity of displacements and their first derivatives, with significant complications in the
finite element implementation. However, in the 1990s Ru and Aifantis [4] proposed a
theorem, consisting in a factorisation of the derivatives, which allows the solution of Eq. (2)
to be calculated as two uncoupled systems of second-order partial differential equations. This
results in a straightforward and effective C0 finite element implementation [12, 13].
The first step of the aforementioned theorem consists in the solution of the standard
equations of classical elasticity:
0 b u
Cijkl ck,jl+ i = (3)
where uck are the classical (or local) displacements.
Using then the calculated local displacements uck as source terms, it is possible to solve the
following second system of partial differential equations:
c k g
mm , k 2 g
k u u
u −l = (4)
where ugk are the gradient-enriched (or non-local) displacements.
In the finite element methodology discussed in Refs [12, 13] and used for the numerical
simulations in the present investigation, the second step was considered in terms of stresses
c l , k ijkl g
mm , ij 2 g
ij− σ =C u
σ l (5)
which is obtained from Eq. (4) after differentiation and pre-multiplication with Cijkl. This
stress-based formulation has several advantages over the displacement-based approach as
explained in detail in Refs [14-16].
As to the in-field usage of gradient elasticity, while for the first step the boundary conditions
are clearly defined and they consist in the usual choice between essential or natural
boundary conditions, the definition of the best boundary conditions for the second step is
still subject to some debate. However, the application of homogeneous natural boundary
conditions throughout the boundary is widely accepted as the best option to be used.
THEORY OF CRITICAL DISTANCES
As stated by Taylor [3], the TCD represents a family of methods that are all characterised by
two main common features: (i) the relevant stress fields are determined by adopting a simple
linear-elastic constitutive law to model the mechanical behaviour of the material being
assessed; (ii) the extent of damage is assessed via an effective stress whose value depends not
only on the entire linear-elastic stress fields acting on the material in the vicinity of the crack
initiation locations, but also on a material characteristic length.
Independently of the strategy which is followed to formalise the TCD, this approach assumes
that in the high-cycle fatigue regime the threshold condition for the non-propagation of a
crack can directly be expressed as follows [17]:
0 eff ≤∆σ σ
where Δσeff is the range of the effective stress (which is a function also of a material critical
distance), whereas Δσ0 is the plain fatigue limit range (determined under the load ratio,
R=σmin/σmax, of interest).
Examination of the state of the art [3] shows that the TCD has been formulated in different
ways which include the Point, Line, and Area Method. The common feature of these different
formalisations of the TCD is that the required critical distance can directly be determined
from the plain fatigue limit range, ∆σ0, and the threshold value of the stress intensity factor
range, ∆Kth, as follows [17-19]:
2
0 th
K 1
L
σ ∆ ∆ π
= (7)
It is important to point out here that critical distance L has to be estimated by using values
for ∆σ0 and ∆Kth determined under the same load ratio, R, as the one characterising the load
history applied to the component being assessed.
Turning back to the different formalisations of the TCD, the Point Method (PM) –that was
first proposed by Peterson [2] - postulates that the range of the effective stress has to be
calculated at a distance from the stress concentrator being assessed equal to L/2, i.e. [17]
(see also Figure 1b):
= = θ σ ∆ = σ ∆
2 L r , 0
y
eff (8)
According to Neuber’s idea [1], the Line Method (LM) instead calculates Δσeff by averaging
(
)
∫ ∆σ θ= =σ
∆ eff 02L y 0,rdr
L 2
1
(9)
Finally, as suggested by Sheppard [20], the Area Method (AM) calculates ∆σeff by averaging
∆σy over a semi-circular area of radius L and centred at the notch tip. The range of the
effective stress ∆σeff is then determined as [3, 17] (see also Figure 1d):
( )
∫ ∫
⋅
⋅
θ
=
2π
0 L
0 y 2
eff
Δσ
θ,
r
r
dr
d
πL
4
Δσ
(10)where r and θ are the local polar coordinates in a reference system centred at the notch tip
(see Figure 1a).
EXTENDING THE USE OF THE PM TO MULTIAXIAL FATIGUE SITUATIONS
The TCD as reviewed in the previous section can be applied solely to notches subjected to
in-service Mode I fatigue loading. In order to extend its use to those situations involving
complex multiaxial load histories, this approach has to be applied along with an appropriate
multiaxial fatigue damage model [21, 22]. By performing a systematic validation exercise
based on a large number of experimental results [21, 23, 24], it has been proven that the
highest level of accuracy is obtained by applying the PM along with the so-called Modified
Wöhler Curve Method (MWCM) [21, 25, 26].
The MWCM is a bi-parametrical critical plane approach, the critical plane being that
material plane experiencing the maximum shear stress amplitude, τa. The MWCM quantifies
the extent of fatigue damage not only via τa, but also via the mean value, σn,m, and the
amplitude, σn,a, of the stress perpendicular to the critical plane. The damaging effect of these
three stress components is assessed through the critical plane stress ratio which is defined as
a a , n m , n eff
m
τ σ + σ ⋅ =
ρ (11)
In definition (11) m is the mean stress sensitivity index [26], i.e., a material property whose
value (ranging in the interval 0-1) has to be determined by running appropriate experiments
[21, 27]. The most remarkable feature of ratio ρeff is that it is sensitive not only to the
presence of non-zero mean stresses, but also to the degree of multiaxiality of the load history
being assessed [21].
The way the MWCM assesses fatigue strength under multiaxial fatigue loading is shown in
the modified Wöhler diagram of Figure 2a. This log-log chart plots τa against the number of
cycles to failure, Nf. If this schematisation is used to describe the multiaxial fatigue behaviour
of metallic materials, much experimental evidence [21, 25, 26] suggests that different fatigue
curves are obtained as ratio ρeff varies (Fig. 2a). The position and the negative inverse slope
of any Modified Wöhler curve can then be defined via the following relationships [21, 25,
26]:
(
ρ)
α ρ βkτ eff = ⋅ eff + (12)
(
ρ)
a ρ bτRef eff = ⋅ eff + (13)
In Eqs (12) and (13) kτ(ρeff) is the negative inverse slope, τRef(ρeff) is the reference shear stress
amplitude (i.e., the endurance limit) estimated at N0 cycles to failure (see Figure 2a), and α,
β, a and b are material constants to be determined by running appropriate experiments [21].
By observing that ρeff is equal to unity under fully-reversed uniaxial cyclic loading and to zero
under torsional cyclic loading [21, 25], Eq. (13) suggests that, according to the MWCM’s
used to denote the endurance limits extrapolated at N0 cycles to failure under fully-reversed
uniaxial and torsional fatigue loading, respectively, then relationship (13) can be rewritten as
follows: 0 eff 0 0 eff Ref
2
⋅
ρ
+
τ
τ
−
σ
=
ρ
τ
(
)
(14)According to the Modified Wöhler diagram of Figure 2a, the material being investigated is in
the endurance limit condition as long as τa is lower than (or, at least, equal to) the reference
shear stress estimated via Eq. (14) for the value of ratio ρeff characterising the cyclic state of
stress relative to the critical plane, i.e.:
⇒ τ + ρ ⋅ τ − σ = ρ τ ≤
τ 0 0 eff 0
eff f Re a 2 ) ( 0 eff 0 0 a eq
2 ⋅ρ ≤τ τ − σ − τ = τ ⇒ (15)
where τeq can be treated as an equivalent shear stress.
The MWCM formalised according to Eq. (15) can be used as long as fatigue damage is mainly
governed by the shear stress amplitude relative to the critical plane. On the contrary, under
large values of ratio ρeff, the estimates obtained via criterion (15) are seen to be characterised
by an excessive level of conservatism [28]. This can be ascribed to the fact that, when
micro/meso cracks are fully open, an increase of the normal mean stress does not lead to a
further increase of the associated fatigue damage [26, 29]. According to this reasoning, Eq.
(15) is recommended to be corrected as shown in the τa vs. ρeff chart of Figure 2b [21, 26]. As
condition as long as τa is below the limit curve determined according to criterion (15) up to a
value of ρeff equal to ρlim, where [21, 26]:
0 0
0 lim
2τ −σ τ =
ρ (16)
For ρeff>ρlim, the reference shear stress to be used to estimate multiaxial fatigue damage is
assumed instead to be constant and invariably equal to τRef(ρlim) [21, 26] – see Figure 2b.
The MWCM can directly be applied along with the TCD (used in the form of the PM) to
assess notched components subjected to multiaxial fatigue loading [21, 23, 24]. In particular,
the scale and the stress gradient effect are taken into account via the TCD, whereas the
MWCM assesses the degree of multiaxiality and non-proportionality of the local stress fields
[21].
In order to correctly apply the MWCM along with the PM, the material fatigue properties
needed to estimate m, a, b, and ρlim in Eqs (11), (13) and (16) have to be determined by using
experimental fatigue results generated by testing under fully-reversed loading un-notched
specimens, critical distance L being estimated according to definition (7). It is important to
point out here that to use the MWCM in conjunction with the PM, material length L is
recommended to be estimated by determining both ∆σ0 and ∆Κth under fully-reversed
fatigue loading. This is due the fact that the detrimental effect of non-zero mean stresses is
directly assessed by the MWCM itself [21].
Figure 2c shows how the MWCM is recommended to be used along with the PM to assess the
high-cycle fatigue strength of notched components. In more detail, the component sketched
in this figure is assumed to be subjected to a complex system of cyclic forces and cyclic
moments leading to a time-variable multiaxial stress state acting on the material in the
vicinity of the assumed crack initiation site (point A in Figure 2c). The focus path used to
surface (see Figure 2c). The critical point, O, at which the relevant state of stress has to be
determined is positioned, along the focus path itself, at a distance from the assumed crack
initiation point equal to L/2. By adopting a suitable local frame of reference, Oxyz, the
linear-elastic stress state at point O is as follows (Fig. 2c):
( )
[
]
σ τ τ τ σ τ τ τ σ = σ ) t ( ) t ( ) t ( ) t ( ) t ( ) t ( ) t ( ) t ( ) t ( t z yz xz yz y xy xz xy x (17)where t is time. τa, σn,m and σn,a can now be calculated by directly post-processing tensor (17)
[30, 31]. Subsequently, these stress components have to be used to estimate, according to
definition (11), the effective value of the critical plane stress ratio, ρeff. Finally, as shown in
Figure 2b, the notched component being assessed is assumed to be in the fatigue limit
condition as long as τa is below the limit curve determined by calibrating the MWCM through
the un-notched material fatigue properties (see also Figure 2c).
COMBINING GRADIENT ELASTICITY WITH THE TCD AND THE MWCM
Although it is widely accepted that length scale parameter l is related to the size of the
dominant source of microstructural heterogeneity [15], examination of the state of the art
suggests that the scientific community has yet to agree on a commonly accepted strategy
suitable for estimating l to use gradient elasticity in situations of practical interest.
As to a possible way to determine length l, the previous sections should make it evident that
gradient elasticity and the TCD share some important features. In particular, both
approaches post-process the relevant stress fields by coupling liner-elasticity with an internal
length scale parameter which is assumed to be an intrinsic material property. By taking as a
starting point these similarities, recently it was proven that length l can directly be estimated
2
0 th
K 2 2
1 2 2
L
σ ∆ ∆ π = ≈
l (18)
The above relationship was derived by considering a cracked plate subjected to Mode I
loading, the stress field in the vicinity of the crack tip being post-processed by following a
fairly articulated reasoning based on local mechanics [6]. According to Eq. (18), length scale
parameter l can directly be estimated from the material plain fatigue limit, ∆σ0, and the
threshold value of the stress intensity factor range, ∆Kth. Since both ∆σ0 and ∆Kth are
material properties, l is in turn an intrinsic characteristic length which is different for
different materials and different load ratios. As to the validity of this way of estimating l, by
post-processing a large number of experimental results taken from the literature, gradient
elasticity was seen to be capable of accurately modelling, in the fatigue limit condition, the
transition from the short- to the long-crack regime [6]. Another important aspect is that,
compared to the numerical effort required to apply the conventional TCD to model cracks,
the use of gradient elasticity allowed us to reduce the computational time by at least 50%.
In light of the encouraging results obtained by considering cracked materials, the next logical
step in the development of this design approach is then verifying whether length l estimated
via Eq. (18) is suitable also for assessing high-cycle fatigue strength in the presence of finite
radius stress concentrators.
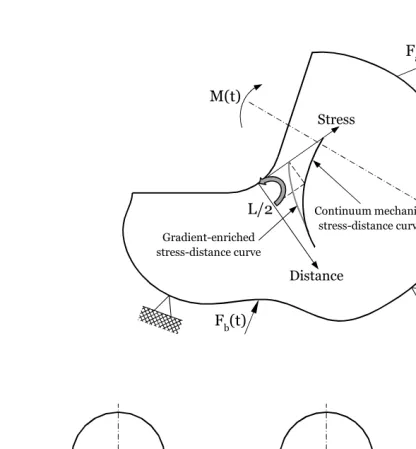
The way gradient elasticity works when it is used to post-process the local stress fields
according to the TCD is explained in Figure 3a, with this schematisation being valid proved
that l is directly derived from L through Eq. (18). As shown in Figure 3a, gradient elasticity
can simply be thought of as an operator transferring the PM linear elastic stress state
determined at a distance from the notch tip equal to L/2 onto the surface of the notch itself
be assessed by directly using the maximum gradient-enriched stress state determined at the
apex of the geometrical feature being assessed.
To use gradient elasticity consistently, the second problem to address is the definition of
appropriate reference un-notched fatigue (endurance) limits. Figures 3b, 3c and 3d show the
stress distributions in a smooth cylindrical shaft loaded in cyclic tension-compression (Fig.
3b), cyclic bending (Fig. 3c) and cyclic torsion (Fig. 3d). These three bars are assumed to be
made of the same metallic material, so that length scale l is the same independently of the
type of applied loading. In these sketches symbols F0, M0 and T0 are used to denote the
amplitudes of the external forces and moments in the fatigue (endurance) limit condition. As
shown in Figures 3c and 3d, the gradient-enriched fatigue (endurance) limits at the surface
of the shaft, σg0 and τ0g, are lower than the corresponding ones, σ0 and τ0, calculated
according to continuum mechanics. This is due to the fact that in the presence of stress
gradients Ru and Aifantis’ gradient elasticity smoothens the local stress fields via length scale
parameter l, irrespective of the source generating the stress gradients themselves. Solely in
the absence of stress gradients – as it happens, for instance, under cyclic axial loading (Fig.
3a) - the use of gradient elasticity returns the same stress fields as those determined
according to continuum mechanics. Therefore, in situations of practical interest, gradient
elasticity should be used by adopting σg0 and τg0 as reference un-notched fatigue (endurance)
limits [32]. However, it has to be said that, in general, under both cyclic bending and cyclic
torsion the difference between conventional and gradient-enriched fatigue (endurance)
limits is seen to be very little (on average, lower than about 5%). This suggests that σ0 and τ0
can still be used as reference fatigue strengths, provided that a little loss of accuracy is
considered to be acceptable when performing the high-cycle fatigue assessment.
Figures 4a and 4b summarise the procedures which are suggested here as being followed to
design notched components against uniaxial and multiaxial high-cycle fatigue, respectively.
For the sake of simplicity, initially attention can be focussed solely on the simpler uniaxial
subjected to Mode I cyclic loading. According to the procedure summarised in Figure 4a, the
range of the gradient-enriched stress at the notch tip, g y σ
∆ , has to be determined by solving a
linear-elastic gradient elasticity FE model - with l being estimated from L via Eq. (18). The
component being assessed is assumed to be at its fatigue (endurance) limit as long as the
following condition is assured:
g 0 g y≤∆σ σ
∆ (19)
It is important to point out here that, as it is postulated by the TCD, under Mode I cyclic
loading both g 0 σ
∆ and l must be determined by post-processing experimental results
generated under the same load ratio as the one characterising the load history that is applied
to the component being assessed.
Turning to the multiaxial fatigue case, consider now the notched component of Figure 4b
which is assumed to be subjected to a complex system of time-variable forces and moments.
By post-processing the results from a gradient elasticity FE model, the gradient-enriched
linear-elastic stress state at the hot-spot can be expressed as follows (Fig. 4b):
( )
[
]
σ τ τ τ σ τ τ τ σ = σ ) t ( ) t ( ) t ( ) t ( ) t ( ) t ( ) t ( ) t ( ) t ( t g z g yz g xz g yz g y g xy g xz g xy g xg (20)
where t is time. In order to to use the MWCM to post-process gradient-enriched tensor (20)
consistently, length scale parameter l is recommended to be estimated via Eq. (18) by
employing material fatigue properties determined under fully-reversed fatigue loading. This
is due to the fact that, by nature, the MWCM is capable of directly modelling the mean stress
effect in uniaxial/multiaxial fatigue [21]. Turning back to the design procedure summarised
maximum shear stress amplitude, g a
τ , and the relevant stress components perpendicular to
the critical plane (i.e., σgn,m and g
a , n
σ ) can directly be calculated according to one of the
available methods [21, 19]. Gradient-enriched stress components τag, σgn,mand g
a , n
σ allow
then the effective value of the critical plane stress ratio, g eff
ρ , to be calculated directly. Finally,
the notched component being designed is assumed to be at its endurance limit as long as the
following condition is assured:
g 0 g eff g 0 g 0 g a g eq
2 ⋅ρ ≤τ
τ − σ − τ =
τ with ρgeff =ρglim for ρgeff >ρglim (21)
where g a g a , n g m , n g eff m τ σ + σ ⋅ =
ρ ; g
0 g 0 g 0 g lim
2τ −σ τ =
ρ (22)
As to the design procedure suggested to be followed to address the multiaxial fatigue
problem (Fig. 4b), under complex time-variable load histories, the gradient-enriched stress
state resulting from every applied force/moment can be computed separately. By so doing,
the total gradient-enriched stress tensor at the hot-spot can then be calculated a posteriori
by employing the superposition principle. This can be done because the proposed approach
makes use of linear-elastic gradient-enriched stresses. Finally, this methodology based on
the superposition principle has to be used by paying attention to keep unchanged the
synchronism amongst the different forces and moments being assessed. This simple and
standard procedure allows the presence of superimposed static stresses as well as the degree
of non-proportionality of the applied load history to be taken into account accurately during
VALIDATION BY EXPERIMENTAL DATA
In order to check its accuracy and reliability, the proposed design approach (Fig. 4) was used
to post-process a large number of experimental data taken from the literature. The
considered results were generated by testing, under both uniaxial and multiaxial cyclic
loading, metallic specimens containing different geometrical features. Table 1 and 2
summarise the experimental results which were used to perform the validation exercise that
will be discussed in the following sub-sections. The reader is also referred to Refs [21, 23, 27,
33] for a detailed summary of the data sets listed in Tables 1 and 2.
Mode I Fatigue Loading
The accuracy of the proposed approach in estimating high-cycle fatigue strength of notched
components was initially checked by considering a number of experimental results generated
by testing flat and cylindrical notched specimens subjected to uniaxial cyclic loading. For the
Mode I loading case, the error was calculated as follows:
100 [%]
E g
0 g 0 g y
⋅ σ ∆
σ ∆ − σ ∆ =
σ (23)
where g
y σ
∆ is the range of the gradient-enriched stress at the notch tip (see Figure 4a).
According to definition (23), a positive value of Eσ indicates a conservative estimate, whereas
a negative value of this error index denotes a non-conservative prediction.
The specimens being analysed were subdivided into three groups, i.e. flat plates with central
notch (CNP), flat plates with double edge notch (DENP) and cylindrical bars with
circumferential notch (CNB). For any considered data sets, Table 1 lists the relevant material
fatigue properties, the maximum and minimum length of the investigated root radius, rn, the
Turning to the gradient elasticity FE analyses, since the considered notched flat specimens
were symmetrical about two axes, only a quarter of the CNP and DENP samples was
modelled. Similarly, in the case of the CNB specimens only half of the longitudinal section
was modelled by using axisymmetric elements. Independently of the specific geometry,
under-integrated bi-quadratic quadrilateral elements were used. The mesh in the vicinity of
the stress concentrators was gradually refined according to the recommendations on optimal
element size given in Refs [12, 13]. In particular, in the highly stressed regions the average
mesh size was equal to about 0.025 mm, with the minimum size approaching 0.002 mm
(Fig. 5). To apply the staggered formulation of Ru and Aifantis’ theory, two sets of boundary
conditions were employed as follows. For the first step, the usual homogeneous essential
boundary conditions of classic elasticity were used to restore the symmetry of the problem.
In the second step, homogeneous natural boundary conditions were applied throughout, so
that n g 0
m , ij 2
ml σ = (where n is the outward normal to the boundary). The gradient elasticity
FE models used to determine the relevant stress states at the notch tips (Fig. 4a) were solved
by using an in-house FE code developed by the authors.
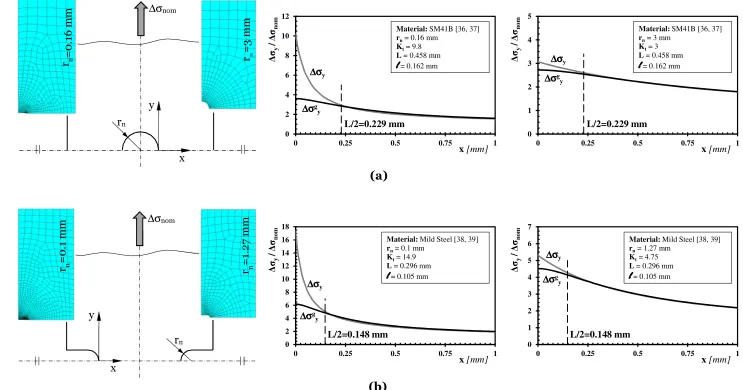
The charts of Figure 5 show some examples of the linear-elastic stress fields obtained by
using gradient elasticity according to the numerical procedure described in the previous
paragraph. In particular, the diagrams of Figure 5a were determined by considering CNP
specimens of SM41B [36, 37] with central hole having radius, rn, equal to 0.16 mm (Kt=9.8)
and 3 mm (Kt=3), respectively. The stress fields reported in Figure 5b were calculated
instead by modelling the DENP samples of mild steel [38, 39] with notch root radius, rn,
equal to 0.1 mm (Kt=14.9) as well as to 1.27 mm (Kt=4.75). In both cases length scale
parameter l was directly estimate from ∆σ0 and ∆Kth via Eq. (18). These four diagrams clearly
show gradient elasticity’s smoothing effect, this resulting in stress fields having, in the
vicinity of the notch tip, magnitude lover than the corresponding ones calculated according
At the beginning of the last century, Neuber [1] formulated his well-known notch fatigue
approach by taking as a starting point the idea that the stress in the vicinity of notches does
not reach values as high as those which are estimated by using classic continuum mechanics.
According to this intuition, he proposed to calculate a quantity representative of the real
stress states in the vicinity of the crack initiation locations by averaging the stress fields close
to the notch apices over materials units (that is, crystals or structural particles). In other
words, Neuber suggested calculating an effective stress to be used to design notched
components against high-cycle fatigue by considering finite volumes and not infinitesimal
volumes as postulated by classic continuum mechanics. The charts of Figure 5 make it
evident that gradient elasticity is a powerful numerical tool allowing Neuber’s idea to be
implemented efficiently, the size of the finite volumes used to determine the relevant stress
fields being related to characteristic length l.
The error diagram of Figure 6 summarises the overall accuracy which was obtained by using
gradient elasticity according to the procedure described in Figure 4a. This diagram makes it
evident that the estimates are characterised by an Eσ value falling mainly within an error
interval ranging between −10% and +30%. It is worth remembering here that the use of the
conventional TCD is seen to result in predictions falling within an error interval of ±20%
[48, 49]. This error level is considered to be acceptable since, in general, it is not possible to
distinguish between an error of ±20% and an error of 0% due to those problems which are
usually encountered during testing as well as during the numerical analyses [48]. Hence, it is
possible to state that, as the conventional TCD, the systematic usage of the proposed
approach resulted in predictions falling within an error range of 40%, with the average value
of the error itself being shifted by 10% toward the conservative side. In other words, gradient
elasticity employed according to the procedure summarised in Figure 4a is seen to result in
an overall accuracy characterised by the same absolute scattering as the one obtained by
As to the predictions summarised in Figure 6, it is worth pointing out here that these
estimates were obtained by using ∆σg0 as reference un-notched fatigue limit. Obviously,
under axial loading, the same level of accuracy would be reached by using ∆σ0 instead of ∆σ0g
, since in the absence of stress gradients g 0 σ
∆ is invariably equal to ∆σ0 (see Figure 3b).
Turning to the notched specimens tested under rotating bending, Table 1 shows that for
0.45C steel and 0.36C steel the difference between g 0 σ
∆ and ∆σ0 approaches 1%. This implies
that using ∆σ0 as reference plain fatigue limit to assess these notched samples would result
in the same overall level of accuracy as the one that was obtained by employing the
gradient-enriched fatigue limits, g 0 σ
∆ . This confirms that gradient elasticity can be safely used to
predict high-cycle fatigue strength by also employing the conventional un-notched fatigue
limit as reference material strength.
Multiaxial fatigue approach
After investigating the accuracy of the Mode I formalisation of the proposed approach, the
subsequent step was checking whether gradient elasticity applied along with the MWCM
(Fig. 4b) is successful also in estimating high-cycle fatigue strength under multiaxial fatigue
loading. The experimental results summarised in Table 2 were generated by testing shafts
with shoulder fillet (SSF) and circumferentially notched cylindrical bars (CNB) under
in-phase and out-of-in-phase fully-reversed bending (or tension) and torsion. In order to check its
accuracy in modelling the mean stress effect in fatigue, the proposed design approach was
also employed to estimate the high-cycle fatigue strength of the notched samples of both
S65A [47] and En3B [27] which were tested under biaxial cyclic loading with superimposed
static stresses. For the re-analysed experimental results, Table 2 summarises the relevant
material fatigue properties, the length of the assessed notch root radii, rn, the geometry of the
worth observing that they were estimated [23, 27] by following a procedure based on the
combined use of plain and notch fatigue limits [50].
Other than the results summarised in Table 2 and generated under multiaxial fatigue
loading, the accuracy of gradient elasticity applied in conjunction with the MWCM was also
checked against a number of experimental results generated by testing CNP and DENP
specimens under uniaxial loading (refer to Table 1). The goal of this validation exercise was
investigating whether this design approach is successful in taking into account the actual
degree of multiaxiality of the gradient-enriched stress fields.
The gradient-enriched stress tensors at the hot-spots (Fig. 4b) were determined via 2D and
3D gradient elasticity FE models solved by using our in-house code. In the CNP and DENP
samples, the gradient enriched stress distributions across the thickness were determined by
solving three-dimensional FE models done considering one eighth of the specimens. These
3D solutions were obtained by discretising the domain with 10-noded (quadratic)
tetrahedrons, a four-Gauss-point integration rule being employed to solve the two steps of
the numerical problem – i.e., Eq. (3) and Eq. (5), respectively. In the 3D models, the average
mesh size in the vicinity of the notch tips was equal to about 0.045 mm, with the minimum
size approaching 0.008 mm (Fig. 7).
Turning to the notched cylindrical samples, only half of the longitudinal section of the
investigated specimens was modelled by using under-integrated axisymmetric bi-quadratic
quadrilateral elements, the mesh in the vicinity of the assessed stress concentrators being
gradually refined until convergence occurred [13]. For these axisymmetric models the
average mesh size in the highly stressed regions was equal to 0.015 mm, the minimum size
being equal to about 0.001 mm (Fig. 8). As done for the Mode I loading specimens, also in
this case the boundary conditions were taken as homogeneous essential to calculate the first
step of the solution and homogeneous natural throughout to solve the second step of the
axisymmetric models, the total stress tensors at the hot-spots were determined for any
considered multiaxial loading case by simply using the superposition principle.
As to the notched specimens with shoulder fillet (SSF), the hot-spot was positioned, within
the fillet, in a material region close to the junction between the fillet itself and the net section
of the samples. This is in agreement with the cracking behaviour observed by Gough [47]. In
fact, nearly all the SSF samples he tested were seen to fail by a crack initiating at the junction
of the fillet with the central portion of the specimens or slightly removed from that region
and within the fillet.
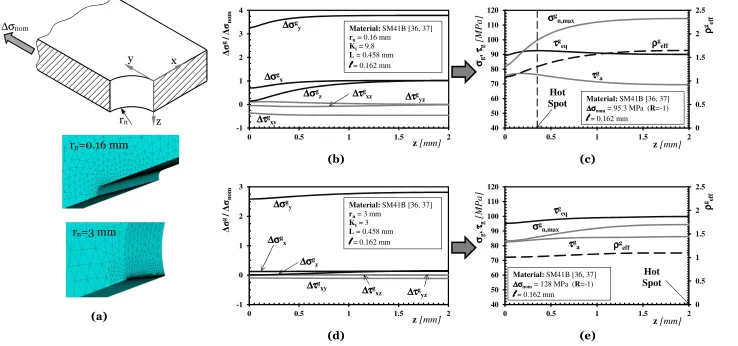
The diagrams reported in Figure 7 show the through-thickness distribution of the gradient
enriched stress components along the tip of the notch in the CNP specimens of SM41B [36,
37] loaded in cyclic tension-compression. The reported stress distributions (Figs 7b and 7d)
confirm that in three-dimensional bodies the gradient enriched stress states at the tip of the
notch (i.e., on the surface) are always multiaxial, even if the nominal loading being applied is
uniaxial. This a consequence of the fact that, as schematically shown in Figure 3a, gradient
elasticity acts as a numerical operator transferring the sub-surface stresses (which are, in the
most general case, triaxial) onto the surface. In terms of fatigue assessment, this results in
the fact that the hot-spots tend to move from the main surface toward the mid-section of the
specimens (i.e., along axis z in Figure 7a). These is confirmed by the charts reported in
Figures 7c and 7e: for the specimens with rn=0.16 mm the hot spot - i.e., the material point
experiencing the largest value of g eq
τ calculated according to Eq. (21) - is at a distance from
the main surface equal to 0.35 mm, whereas for the samples with rn=3 mm it is positioned at
the mid-section of the notched plate. A similar situation was also observed in the DENP
specimens.
The charts reported in Figure 8 show the stress distributions along the notch bisector in CNB
specimens loaded in bending, tension, and torsion. As to the stress analysis problem, it is
interesting to observe here that, according to the way gradient elasticity manipulates the
notch in a cylindrical bar loaded either in bending, in tension, or in torsion is always
multiaxial. In other words, in the investigated axisymmetric notched specimens, the
gradient-enriched stress fields acting on the material in the vicinity of the hot-spots were
always multiaxial, this holding true independently from the degree of multiaxiality
characterising the nominal load history.
After determining the relevant gradient-enriched stress tensors at the hot-spots (Fig. 4b), the
stress components relative to the critical plane (i.e., τga, σgn,m and g
a , n
σ ) were calculated by
using software Multi-FEAST (www.multi-feast.com). In particular, the amplitude of the
gradient-enriched shear stress relative to the critical plane was determined according to the
Maximum Variance Method [30, 31].
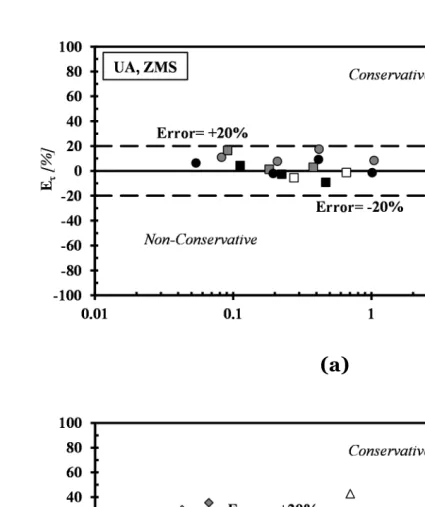
The error diagrams of Figure 9 summarise the overall accuracy which was obtained by using
gradient elasticity in conjunction with the MWCM to post-process the considered data sets,
with the error being defined as follows – see also Eq. (21):
100
τ τ τ
[%]
E g
0 g 0 g eq
τ ⋅
−
= (24)
According to definition (24), a positive value of this error index indicates a conservative
estimate, whereas a negative value a non-conservative prediction.
As to the accuracy of the proposed approach (Fig. 4b), attention was initially focussed on
those experimental results generated by testing CNP and DENP specimens under nominal
uniaxial fatigue loading. As mentioned earlier, for these specimens the relevant gradient
enriched stress fields were determined by solving 3D FE models. As shown in Figures 7c and
7e for two samples of SM41B [36, 37], the fatigue damage extent in CNP and DENP
specimens loaded in cyclic tension-compression was estimated by considering that material
point in the thickness experiencing the largest value of the equivalent shear stress amplitude,
g eq
τ , calculated according to Eq. (21). It is important to observe here that, to calculate g eq
the gradient enriched plain torsional fatigue limits, g 0
τ , were estimated from the
corresponding uniaxial ones according to von Mises’ hypothesis. The error diagram reported
in Figure 9a confirms that gradient elasticity applied along with the MWCM was successful
in assessing the high-cycle fatigue strength of CNP and DENP specimens, the estimates
falling within an error interval of ±20%.
Subsequently, attention was focussed on the experimental results generated by testing
notched cylindrical specimens under uniaxial fatigue loading (i.e., either bending or
tension-compression). The error chart of Figure 9b confirms that the use of the multiaxial
formulation of the proposed approach resulted in highly accurate estimates also when it was
employed to post-process the results from axisymmetric FE models. In particular, it is worth
observing that accurate predictions were made not only under fully-reversed (R=1) uniaxial
loading, but also in the presence of superimposed static stresses.
Turning to the torsional case, Figure 9b shows that the obtained estimates were, on average,
characterised by a slightly higher degree of conservatism. This can be explained by observing
that the TCD critical distance under torsion is seen to be larger than the corresponding value
determined under uniaxial loading [51, 52]. Therefore, since in the proposed approach
material characteristic length l is directly derived from the TCD critical distance, L,
determined under uniaxial fatigue loading, Eq. (18), the fact that under torsional loading the
systematic usage of the proposed approach resulted in estimates characterised by a certain
level of conservatism is not at all surprising.
As far as multiaxial load histories are concerned, the error chart of Figure 9b confirms that
the use of the proposed approach resulted in estimates mainly falling within an error interval
of ±20%, this holding true not only in the presence of out-of-phase loading, but also under
non-zero mean stresses.
As to the prediction reported in the charts of Figure 9b, it is possible to observe that they
were made by using σg0 and τ0g as reference fatigue strengths. Since, according to Table 2,
than about 6% (with the average value approaching 1.5%), it is evident that using σ0 and τ0
instead would result in an overall accuracy similar to the one which was obtained by
employing g 0
σ and g 0
τ . This further confirms that, in situations of practical interest, the
proposed multiaxial fatigue design approach can safely be used by simply employing σ0 and
τ0 as material reference strengths.
CONCLUSIONS
• Through the TCD’s critical distance L, the gradient elasticity length scale parameter l
can directly be estimated from the plain fatigue limit and the threshold value of the
stress intensity factor.
• Gradient elasticity allows high-cycle fatigue strength of notched components to be
assessed accurately by directly post-processing the gradient enriched stress states
determined, at the hot-spots, on the surface of the component being assessed.
• Under Mode I cyclic loading, the gradient-enriched hot spot stress perpendicular to
the notch bisector can directly be used to estimate the extent of damage in the
high-cycle fatigue regime.
• Gradient elasticity applied along with the MWCM is highly accurate in estimating
high-cycle fatigue strength of notched components subjected to both uniaxial and
multiaxial fatigue loading.
• Further research is required in this area to extend the use of the proposed
methodology to the finite lifetime regime.
Acknowledgements
3DS Dassault Systems (www.3ds.com) is acknowledged for fully supporting the present
REFERENCES
[1] H. Neuber. Theory of notch stresses: principles for exact calculation of strength with reference to structural form and material. Springer Verlag, Berlin, 1958.
[2] R. E. Peterson. Notch-sensitivity. In G. Sines and J. L. Waisman, editors, Metal Fatigue, pages 293–306. McGraw Hill, New York, 1958.
[3] D. Taylor. The Theory of Critical Distances: A New Perspective in Fracture Mechanics. Elsevier, Oxford, UK, 2007.
[4] C. Q. Ru and E. C. Aifantis. A simple approach to solve boundary-value problems in gradient elasticity. Acta Mechanica, 101:59–68, 1993. doi: 10.1007/BF01175597.
[5] H. Askes, P. Livieri, L. Susmel, D. Taylor, and R. Tovo. Intrinsic material length, Theory of Critical Distances and Gradient Mechanics: analo¬gies and differences in processing linear-elastic crack tip stress fields. Fa¬tigue Fract. Engng. Mater. Struct., 36:39–55, 2012.
[6] L. Susmel, H. Askes, T. Bennett, and D. Taylor. Theory of Critical Distances versus Gradient Mechanics in modelling the transition from the short to long crack regime at the fatigue limit. Fatigue Fract. Engng. Mater. Struct., 36:861–869, 2013.
[7] Askes, H., Livieri, P., Susmel, L., Taylor, D., Tovo R. Intrinsic material length, Theory of Critical Distances and Gradient Mechanics: analogies and differences in processing linear-elastic crack tip stress fields. Fatigue Fract Engng Mater Struct. 36, pp. 39-55, 2013.
[8] Tovo R, Livieri P. An implicit gradient application to fatigue of sharp notches and weldments. Engng Frac Mech 2007;74 4:515-526.
[9] Livieri P, Tovo R. The effect of throat underflushing on the fatigue strength of fillet weldments. Fatigue Fract Engng Mater Struct 2013;36 9:884-892.
[10] E. C. Aifantis. On the role of gradients in the localization of deformation and fracture. Int. J. Eng. Sci., 30(10):1279–1299, 1992. doi: 10.1016/0020-7225(92)90141-3.
[11] S.B. Altan and E. C. Aifantis. On the structure of the mode III crack-tip in gradient elasticity. Scripta Metallurgica et Materialia, 26:319–324, 1992.
[12] C. Bagni and H. Askes. Unified finite element methodology for gradient elasticity. Computers and Structures, 160:100–110, 2015. doi: 10.1016/j.compstruc.2015.08.008.
[13] Bagni, C., Askes, H., Susmel L. Finite element technology for gradient elastic fracture mechanics. Procedia Materials Science 3, pp. 2042-2047, 2014.
[14] H. Askes, I. Morata, and E. C. Aifantis. Finite element analysis with staggered gradient elasticity. Comput. Struct., 86:1266–1279, 2008.
[15] H. Askes and E. C. Aifantis. Gradient elasticity in statics and dynamics: An overview of formulations, length scale identification procedures, finite element implementations and new results. Int. J. Solids Struct., 48(13): 1962–1990, 2011.
[16] H. Askes and I. Gitman. Non-singular stresses in gradient elasticity at bi-material interface with transverse crack. Int. J. Fract., 156:217–222, 2009.
[17] D. Taylor. Geometrical effects in fatigue: a unifying theoretical model. Int. J. Fatigue, 21:413–420, 1999. doi: 10.1016/S0142-1123(99)00007-9.
[18] El Haddad MH, Topper TH, Smith KN. Fatigue crack propagation of short cracks. J. Engng. Mater. Tech. (ASME Trans.) 1979;101:42-45.
[20] Sheppard SD. Field effects in fatigue crack initiation: long life fatigue strength. Trans. ASME. Journal of Mechanical Design 1991;113:188-194.
[21] Susmel, L., Multiaxial Notch Fatigue: from nominal to local stress-strain quantities. Woodhead & CRC, Cambridge, UK, ISBN: 1 84569 582 8, March 2009.
[22] Susmel, L., Taylor, D., Can the conventional High-Cycle Multiaxial Fatigue Criteria be re-interpreted in terms of the Theory of Critical Distances? Structural Durability & Health Monitoring, Vol. 2, No. 2, pp. 91-108, 2006.
[23] L. Susmel. A unifying approach to estimate the high-cycle fatigue strength of notched components subjected to both uniaxial and multiaxial cyclic loadings. Fatigue & Fracture of Engineering Materials & Structures, 27(5):391–411, 2004.
[24] Susmel, L., Taylor, D., Two methods for predicting the multiaxial fatigue limits of sharp notches. Fatigue Fract. Engng. Mater. Struct. 26, pp. 821-833, 2003.
[25] Susmel, L., Lazzarin, P., A Bi-Parametric Modified Wöhler Curve for High Cycle Multiaxial Fatigue Assessment. Fatigue Fract. Engng. Mater. Struct., Vol. 25, pp. 63-78, 2002.
[26] Susmel, L., Multiaxial Fatigue Limits and Material Sensitivity to Non-Zero Mean Stresses Normal to the Critical Planes. Fatigue Fract Engng Mater Struct 31, pp. 295-309, 2008.
[27] Susmel, L., Taylor, D. (2008) The Modified Wöhler Curve Method applied along with the Theory of Critical Distances to estimate finite life of notched components subjected to complex multiaxial loading paths. Fatigue & Fracture of Engineering Materials & Structures 31 12, pp. 1047-1064.
[28] Susmel, L., Tovo, R., Lazzarin, P. (2005) The mean stress effect on the high-cycle fatigue strength from a multiaxial fatigue point of view. International Journal of Fatigue 27, pp. 928-943.
[29] Kaufman, R. P., Topper T. (2003) The influence of static mean stresses applied normal to the maximum shear planes in multiaxial fatigue. In: Biaxial and Multiaxial fatigue and Fracture, Edited by A. Carpinteri, M. de Freitas and A. Spagnoli, Elsevier and ESIS, pp. 123-143.
[30] Susmel L., A simple and efficient numerical algorithm to determine the orientation of the critical plane in multiaxial fatigue problems. International Journal of Fatigue 32, pp. 1875–1883, 2010.
[31] Susmel, L., Tovo, R., Socie, D. F. Estimating the orientation of Stage I crack paths through the direction of maximum variance of the resolved shear stress. Int J Fatigue 58, pp. 94–101, 2014.
[32] Jadallah, O., Bagni, C., Askes, H., Susmel, L. Microstructural length scale parameters to model the high-cycle fatigue behaviour of notched plain concrete. International Journal of Fatigue, 82, pp. 708-720, 2016.
[33] B. Aztori, P. Lazzarin, and G. Meneghetti. Fracture mechanics and notch sensitivity. Fatigue Fract. Engng. Mater. Struct., 26:257–267, 2003.
[34] DuQuesnay D. L., Yu M., Topper T.H. (1988) An analysis of notch size effect on the fatigue limit. J. Testing Eval. 4, 375-385.
[35] El Haddad M. H. (1978) A study of the growth of short fatigue cracks based on fracture mechanics. Ph. D. Thesis, University of Waterloo, Waterloo, Ontario, 1978.
[37] Tanaka K., Akiniwa Y. (1987) Notch geometry effect on propagation threshold of short fatigue cracks in notched components. In: Fatigue '87, Vol. II, Edited by R. O. Ritchie and E. A. Starke Jr., 3th Int. Conf. on Fatigue and Fracture Thresholds, 739-748.
[38] Frost N. E. (1957) A relation between the critical alternating propagation stress and crack length for mild steel. In: Proc. Inst. Mech. Engrs., 173, 811-834.
[39] Harkegard G. (1981) An effective stress intensity factor and the determination of the notched fatigue limit. In: Fatigue Thresholds: Fundamentals and Engineering Applications, Vol. II (Ed. by J. Backlund, A. F. Blom and C. J. Beevers), Chameleon Press Ltd, London, 867-879.
[40] Frost N. E. (1957) Non-Propagating Cracks in Vee-Notched Specimens Subjected to Fatigue loadings. The Aeronautical Quarterly VIII, 1-20.
[41] Lukas, P., Kunz, L., Weiss, B., Stickler, R. (1986) Non-damaging notches in fatigue. Fatigue Fract. Engng Mater. Struct. 9, 195-204.
[42] Ting, J. C. and Lawrence, F. V. (1993) A crack closure model for predicting the threshold stresses of notches. Fatigue Fract. Engng Mater. Struct. 16, 93-114.
[43] Harkegard, G. (1981) An effective stress intensity factor andthe determination of the notched fatigue limit. In: Fatigue Thresholds: Fundamentals and Engineering Applications, Vol.II (Edited by J. Backlund, A. F. Blom and C. J. Beevers) Chameleon Press Ltd, London. pp. 867-879.
[44] Nisitani, H. and Endo, M. (1988) Unified treatment of deep and shallow notches in rotating bending fatigue. In: Basic Questions in Fatigue, Vol. I, ASTM STP 924, pp. 136-153.
[45] Kurath P., Downing S. D., Galliart D. R. (1989) Summary of Non-Hardened Notched Shaft Round Robin Program. In: Multiaxial Fatigue, Edited by G. E. Leese and D. F. Socie. Society of Automotive Engineers, AE-14, 13-32.
[46] Sonsino C. M. (1994) Fatigue Behaviour of Welded Components Under Complex Elasto-Plastic Multiaxial Deformation, LBF-Bericht, Nr. 6078.
[47] Gough H. J. (1949) Engineering Steels under Combined Cyclic and Static Stresses. In: Proc. Inst. Mech. Engrs. 160, 417-440.
[48] Taylor, D., Wang, G. (2000) The validation of some methods of notch fatigue analysis. Fatigue & Fracture of Engineering Materials & Structures 23, pp. 387–394.
[49] Susmel, L., Taylor, D. (2003) Fatigue Design in the Presence of Stress Concentrations. International Journal of Strain Analysis for Engineering Components 38 5, pp. 443-452.
[50] L. Susmel and D. Taylor. The Theory of Critical Distances as an alternative experimental strategy for the determination of KIC and ΔKth. Engineering Fracture Mechanics, 77:1492– 1501, 2010. doi: 10.1016/j.engfracmech.2010.04.016.
[51] L. Susmel, D. Taylor. A simplified approach to apply the theory of critical distances to notched components under torsional fatigue loading. Int J Fatigue, 28 (2006), pp. 417–430.
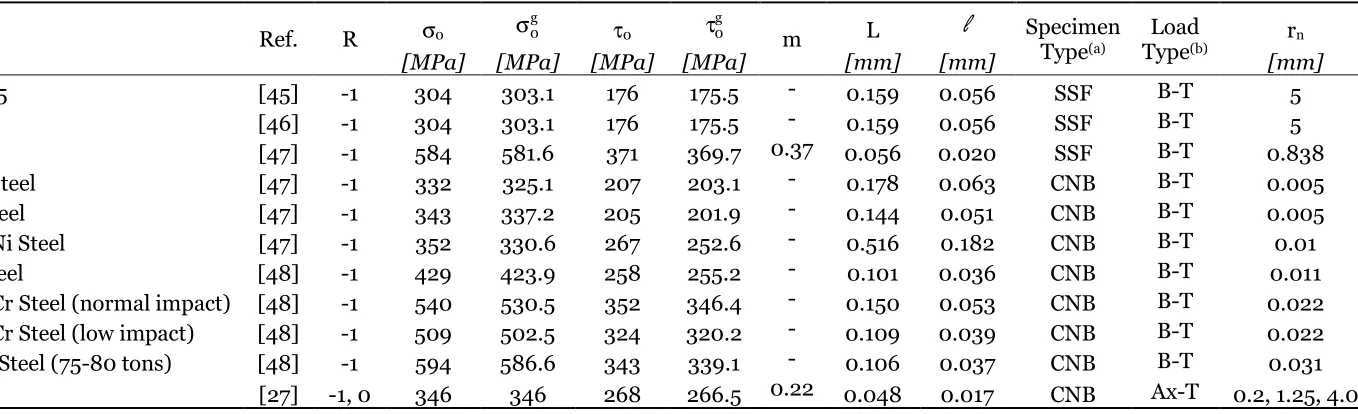
Table 2. Summary of the experimental results generated under multiaxial fatigue loading
Figure 1. Different formalisations of the Theory of Critical Distances under Mode I fatigue loading.
Figure 2. Modified Wöhler curves (a), the τA,Ref vs. ρeff diagram (b) and in-field use of the
MWCM applied along with the PM to estimate notch fatigue limits (c).
Figure 3. Gradient-enriched notch tip stress vs. PM effective stress (a); conventional and gradient-enriched un-notched fatigue (endurance) limits under cyclic axial loading (b), cyclic bending (c) and cyclic torsion (d).
Figure 4. In-field use of gradient elasticity to estimate notch fatigue (endurance) limits.
Figure 5. Stress distributions along the notch bisector in CNP (a) and DENP (d) specimens subjected to cyclic axial loading.
Figure 6. Accuracy of the proposed design method (Fig. 4a) in estimating high-cycle fatigue strength of notched specimens subjected to fully-reversed Mode I cyclic loading.
Figure 7. Stress distributions along the notch edge in CNP specimens subjected to cyclic axial loading.
Figure 8. Stress distributions along the notch bisector in CNB specimens loaded in bending, tension, and torsion.
Material Ref. R
Type(a) Type(b)
[MPa] [MPa] [MPa] [mm] [mm] [mm]
SAE 1045 [34] -1 608 608 13.6 0.159 0.056 CNP Ax 0.12-2.5
Al 2024-T351 [34] -1 248 248 5.0 0.129 0.046 CNP Ax 0.12-1.5
G40.11 [35] -1 464 464 15.9 0.374 0.132 CNP Ax 0.2-4.8
SM41B [36, 37] -1 326 326 12.4 0.458 0.162 CNP Ax 0.16-3.0
Mild Steel [38, 39] -1 420 420 12.8 0.296 0.105 DENP/CNB Ax 0.05-7.62
NiCr Steel [40] -1 1000 1000 12.8 0.085 0.030 CNB Ax 0.05-0.13
Steel 15313 [41] -1 440 440 12.0 0.237 0.084 CNB Ax 0.03-0.76
AISI 304 [42, 43] -1 720 720 12.0 0.110 0.039 CNB Ax 0.04
0.45 C Steel [44] -1 582 575.5 8.1 0.061 0.022 CNB RB 0.01-0.6
0.36 C Steel [44] -1 446 442 7.6 0.092 0.033 CNB RB 0.2
(a)CNP=Center Notch in flat Plate; DENP=Double Edge Notch in flat Plate; CNB=Circumferential Notch in cylindrical Bar (b)Ax=Axial loading; RB=Rotating Bending
Type Type
[MPa] [MPa] [MPa] [MPa] [mm] [mm] [mm]
SAE 1045 [45] -1 304 303.1 176 175.5 - 0.159 0.056 SSF B-T 5
Ck 45 [46] -1 304 303.1 176 175.5 - 0.159 0.056 SSF B-T 5
S65A [47] -1 584 581.6 371 369.7 0.37 0.056 0.020 SSF B-T 0.838
0.4% C Steel [47] -1 332 325.1 207 203.1 - 0.178 0.063 CNB B-T 0.005
3% Ni Steel [47] -1 343 337.2 205 201.9 - 0.144 0.051 CNB B-T 0.005
3/3.5% Ni Steel [47] -1 352 330.6 267 252.6 - 0.516 0.182 CNB B-T 0.01
Cr-Va Steel [48] -1 429 423.9 258 255.2 - 0.101 0.036 CNB B-T 0.011
3.5% NiCr Steel (normal impact) [48] -1 540 530.5 352 346.4 - 0.150 0.053 CNB B-T 0.022 3.5% NiCr Steel (low impact) [48] -1 509 502.5 324 320.2 - 0.109 0.039 CNB B-T 0.022
NiCrMo Steel (75-80 tons) [48] -1 594 586.6 343 339.1 - 0.106 0.037 CNB B-T 0.031
En3B [27] -1, 0 346 346 268 266.5 0.22 0.048 0.017 CNB Ax-T 0.2, 1.25, 4.0
[image:33.842.95.774.81.288.2](a)SSF=cylindrical Shaft with Shoulder Fillet; CNB=Circumferential Notch in cylindrical Bar (b)Ax=Axial loading; B=Bending; T=Torsion
Figure 1. Different formalisations of the Theory of Critical Distances under Mode I fatigue loading.