Do subglacial bedforms comprise a size and shape continuum?
Jeremy C. Ely
a,⁎
, Chris D. Clark
a, Matteo Spagnolo
b, Chris R. Stokes
c, Sarah L. Greenwood
d, Anna L.C. Hughes
e,
Paul Dunlop
f, Dale Hess
ga
Department of Geography, University of Sheffield, Sheffield S10 2TN, UK b
School of Geosciences, University of Aberdeen, Aberdeen AB24 3UF, UK c
Department of Geography, Durham University, Durham DH1 3LE, UK d
Department of Geological Sciences, Stockholm University, Stockholm SE-106 91, Sweden e
Department of Earth Science, University of Bergen and Bjerknes Centre for Climate Research, Bergen N-5020, Norway fSchool of Geography and Environmental Sciences, Ulster University, Coleraine BT52 1SA, UK
g
Department of Earth and Environmental Sciences, The University of Rochester, Rochester, NY 14627, United States
a b s t r a c t
a r t i c l e i n f o
Article history:
Received 14 September 2015 Received in revised form 1 January 2016 Accepted 5 January 2016
Available online 6 January 2016
Understanding the evolution of the ice-bed interface is fundamentally important for gaining insight into the dy-namics of ice masses and how subglacial landforms are created. However, the formation of the suite of landforms generated at this boundary—subglacial bedforms—is a contentious issue that is yet to be fully resolved. Bedforms formed in aeolian,fluvial, and marine environments either belong to separate morphological popula-tions or are thought to represent a continuum of forms generated by the same governing processes. For subglacial bedforms, a size and shape continuum has been hypothesised, yet it has not been fully tested. Here we analyse the largest data set of subglacial bedform size and shape measurements ever collated (96,900 bedforms). Our re-sults show thatflutes form a distinct population of narrow bedforms. However, no clear distinction was found between drumlins and megascale glacial lineations (MSGLs), which form a continuum of subglacial lineations. A continuum of subglacial ribs also exists, with no clear size or shape distinctions indicating separate populations. Furthermore, an underreported class of bedform with no clear orientation to iceflow (quasi-circular bedforms) overlaps with the ribbed and lineation continua and typically occurs in spatial transition zones between the two, potentially merging these three bedform types into a larger continuum.
Crown Copyright © 2016 Published by Elsevier B.V. This is an open access article under the CC BY license (http://creativecommons.org/licenses/by/4.0/). Keywords:
Subglacial bedforms Drumlins Ribbed moraine Flutes
1. Introduction
The interface between moving water, air, or ice and unconsolidated sediment is often populated by undulating landforms, collectively re-ferred to as bedforms (e.g.,Allen, 1968; Wilson, 1973; Aario, 1977; Rose and Letzer, 1977). Rather than being individuals, bedforms com-monly occur in swathes orfields: configurations which cover large por-tions of Earth's deserts, river beds, and oceanfloors (e.g.,Costello and Southard, 1981; Amos and King, 1984; Carling, 1999), as well as the sur-faces of extraterrestrial bodies (Cutts and Smith, 1973; Kargel and Strom, 1992; Radebaugh et al., 2008). The abundance of subglacial bedforms on deglaciated terrain (e.g.,Aylsworth and Shilts, 1989; Ottesen et al., 2005; Greenwood and Clark, 2008; Larter et al., 2009; Trommelen and Ross, 2010; McHenry and Dunlop, 2015), their emer-gence from receding ice margins (Johnson et al., 2010), and their repeat-ed detection by geophysical surveys of contemporary ice-sheet brepeat-eds (Rooney et al., 1987; Smith et al., 2007; King et al., 2009) indicates that they are a key component of the subglacial environment, where
processes that regulate iceflow occur (Alley et al., 1986; Engelhardt and Kamb, 1998; Kleman and Glasser, 2007). Elucidating the genesis of subglacial bedforms is an important goal in geomorphology and for understanding ice dynamics.
In addition to their composition, the morphological properties of bedforms provide constraints for hypotheses and models of their forma-tion (e.g.,Jackson, 1975; Clark et al., 2009; Worman et al., 2013). Fluvial, aeolian, and marine bedforms can form distinct, often hierarchical, pop-ulations (Allen, 1968). In deserts, for example, discrete poppop-ulations of bedforms are found, increasing in size from ripples to dunes then draas (Wilson, 1973; Lancaster, 1988). Conversely, bedforms can also belong to populations within which there are no clear size distinctions, forming size and shape continua [e.g., aeolian ripples (Ellwood et al., 1975), aeolian dunes (Lancaster, 2013, p. 159), and subaqueous dunes (Ashley, 1990)]. For flutes, drumlins, megascale glacial lineations (MSGLs), and ribbed moraines, whether they form separate distinct morphological populations or form a single continuous size and shape population with no natural breaks (i.e., a size and shape continuum) is unclear.
Subglacial bedforms are often subdivided and named on the basis of perceived distinctions in scale and morphology. Commonly, subglacial ⁎ Corresponding author.
E-mail address:j.ely@sheffield.ac.uk(J.C. Ely).
http://dx.doi.org/10.1016/j.geomorph.2016.01.001
0169-555X/Crown Copyright © 2016 Published by Elsevier B.V. This is an open access article under the CC BY license (http://creativecommons.org/licenses/by/4.0/). Contents lists available atScienceDirect
Geomorphology
bedforms that form aligned with ice-flow direction are divided into drumlins, MSGLs, and flutes (Fig. 1); whilst ribbed moraines and megaribs form transverse toflow direction (Fig. 1;Greenwood and Kleman, 2010; Klages et al., 2013). Quasi-circular bedforms, which have no clear orientation to ice-flow direction, are less frequently stud-ied but have been previously noted (Hill, 1973; Markgren and Lassila, 1980; Bouchard, 1989; Smith and Wise, 2007; Greenwood and Clark, 2008). Beyond this, a wealth of further nomenclature exists (e.g., megaflutes,fluting, megadrumlins, and minor ribbed, Blatnick, Rogen, and Niemsel moraines).
Despite the array of terms applied to the varieties comprising sub-glacial bedforms, a long-standing hypothesis is that they actually belong to a continuum of size and shape (Aario, 1977; Rose and Letzer, 1977; Rose, 1987). This‘continuum hypothesis’was originally based upon ob-servations of spatial transitions between subglacial bedform types and orientations along the direction of iceflow, suggesting a single continu-um of form stretching from ribbed moraine, through quasi-circular forms, to drumlins (Aario, 1977; Markgren and Lassila, 1980; Punkari, 1984). However, subsequent work on the continuum hypothesis has fo-cussed solely uponflow-aligned subglacial bedforms (e.g.,Rose, 1987; Stokes et al., 2013b). Furthermore, the relatively recent discovery of ‘megascale’ subglacial bedforms (Clark, 1993; Greenwood and Kleman, 2010) might imply a distinct variety of bedform rather than end-members of a continuum. Morphological studies often focus upon previously labelled categories of subglacial bedforms [e.g. drumlins in Clark et al. (2009)andMaclachlan and Eyles (2013); ribbed moraines in Hättestrand (1997) and Dunlop and Clark (2006b); MSGL in Spagnolo et al. (2014a)]. A comprehensive study that looks at all land-form types together to compare and contrast their size and shape is missing. Here, we present and analyse a data set of 96,900 size and shape measurements of subglacial bedforms from numerous locations, spanning the range of types in the literature, in order to investigate whether there is a continuum of subglacial bedforms or whether sepa-rate size and shape populations exist. Note that we do not consider bedforms composed purely of bedrock (e.g., whalebacks, roche moutonnées, megagrooves), nor do we consider hybrid forms such as crag and tails, as they are often regarded as different from subglacial
bedforms created in sediment (e.g.,Dionne, 1987; Stokes et al., 2011; Lane et al., 2015).
2. Data and methods
2.1. Data
A database of 96,900 mapped subglacial bedforms was compiled from previous studies and additional mapping, which was conducted using standard remote sensing techniques (Table 1). A variety of report-ed breport-edform morphologies from a wide range of sites were chosen from the literature (Fig. 2;Table 1). Mapped bedforms were grouped by local-ity and reported type (i.e., as reported in previous studies) so that fur-ther analysis could ascertain the similarities or differences between these types. At each location, the highest resolution remote sensing data available were used to map and derive landforms metrics (Table 2). Only data with resolution higher than 30 m were used, as measurements of bedform length and width derived from coarser reso-lution data have been shown to misrepresent subglacial bedform size and shape (Napieralski and Nalepa, 2010). Each bedform is represented in our data set as a smooth polygon, manually digitised directly into a geographic information system (GIS) around the break of slope on hill-shaded digital elevation models illuminated from multiple direc-tions (Smith and Clark, 2005; Hughes et al., 2010). On satellite imagery, landforms are detectable as a change in vegetation and/or soil moisture (e.g.,Spagnolo et al., 2014a). Automated mapping techniques (e.g.,Saha et al., 2011; Maclachlan and Eyles, 2013) were avoided as they require predefinition of parameters such as shape and scale and thus would in-troduce bias into our results.
2.2. Methods
[image:2.595.139.466.452.693.2]The length (L) and width (W) of each mapped polygon was esti-mated via Euler's approximation for an ellipse (Clark et al., 2009). A limitation of this approximation is that it slightly underestimates the length (and overestimates the width) of highly elongate or irreg-ular polygons, but this error is insignificant compared to the size of
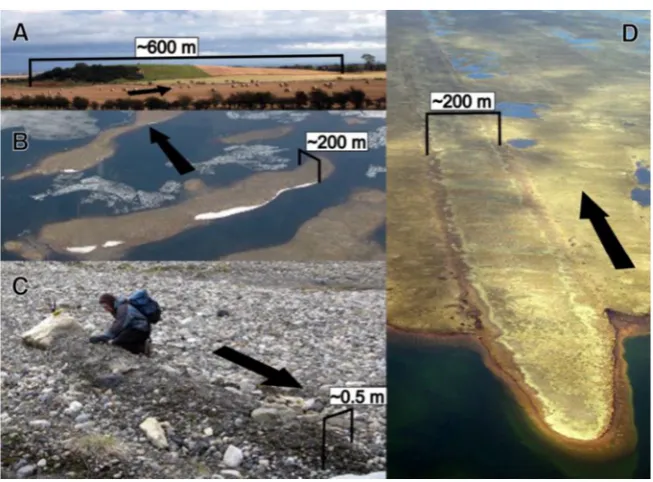
Fig. 1.Different types of subglacial bedform and their orientation to ice-flow direction (denoted by black arrow). Scales are approximate. (A) A drumlin in NE England. These streamlined hills are typically 250–1000 m along-flow and 120–300 m across-flow (Clark et al., 2009). (B) Transverse ridges, termed ribbed moraine, in Nunavut, Canada, typically 300–1200 m across-flow and 150–300 m along-flow (Hättestrand and Kleman, 1999). (C) Aflute formed parallel to ice-flow direction, Svalbard. Note the accumulation of sediment in the lee of a boulder. (D) A MSGL in Nunavut, Canada. MSGLs typically are 100–200 m across-flow and 1–9 km along-flow (Spagnolo et al., 2014a) but have been reported to be much longer (e.g., 180 km, Andreassen et al., 2008). All photographs fromwww.shef.ac.uk/drumlins.
the bedforms (Clark et al., 2009) and typically is less than 3%. These polygon measurements were then converted intoa-axis (dis-tance down-ice) andb-axis (distance across-ice) measurements ac-cording to bedform orientation to iceflow (Fig. 3). For near-circular bedforms, bedforma-axis andb-axis were manually measured with-in a GIS uswith-ing regional ice-flow patterns as an indicator offlow align-ment (Fig. 3). Elongation ratio, often used as a proxy for shape (e.g.,Rose, 1987; Clark et al., 2009; Dowling et al., 2015), was simply measured asa-axis divided byb-axis.
Testing the subglacial bedform continuum hypothesis requires the detection and definition of populations within our data set. If the variously-named types of bedforms are found to vary continuously in size and shape such that, for example, a large drumlin is the same as a small MSGL, then a size and shape continuum between them exists (Fig. 4A and B). When plotted on a scatter graph, this would show a sin-gle continuous data cloud, or cluster (Fig. 4B). On the contrary, if the de-rived metrics reveal gaps or jumps in scale or shape then they are better interpreted as discrete phenomena (Fig. 4C and D), leading to the rejec-tion of the continuum hypothesis. In this case, a scatter graph of bedform metrics would show several distinct clusters (Fig. 4D). Several
approaches are taken here to assess the degree to which separate pop-ulations, or clusters, can be detected within our data set.
[image:3.595.38.552.82.518.2]The human eye is an excellent tool for detecting clusters (Jain, 2010). As such, ourfirst attempt at detecting clusters in our data set was to plot the data and visually assess clustering qualitatively. That said, different interpreters may see different clusters. Thus, in an effort to make our analysis more objective and quantitative we employed the density-based clustering algorithm DBSCAN (Ester et al., 1996) using the pack-age‘fpc’in R statistical software. No clustering algorithm or technique is perfect because no objective definition of a cluster exists (Estivill-Castro, 2002). However, DBSCAN was chosen as it requires no predefinition of the number of expected clusters within a data set; hence it requires no prior categorisation of bedforms into separate pop-ulations. The algorithm requires two input parameters: the window size (Ɛ) and the minimum number of points within a cluster (MinPts). In order to define dense regions (clusters) within a point cloud, DBSCAN creates a window at each point and determines which points are suffi -ciently reachable from each other in order to warrant definition as a cluster (Ester et al., 1996). Core points are deemed reachable if there are more thanMinPtswithin the search radius ofƐfrom that point,
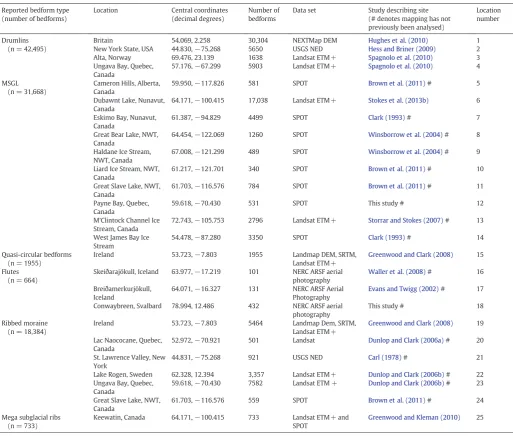
Table 1
Location of mapped subglacial bedforms; all bedforms have previously been described in the literature. Where mapping was not available from the original study a‘#’denotes that further mapping was conducted at a previously described site.
Reported bedform type (number of bedforms)
Location Central coordinates (decimal degrees)
Number of bedforms
Data set Study describing site (# denotes mapping has not previously been analysed)
Location number
Drumlins (n = 42,495)
Britain 54.069, 2.258 30,304 NEXTMap DEM Hughes et al. (2010) 1
New York State, USA 44.830,−75.268 5650 USGS NED Hess and Briner (2009) 2 Alta, Norway 69.476, 23.139 1638 Landsat ETM+ Spagnolo et al. (2010) 3 Ungava Bay, Quebec,
Canada
57.176,−67.299 5903 Landsat ETM+ Spagnolo et al. (2010) 4
MSGL (n = 31,668)
Cameron Hills, Alberta, Canada
59.950,−117.826 581 SPOT Brown et al. (2011)# 5
Dubawnt Lake, Nunavut, Canada
64.171,−100.415 17,038 Landsat ETM+ Stokes et al. (2013b) 6
Eskimo Bay, Nunavut, Canada
61.387,−94.829 4499 SPOT Clark (1993)# 7
Great Bear Lake, NWT, Canada
64.454,−122.069 1260 SPOT Winsborrow et al. (2004)# 8
Haldane Ice Stream, NWT, Canada
67.008,−121.299 489 SPOT Winsborrow et al. (2004)# 9
Liard Ice Stream, NWT, Canada
61.217,−121.701 340 SPOT Brown et al. (2011)# 10
Great Slave Lake, NWT, Canada
61.703,−116.576 784 SPOT Brown et al. (2011)# 11
Payne Bay, Quebec, Canada
59.618,−70.430 531 SPOT This study # 12
M'Clintock Channel Ice Stream, Canada
72.743,−105.753 2796 Landsat ETM+ Storrar and Stokes (2007)# 13
West James Bay Ice Stream
54.478,−87.280 3350 SPOT Clark (1993)# 14
Quasi-circular bedforms (n = 1955)
Ireland 53.723,−7.803 1955 Landmap DEM, SRTM, Landsat ETM+
Greenwood and Clark (2008) 15
Flutes (n = 664)
Skeiðarajökull, Iceland 63.977,−17.219 101 NERC ARSF aerial photography
Waller et al. (2008)# 16
Breiðamerkurjökull, Iceland
64.071,−16.327 131 NERC ARSF Aerial Photography
Evans and Twigg (2002)# 17
Conwaybreen, Svalbard 78.994, 12.486 432 NERC ARSF aerial photography
This study # 18
Ribbed moraine (n = 18,384)
Ireland 53.723,−7.803 5464 Landmap Dem, SRTM, Landsat ETM+
Greenwood and Clark (2008) 19
Lac Naococane, Quebec, Canada
52.972,−70.921 501 Landsat Dunlop and Clark (2006a)# 20
St. Lawrence Valley, New York
44.831,−75.268 921 USGS NED Carl (1978)# 21
Lake Rogen, Sweden 62.328, 12.394 3,357 Landsat ETM+ Dunlop and Clark (2006b)# 22 Ungava Bay, Quebec,
Canada
59.618,−70.430 7582 Landsat ETM + Dunlop and Clark (2006b)# 23
Great Slave Lake, NWT, Canada
61.703,−116.576 559 SPOT Brown et al. (2011)# 24
Mega subglacial ribs (n = 733)
Keewatin, Canada 64.171,−100.415 733 Landsat ETM+ and SPOT
and are included within the cluster owing to point density. Additionally, points are also deemed cohesive with the cluster if a core point is within the radius ofƐ. If neither of these criteria are met, the point is deemed to be outside of the cluster or is left unclustered. Sensitivity analysis of cluster-definition to window size (Ɛ) was run fromƐ= 1.0 toƐ= 0.01 with steps ofƐ= 0.01. The sensitivity of minimum points per clus-ter (MinPts) was also tested at values of 10, 50, and 100. The DBSCAN procedure was only conducted on the independent variables of length and width, elongation being derived from the two.
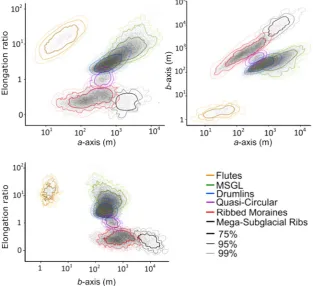
A second approach based on a direct, visual assessment of the degree of overlap between assigned bedform category metrics was also applied (Table 1). In covariance plots of the measured variables (e.g., length vs. width), the density of observations per category were calculated and contoured. Here, the highest density contour contained 75% of the ob-servations, the middle 95%, and the lowest 99%. The degree of overlap between adjacent categories was then evaluated in order to test the va-lidity of frequently used bedform nomenclature.
3. Results
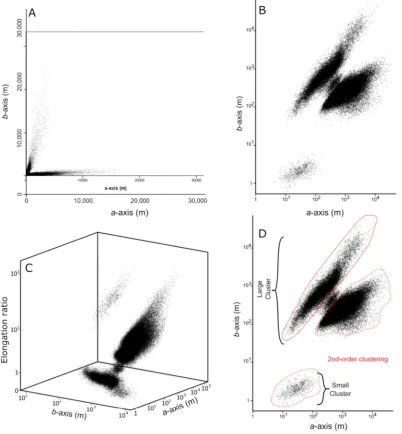
The size and shape of all 96,900 subglacial bedforms in our data set are displayed inFig. 5. The most striking aspect is that data are concen-trated into a narrow range of values. When plotted on linear axes
(Fig. 5A), there appears to be two clouds of data which merge toward the origin of the plot. Larger bedforms (N10,000 m) are less frequent in our data set, but plot as extensions of the same data clouds rather than forming separate clusters. Due to the skew imposed by these large values, data was also plotted on a logarithmic scale (Fig. 5B–D). Atfirst order, two clusters of data are visually discernible: a small cloud of narrow and elongate bedforms aligned withflow direction, and a much larger cloud comprising the remaining bedforms (Fig. 5D). Within this larger cloud, density variations occur, perhaps recording three populations that (in places) merge and overlap, or maybe this is a single cluster that has been incompletely sampled. Within the larger cloud, these subclusters exhibit ellipsoid scatters with apparent trends (red ellipses inFig. 5D), with bedforms with a largera-axis thanb-axis following a separate trajectory to transverse bedforms. Bedforms with no clear orientation (i.e., circular) fall between these two groups.
[image:4.595.133.475.52.357.2]To assess the degree to which separate populations are quantitative-ly distinctive, the density-based clustering algorithm (DBSCAN) was used with an extensive sensitivity analysis (results are summarised in Fig. 6). At the extremes of the window size parameter (Ɛ), the algorithm groups the data into inappropriately sized clusters. WhenƐis large, the window size is such that the whole data set is seen as a single cluster (Fig. 5A). WhenƐis small, either numerous small clusters or no clusters at all are detected because of an insufficient search radius (Fig. 6O). The
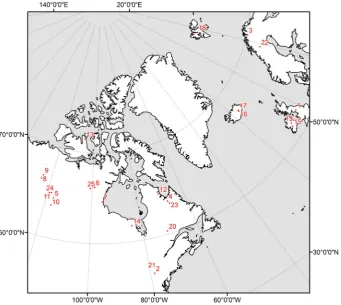
[image:4.595.42.561.666.744.2]Fig. 2.Location of mapped subglacial bedforms. Numbers refer toTable 1.
Table 2
Data type and source for the mapping described inTable 1.
Data set Type of data Horizontal resolution (m) Source
NEXTMap Great Britain™ DEM 5 http://arsf.nerc.ac.uk/
USGS NED DEM 10 m http://ned.usgs.gov/
Landsat ETM+ Imagery 15 pan-chromatic, 30 colour http://earthexplorer.usgs.gov/
SPOT Imagery 10 pan-chromatic, 20 colour http://geobase.ca/
Landmap DEM DEM 25 http://landmap.ac.uk/
NERC ARSF aerial photography Imagery 0.15 http://arsf.nerc.ac.uk/
SRTM DEM 30 http://earthexplorer.usgs.gov/
most common result is that two clusters are detected (Fig. 6B–F, K, L, and N). These two clusters occur in the same positions as thefi rst-order visual clustering (Fig. 5D). The larger cluster is not separated when the search window size parameter is adjusted from 0.5 to 0.06 (Fig. 6H–J). Beyond this, the larger cloud is separated into two clusters, one with bedforms aligned withflow direction and another with bedforms transverse toflow (Fig. 6K–N). For only a very small parame-ter space, DBSCAN distinguishes subglacial bedforms with no clear ori-entation withflow direction fromflow-aligned andflow-transverse bedforms (Fig. 6M). Our results were found to be insensitive to the min-imum number of points parameter (MinPts).
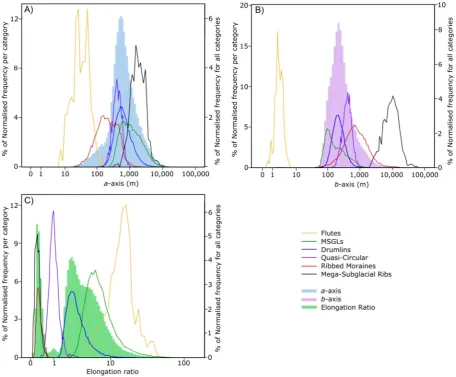
When each bedform's previously determined category was consid-ered, the group of small bedforms that were distinguished visually (Fig. 5) and by DBSCAN (Fig. 6B–F), are revealed to be those that are commonly known asflutes (Figs. 7 and 8). The distinguishing factor of flutes is theirb-axis, which is much smaller than for all other subglacial bedforms (Fig. 7), and has a narrow range and small measures of vari-ance (Table 3). Overlap occurs between all other categories of bedform, as shown by the intersection of density contours belonging to adjacent categories (Fig. 7) and the frequency distribution of their measured metrics (Fig. 8). The strongest overlap occurs between drumlins and MSGLs, which for all parameter combinations occurs between 75% con-tours. The medianb-axis, and the 10th and 90th percentiles of the drumlin and MSGL categories are remarkably similar (Table 3), indicat-ing a consistency between the two groups. This contributes to the clus-tering of drumlins and MSGL together, visually and in DBSCAN (Figs. 5 and 6). The elongation ratio of ribbed moraines and megaribs is also similar, with low coefficients of variation (Table 3). This indicates a
similar shape. The size range of quasi-circular bedforms is much narrower compared to all other subglacial bedforms, except forflutes. Additionally, the coefficient of variation for their size metrics is small, hence their selective positioning onFig. 5. The category of quasi-circular bedforms may contain bedforms some might categorise as ei-ther drumlins or ribbed moraines. However, the mean elongation ratio of 1.07 (Table 3) and the high density of data onFigs. 5, 6, 7, and 8 where the elongation ratio is 1 clearly indicates the existence of near-circular forms.
To assess if there are any systematic controls on bedform metrics from their geographic location,Fig. 9plots the outlines of the data at each locality shown inTable 1. No single location plots separately to the others, with all locations showing multiple overlap with other areas.
4. Discussion
4.1. Is there a subglacial bedform size and shape continuum, several contin-ua, or are they separate phenomena?
The number of populations or clusters, and therefore the number of continua, within our data set depends, to some extent, upon the inter-pretation ofFigs. 5,7, and 8, as well as the parameters chosen for DBSCAN (Fig. 6). However, a consistent result is thatflutes plot sepa-rately to all other subglacial bedforms (Figs. 5–9), forming a distinct population. Given their smaller size,flutes could only be mapped from aerial photography (Tables 1 and 2), rather than digital terrain models or satellite images, but we do not interpret their separation to be a con-sequence of higher resolution imagery being used for mapping. This
Fig. 3.Schematic of derived bedform axes.
interpretation is supported by observations offlutes that reach over 1.5 km long (exceeding the length of many drumlins) whilst maintain-ing their narrow width (Kjær et al., 2006). Flutes are often found superimposed on top of drumlins (e.g.,Boulton, 1987; Hart, 1995; Waller et al., 2008), emphasising the scale difference between the two. We therefore interpretflutes to be morphologically distinct to all other subglacial bedforms, forming a group of narrow and elongate subglacial bedforms. Thus, a clear difference exists in scale betweenflutes and other subglacial bedforms. This is consistent with previous suppositions and interpretations (Boulton, 1976; Rose, 1987; Clark, 1993).
Aside fromflutes, it is difficult to distinguish separate populations of bedforms that are elongated with ice-flow direction. A consistency inb-axis lengths and a lack of any stepwise jump ina-axis lengths between drumlins and MSGLs means that these two categories of flow-aligned bedforms were never separated by any combination of parameters in our quantitative analysis (Fig. 6). They display the highest level of overlap onFigs. 7 and 8. We therefore concur with
previous work using a smaller data set (Stokes et al., 2013b) that drumlins and MSGL form a size and shape continuum of subglacial lineations.
[image:6.595.103.506.56.491.2]Ribbed moraines and megascale ribs also possess overlapping size and shape metrics (Figs. 7 and 8), and were only partially separated by one combination of DBSCAN parameters (Fig. 6G), which may be a consequence of a smaller sample of mega-ribbed moraines. Both popu-lations have a consistent elongation ratio of≈0.3 (Table 3). Wefind no grounds to suggest different morphological populations of ribbed mo-raines, as suggested elsewhere (e.g.,Hättestrand, 1997), as there is no clear break or stepwise relationship in the metrics to indicate separate size and shape categories. Furthermore, putatively different types and scales of subglacial ribs often display close spatial relationships (Greenwood and Kleman, 2010), and have been observed to occur in potentially evolutionary sequences (Markgren and Lassila, 1980). Therefore, we propose that ribbed moraines and mega-ribs form a size and shape continuum of transverse subglacial bedforms that can be called subglacial ribs.
Fig. 5.The size and shape of all 96,900 subglacial bedforms, paying no regard to their nomenclature. (A) Plot ofa-axis (down-flow) andb-axis (acrossflow) dimensions. (B) The same dimensions, plotted on log–log axes. (C) Combined plot ofa-axis,b-axis and elongation ratio (a/b). Although elongation ratio is dependent uponaandbaxes, it is plotted for visualisation purposes. (D) Two possible qualitative (visual) interpretations of clusters. Perhaps the data reveals just two clusters, or on closer inspection it might be possible to distinguish four. See text for further details.
The existence of quasi-circular bedforms that overlap with drumlins and ribbed moraines (Figs. 5,7, and 8) raises the possibility of a single bedform continuum comprising ribs to quasi-circular forms to linea-tions (e.g.,Aario, 1977). All three are often categorised as one cluster by DBSCAN (Fig. 6B–J). When they are split into separate clusters by the quantitative analyses (Fig. 6K–N) it may be a consequence of a gen-uine difference in the shape and scale of subglacial ribs and lineations (Fig. 5D) and/or a small sample size of quasi-circular forms (Table 1). The bridging between ribbed moraines and drumlins provided by quasi-circular bedforms only occurs within a narrow range ofa-and b-axis lengths, centred around 450 m (Figs. 5 and 8).
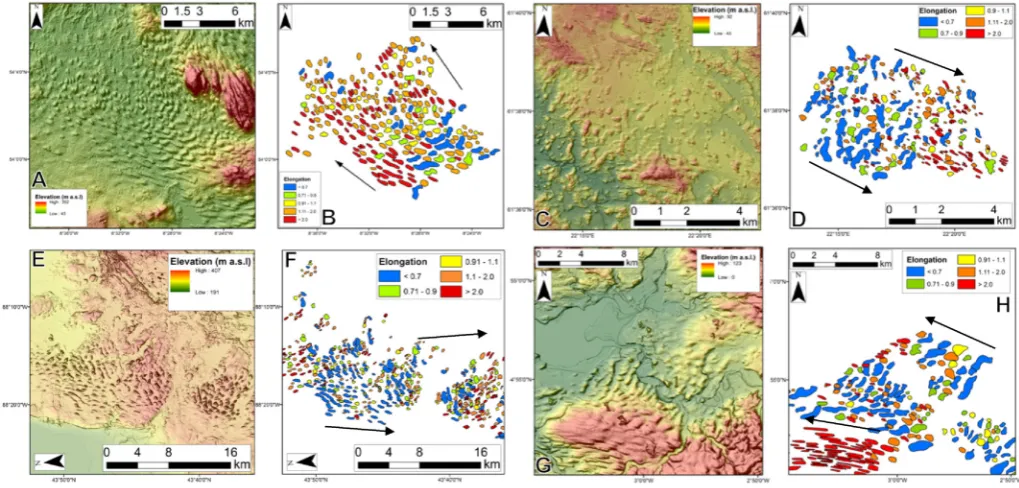
Quasi-circular bedforms — such as the Blattnick moraine of Markgren and Lassila (1980), the mammillary hills ofAario (1977), the circular forms noted byKnight et al. (1999), and the ovoid forms noted bySmith and Wise (2007)—are often reported in transition zones between ribbed moraines and drumlins. Quasi-circular forms were most notable in several locations across the bed of the Irish-ice sheet (Greenwood and Clark, 2008). Given their potential importance, further examples of quasi-circular bedforms were sought and are shown inFig. 10. These examples illustrate how they occur in gradual down-ice transitions between subglacial ribs and lineations and some-times superimposed upon subglacial ribs. Since subglacial bedforms are often assigned a label based uponflow orientation, perhaps quasi-circular forms have been confusing to identify and classify and are more common than is reported in the literature. As they may form an
important link between subglacial ribs and lineations, further work on quasi-circular bedforms is required.
4.2. Controls on the size and shape of subglacial bedforms
[image:8.595.145.459.57.343.2]A correspondence between bedform size and shape and theflow char-acteristics of the geomorphic agent is often invoked for aeolian,fluvial, and marine bedforms (Allen, 1968; Rubin and Ikeda, 1990; Reffet et al., 2010). Similar links have been sought for subglacial bedforms (e.g.,Rose and Letzer, 1977). Several lines of evidence that suggest that subglacial bedform size and shape is primarily determined by properties of the over-lying ice mass. Firstly, bedforms within aflowset usually have a similar size, shape, and alignment toflow direction (Clark, 1999). Thus, different flow events, with different glaciological properties, produce different bedform morphologies. Secondly, bedforms are often observed to evolve gradually along former iceflow trajectories. Such evolutionary sequences can take the form of increases in the elongation of lineations (e.g., Ó Cofaigh et al., 2002; Stokes and Clark, 2002; Briner, 2007; Stokes et al., 2013b) or a switch from ribs to drumlins (e.g.,Fig. 8;Aario, 1977; Aylsworth and Shilts, 1989; Dyke et al., 1992; Knight et al., 1999; Dunlop and Clark, 2006b). Both of these situations have been interpreted to indicate ice acceleration alongflow, particularly in ice-stream settings (Aario, 1977; Hart, 1999; Ó Cofaigh et al., 2002; Stokes and Clark, 2002; Briner, 2007; Stokes et al., 2013a). Support for this is found from modern ice streams where drumlins have been observed beneath the onset zone
Fig. 7.Density contour plots to assess the degree of separation and overlap between named bedform types. Flutes consistently plot separately to all other bedform types, whilst overlap (a-axis,b-axis plot) occurs between other subglacial bedform types. Most notably, this overlap occurs between drumlins and MSGL (overlapping 75% contours) and between ribbed moraine and megasubglacial ribs (overlapping 90% contours). Quasi-circular bedforms overlap with ribbed moraine (90% contours) and drumlin (75%) contours. Note that elongation ratio is de-rived from length and width. However, it is plotted against its components here for illustrative purposes.
Fig. 6.DBSCAN sensitivity analysis to assess how many clusters exist using different parameter settings. Red, green, and blue indicate different clusters. Black points are disregarded by the clustering algorithm as being outside of any cluster caused by a lack of density and cohesiveness with other points. The most common result is that two clusters are detected (B, C, D, E, and F): narrow elongate bedforms and a larger cluster comprising of the remaining data. This occurs whenƐ= 0.5–0.1, andMinPts= 10–100 (B–F). ForƐ= 0.09–0.06 (G–J), the smaller cluster is not detected, but the large cluster remains. WhenƐ= 0.05–0.045, clusters distinguish betweenflow alignment (K). AtƐ= 0.04 andMinPts= 100, a further small cluster betweenflow alignments is detected (blue in‘M’). Yet, a slight change in parameter values alters this result (N). WhenƐis too large, the whole data set is considered a cluster (A), or whenƐis too small, no clusters or clusters of an inappropriate size are detected (O). (For interpretation of the references to colour in thisfigure legend, the reader is referred to the web version of this article.)
of Rutford Ice Stream (King et al., 2007) and MSGLs farther down-flow where ice velocity is higher (King et al., 2009). Subglacial ribs can also be found in evolutionary sequences (Markgren and Lassila, 1980; Greenwood and Kleman, 2010), suggesting a gradual change in boundary
[image:9.595.65.522.52.429.2]conditions, potentially induced by ice-flow properties. Thirdly, bedform morphology conforms strongly to glaciological variables at the ice-sheet scale (Greenwood and Clark, 2010). At the local scale, lithological, sedi-mentological, and topographical differences across a bedformfield may
Fig. 8.Frequency distributions for (A)a-axis, (B)b-axis, and (C) elongation ratio. In each case, the probability distribution function of each bedform is plotted, normalised to the total population of their respective category in order to permit comparisons. This is plotted on the primary y-axis. The histograms (in solid colours) show the distribution of the whole population, plotted against the secondary y-axis.
Table 3
Summary statistics of subglacial bedform categories.
Range (m) Median (m) 10th percentile (m) 90th percentile (m) Coefficient of variation
Flutes a-Axis 138.1 30.5 12.9 68.4 0.6
b-Axis 5.6 2.1 1.3 3.4 0.4
Elongation 41.0 15.3 7.9 25.2 0.4
Megasubglacial ribs a-Axis 11765.4 1980.4 1094.6 3706.4 0.6
b-Axis 53940.1 9286.3 4283.4 17692.7 0.6
Elongation 0.55 0.2 0.1 0.4 0.4
Ribbed Moraines a-Axis 3683.6 196.9 61.2 606.5 0.9
b-Axis 16749.8 701.1 260.1 1941.8 1.0
Elongation 0.75 0.27 0.2 0.4 0.4
Circular Bedform a-Axis 876.4 416.9 274.6 615.0 0.3
b-Axis 1002.7 409.2 264.3 596.6 0.3
Elongation 2.64 1.0 0.7 1.4 0.3
Drumlins a-Axis 10602.1 603.5 323.4 1372.6 0.7
b-Axis 1509.7 213.6 131.2 371.7 0.5
Elongation 36.20 2.8 1.9 4.9 0.5
MSGLs a-Axis 37268.2 1102.1 427.4 3912.9 1.2
b-Axis 2725.8 150.1 81.7 479.2 0.9
[image:9.595.33.555.571.744.2]correspond to morphological differences in the bedforms/landforms (e.g.,Raukas and Tavast, 1994; Rattas and Piotrowski, 2003; Greenwood and Clark, 2010). As deformable sediment can accommodate accelerated iceflow (Alley et al., 1986), the glaciological and sedimentological proper-ties of an ice mass can be interlinked. For example, where there is a boundary between a hard bedrock and soft deformable sediment, there is often a corresponding increase in bedform elongation, interpreted to
correspond to an acceleration in iceflow (e.g.,Wellner et al., 2001; Ó Cofaigh et al., 2002). Therefore, given the complex interaction between iceflow and the nature of its underlying substrate, the exact influence of each of these two components can be rarely discerned.
[image:10.595.141.468.52.307.2]The most commonly invoked glaciological control on subglacial bedform morphology is ice velocity. Ribbed moraines typically are found near ice divides or cold-based regions (Hättestrand, 1997;
Fig. 9.Outlines of the length and width of bedform scatter plots grouped by location. Locations are listed inTable 1. Note the overlap between locations, such that data from no single location is found to be unique.
Fig. 10.Examples of spatial transitions between ribbed moraines and drumlins. Note how in each case, bedforms with no clear alignment toflow (elongation ratio of 0.9 to 1.1; yellow) were noted. (A) Hill-shaded SRTM DEM (30 m) and mapping (B) of bedforms in County Roscommon, Ireland. (C) 2 m LiDAR-derived DEM and mapping (D) of bedforms near Harjavalta, Finland. (E) Hill-shaded 2 m LiDAR DEM and mapping (F) of bedforms in Fon Du Lac County, Wisconsin, USA. (G) Hill-shaded NEXTMAP (5 m) DEM and mapping of bedforms (H) in Cumbria, UK. (For interpretation of the references to colour in thisfigure legend, the reader is referred to the web version of this article.)
[image:10.595.46.556.458.702.2]Trommelen et al., 2014) or on ice-stream beds where they have been inferred to record deceleration immediately prior to ice stream shut-down (Stokes et al., 2008). This suggests slower iceflow is associated with their formation, even if the precise mechanisms are unknown. Drumlins are found farther away from ice divides and in the onset zones of palaeo (Stokes and Clark, 1999; Anderson and Fretwell, 2008) and contemporary ice streams (King et al., 2007), whereas more elongate subglacial lineations (MSGLs) have been associated with ice streams (Clark, 1993, 1994; Stokes and Clark, 1999; King et al., 2009; Spagnolo et al., 2014a). Ice velocity seems to be a prima-ry influence upon bedform orientation and elongation within and between ribs and lineations. Flutes have a separate morphology to other subglacial bedforms (Figs. 5–9). Thus, it is likely that they form under a separate set of boundary conditions or by a process dif-ferent to the larger bedforms.
The size and shape variations of subglacial bedforms appear to be predominately explicable in terms of position within the ice sheet and by variations in glaciological properties. In contrast, bedform sedimentary composition is found to be incredibly varied (overview of ribbed moraine in Hättestrand and Kleman, 1999; drumlins reviewed inStokes et al., 2011, see references therein) and no simple match has been found between sediment properties and the various-ly named types. Sediment within bedforms can contain evidence of deposition (e.g., Dardis et al., 1984; Fisher and Shaw, 1992; Newman and Mickelson, 1994; Möller, 2010; Spagnolo et al., 2014b; Hopkins et al., 2016) and erosion (e.g.,Boyce and Eyles, 1991; Kerr and Eyles, 2007; Ó Cofaigh et al., 2013), as well as several phases of development (Newman et al., 1990; Zelčs and Dreimanis, 1997). Thus, competing erosional and depositional processes are likely to occur at the ice-bed interface during bedform production (Hart, 1997). The bedform conundrum is that the order and simplic-ity in size and shape that we observe, and which tends to lead to pre-sumptions of a unifying process to create them, clashes with the complexity and variation found in the sedimentary properties, which tends to lead to suggestions of a whole range of different pro-cesses. We do not solve this problem here, but suggest that our data could be used as a test for any hypothesis or model of bedform for-mation, noting that the size and shape of bedforms as described here (Figs. 5–9) require explanation, as does their varied internal structure.
5. Conclusions
To test the hypothesis that subglacial bedforms comprise a size and shape continuum across the variously-named types, we analysed 96,900 measurements of subglacial bedform size and shape. The approach was to assess if bedforms vary continuously in size and shape, and thereby comprise a continuum, or whether gaps or jumps exist between the variously named types, indicating that they should be interpreted as discrete phenomena and therefore leading to the continuum hypothesis being rejected. Qualitative and quantitative (cluster) analyses of the data were employed to assess the degree to which separate populations exist. Although there is in-herent subjectivity in any type of cluster analysis, be it visual or quantitative, the convergence of results from our analyses leads us to the following conclusions:
• Subglacial flutes form a distinct cluster of narrower subglacial bedforms, clearly separable from other bedforms.
• Drumlins and MSGL are end members of a size and shape continuum offlow-aligned subglacial bedforms (subglacial lineations).
• Transverse subglacial bedforms belong to a subglacial rib continuum that spans ribbed moraine through to mega-ribbed moraine, with no justification found here for separate entities existing within this class. • An underreported class of bedforms that are quasi-circular potentially bridge the more obvious continua of lineations and ribs suggesting
that a single subglacial continuum spanning ribs, quasi-circular forms, and lineations might exist. To test this possibility, further work on quasi-circular forms is required to increase the sample size and examine the range of scales at which they exist.
Acknowledgements
The authors thank R.D. Larter, M. Ross, 2 anonymous reviewers, and the editor for their useful comments which improved this manuscript. J.C.E. thanks Kathy and Chris Denison for funding his PhD. This work was initiated and supported by a NERC grant (NE/D011175/1) to C.D.C. M.S. was supported by a NERC new investigator grant (NE/J004766/1) and C.R.S., a Philip Leverhulme Prize. S.L.G. acknowledges the University of Sheffield, the Swedish Research Council, and Linnaeus grants to Johan Kleman and the Bolin Centre for Climate Research. A.L.C.H acknowledges BGS NERC PhD studentship (NE/S/A/2004/12102). We thank Andrew Fowler and Richard Hindmarsh for fruitful discussions.
References
Aario, R., 1977.Classification and terminology of morainic landforms in Finland. Boreas 6 (2), 87–100.
Allen, J.R.L., 1968.The nature and origin of bed-form hierarchies. Sedimentology 10 (3), 161–182.
Alley, R.B., Blankenship, D.D., Bentley, C.R., Rooney, S., 1986.Deformation of till beneath ice stream B, West Antarctica. Nature 322, 57–59.
Amos, C.L., King, E.L., 1984.Bedforms of the Canadian eastern seaboard: a comparison with global occurrences. Mar. Geol. 57 (1), 167–208.
Anderson, J.B., Fretwell, L.O., 2008.Geomorphology of the onset area of a paleo-ice stream, Marguerite Bay, Antarctic Peninsula. Earth Surf. Process. Landf. 33 (4), 503–512. Andreassen, K., Laberg, J.S., Vorren, T.O., 2008.Seafloor geomorphology of the SW Barents
Sea and its glaci-dynamic implications. Geomorphology 97 (1), 157–177. Ashley, G.M., 1990.Classification of large-scale subaqueous bedforms: a new look at an old
problem—SEPM bedforms and bedding structures. J. Sediment. Res. 60 (1), 160–172. Aylsworth, J.M., Shilts, W.W., 1989.Bedforms of the Keewatin ice sheet, Canada.
Sedi-ment. Geol. 62 (2), 407–428.
Bouchard, M.A., 1989.Subglacial landforms and deposits in central and northern Quebec, Canada, with emphasis on Rogen moraines. Sediment. Geol. 62 (2), 293–308. Boulton, G.S., 1976.The origin of glaciallyfluted surfaces—observations and theory.
J. Glaciol. 17, 287–309.
Boulton, G.S., 1987.A theory of drumlin formation by subglacial sediment deformation. In: Menzies, J., Rose, J. (Eds.), Drumlin Symposium. Balkema, Rotterdam, pp. 25–80. Boyce, J.I., Eyles, N., 1991.Drumlins carved by deforming till streams below the Laurentide
ice sheet. Geology 19 (8), 787–790.
Briner, J.P., 2007.Supporting evidence from the New York drumlinfield that elongate subglacial bedforms indicate fast iceflow. Boreas 36 (2), 143–147.
Brown, V.H., Stokes, C.R., O'Cofaigh, C., 2011.The glacial geomorphology of the North–
West sector of the Laurentide Ice Sheet. J. Maps 7 (1), 409–428.
Carl, J.D., 1978.Ribbed moraine–drumlin transition belt, St. Lawrence Valley, New York. Geology 6 (9), 562–566.
Carling, P.A., 1999.Subaqueous gravel dunes. J. Sediment. Res. 69 (3).
Clark, C.D., 1993.Mega-scale glacial lineations and cross-cutting ice-flow landforms. Earth Surf. Process. Landf. 18 (1), 1–29.
Clark, C.D., 1994.Large-scale ice-moulding: a discussion of genesis and glaciological sig-nificance. Sediment. Geol. 91 (1), 253–268.
Clark, C.D., 1999.Glaciodynamic context of subglacial bedform generation and preserva-tion. Ann. Glaciol. 28 (1), 23–32.
Clark, C.D., Hughes, A.L., Greenwood, S.L., Spagnolo, M., Ng, F.S., 2009.Size and shape char-acteristics of drumlins, derived from a large sample, and associated scaling laws. Quat. Sci. Rev. 28 (7), 677–692.
Costello, W.R., Southard, J.B., 1981.Flume experiments on lower-flow-regime bed forms in coarse sand. J. Sediment. Res. 51 (3).
Cutts, J.A., Smith, R.S.U., 1973.Eolian deposits and dunes on Mars. J. Geophys. Res. 78 (20), 4139–4154.
Dardis, G.F., McCabe, A.M., Mitchell, W.I., 1984.Characteristics and origins of lee-side stratification sequences in late Pleistocene drumlins, Northern Ireland. Earth Surf. Process. Landf. 9 (5), 409–424.
Dionne, J.C., 1987.Tadpole rock (rock drumlin): a glacial stream moulded form. In: Menzies, J., Rose, J. (Eds.), Drumlin Symposium. Balkema, Rotterdam, pp. 149–159. Dowling, T.P.F., Spagnolo, M., Möller, P., 2015.Morphometry and core type of streamlined
bedforms in southern Sweden from high resolution LiDAR. Geomorphology 236, 54–63. Dunlop, P., Clark, C.D., 2006a.Distribution of ribbed moraine in the Lac Naococane Region,
Central Québec, Canada. J. Maps 2 (1), 59–70.
Dunlop, P., Clark, C.D., 2006b.The morphological characteristics of ribbed moraine. Quat. Sci. Rev. 25 (13), 1668–1691.
Dyke, A.S., Morris, T.F., Green, D.E.C., England, J., 1992.Quaternary geology of Prince of Wales Island, Arctic Canada. Geol. Surv. Can. Mem. 433, 142.
Engelhardt, H., Kamb, B., 1998.Basal sliding of ice stream B, West Antarctica. J. Glaciol. 44 (147), 223–230.
Ester, M., Kriegel, H.P., Sander, J., Xu, X., 1996.A density-based algorithm for discovering clusters in large spatial databases with noise. Kdd 96 (34), 226–231.
Estivill-Castro, V., 2002.Why so many clustering algorithms: a position paper. ACM SIGKDD Explorations Newsletter 4 (1), 65–75.
Evans, D.J., Twigg, D.R., 2002.The active temperate glacial landsystem: a model based on Breiðamerkurjökull and Fjallsjökull, Iceland. Quat. Sci. Rev. 21 (20), 2143–2177. Fisher, T.G., Shaw, J., 1992.A depositional model for Rogen moraine, with examples from
the Avalon Peninsula, Newfoundland. Can. J. Earth Sci. 29 (4), 669–686.
Greenwood, S.L., Clark, C.D., 2008.Subglacial bedforms of the Irish ice sheet. J. Maps 4 (1), 332–357.
Greenwood, S.L., Clark, C.D., 2010.The sensitivity of subglacial bedform size and distribu-tion to substrate lithological control. Sediment. Geol. 232 (3), 130–144.
Greenwood, S.L., Kleman, J., 2010.Glacial landforms of extreme size in the Keewatin sec-tor of the Laurentide Ice Sheet. Quat. Sci. Rev. 29 (15), 1894–1910.
Hart, J.K., 1995.Drumlin formation in southern Anglesey and Arvon, northwest Wales. J. Quat. Sci. 10 (1), 3–14.
Hart, J.K., 1997.The relationship between drumlins and other forms of subglacial glaciotectonic deformation. Quat. Sci. Rev. 16 (1), 93–107.
Hart, J.K., 1999.Identifying fast iceflow from landform assemblages in the geological re-cord: a discussion. Ann. Glaciol. 28 (1), 59–66.
Hättestrand, C., 1997. Ribbed moraines in Sweden—distribution pattern and palaeoglaciological implications. Sediment. Geol. 111 (1), 41–56.
Hättestrand, C., Kleman, J., 1999.Ribbed moraine formation. Quat. Sci. Rev. 18 (1), 43–61. Hess, D.P., Briner, J.P., 2009.Geospatial analysis of controls on subglacial bedform mor-phometry in the New York Drumlin Field—implications for Laurentide Ice Sheet dy-namics. Earth Surf. Process. Landf. 34 (8), 1126–1135.
Hill, A.R., 1973.The distribution of drumlins in County Down, Ireland. Ann. Assoc. Am. Geogr. 63 (2), 226–240.
Hopkins, N.R., Evenson, E.B., Kodama, K.P., Kozlowski, A., 2016.An anisotropy of magnetic susceptibility (AMS) investigation of the till fabric of drumlins: support for an accre-tionary origin. Boreas 45 (1), 100–108.
Hughes, A.L., Clark, C.D., Jordan, C.J., 2010.Subglacial bedforms of the last British Ice Sheet. J. Maps 6 (1), 543–563.
Jackson, R.G., 1975.Hierarchical attributes and a unifying model of bed forms composed of cohesionless material and produced by shearingflow. Geol. Soc. Am. Bull. 86 (11), 1523–1533.
Jain, A.K., 2010.Data clustering: 50 years beyond K-means. Pattern Recogn. Lett. 31 (8), 651–666.
Johnson, M.D., Schomacker, A., Benediktsson, Í.Ö., Geiger, A.J., Ferguson, A., Ingólfsson, Ó., 2010.Active drumlinfield revealed at the margin of Múlajökull, Iceland: a surge-type glacier. Geology 38 (10), 943–946.
Kargel, J.S., Strom, R.G., 1992.Ancient glaciation on Mars. Geology 20 (1), 3–7. Kerr, M., Eyles, N., 2007.Origin of drumlins on thefloor of Lake Ontario and in upper New
York State. Sediment. Geol. 193 (1), 7–20.
King, E.C., Woodward, J., Smith, A.M., 2007.Seismic and radar observations of subglacial bed forms beneath the onset zone of Rutford Ice Stream, Antarctica. J. Glaciol. 53 (183), 665–672.
King, E.C., Hindmarsh, R.C., Stokes, C.R., 2009.Formation of mega-scale glacial lineations observed beneath a West Antarctic ice stream. Nat. Geosci. 2 (8), 585–588. Kjær, K.H., Larsen, E., van der Meer, J., Ingólfsson, Ó., Krüger, J., Benediktsson, Í.Ö.,
Knudsen, C.G., Schomacker, A., 2006.Subglacial decoupling at the sediment/bedrock interface: a new mechanism for rapidflowing ice. Quat. Sci. Rev. 25 (21), 2704–2712. Klages, J.P., Kuhn, G., Hillenbrand, C.D., Graham, A.G.C., Smith, J.A., Larter, R.D., Gohl, K., 2013.First geomorphological record and glacial history of an inter-ice stream ridge on the West Antarctic continental shelf. Quat. Sci. Rev. 61, 47–61.
Kleman, J., Glasser, N.F., 2007.The subglacial thermal organisation (STO) of ice sheets. Quat. Sci. Rev. 26 (5), 585–597.
Knight, J., McCarron, S.G., McCabe, A.M., 1999.Landform modification by palaeo-ice streams in east-central Ireland. Ann. Glaciol. 28 (1), 161–167.
Lancaster, N., 1988.Controls of eolian dune size and spacing. Geology 16 (11), 972–975. Lancaster, N., 2013.Geomorphology of Desert Dunes. Routledge, p. 159.
Lane, T.P., Roberts, D.H., Rea, B.R., Ó Cofaigh, C., Vieli, A., 2015.Controls on bedrock bedform development beneath the Uummannaq Ice Stream onset zone, West Green-land. Geomorphology 231, 301–313.
Larter, R.D., Graham, A.G., Gohl, K., Kuhn, G., Hillenbrand, C.D., Smith, J.A., Deen, T.J., Livermore, R.A., Schenke, H.W., 2009.Subglacial bedforms reveal complex basal re-gime in a zone of paleo-ice stream convergence, Amundsen Sea embayment, West Antarctica. Geology 37 (5), 411–414.
Maclachlan, J.C., Eyles, C.H., 2013.Quantitative geomorphological analysis of drumlins in the Peterborough drumlinfield, Ontario, Canada. Geografiska Annaler: Series A, Phys-ical Geography 95 (2), 125–144.
Markgren, M., Lassila, M., 1980.Problems of moraine morphology: Rogen moraine and Blattnick moraine. Boreas 9 (4), 271–274.
McHenry, M., Dunlop, P., 2015.The subglacial imprint of the last Newfoundland Ice Sheet, Canada. J. Maps 1–22 (ahead-of-print).
Möller, P., 2010.Melt-out till and ribbed moraine formation, a case study from south Sweden. Sediment. Geol. 232 (3), 161–180.
Napieralski, J., Nalepa, N., 2010.The application of control charts to determine the effect of grid cell size on landform morphometry. Comput. Geosci. 36 (2), 222–230. Newman, W.A., Mickelson, D.M., 1994.Genesis of Boston Harbor drumlins,
Massachu-setts. Sediment. Geol. 91 (1), 333–343.
Newman, W.A., Berg, R.C., Rosen, P.S., Glass, H.D., 1990.Pleistocene stratigraphy of the Boston Harbor drumlins, Massachusetts. Quat. Res. 34 (2), 148–159.
Ó Cofaigh, C., Pudsey, C.J., Dowdeswell, J.A., Morris, P., 2002.Evolution of subglacial bedforms along a paleo-ice stream, Antarctic Peninsula continental shelf. Geophys. Res. Lett. 29 (8), 41-1.
Ó Cofaigh, C., Stokes, C.R., Lian, O.B., Clark, C.D., Tulacyzk, S., 2013.Formation of mega-scale glacial lineations on the Dubawnt Lake Ice Stream bed: 2. Sedimentology and stratigraphy. Quat. Sci. Rev. 77, 210–227.
Ottesen, D., Dowdeswell, J.A., Rise, L., 2005.Submarine landforms and the reconstruction of fast-flowing ice streams within a large Quaternary ice sheet: the 2500-km-long Norwegian–Svalbard margin (57–80 N). Geol. Soc. Am. Bull. 117 (7–8), 1033–1050. Punkari, M., 1984.The relations between glacial dynamics and the tills in the eastern part of the Baltic shield. In: Königsson, L.-K. (Ed.), Ten Years of Nordic Till Research, Striae. 20, pp. 49–54.
Radebaugh, J., Lorenz, R.D., Lunine, J.I., Wall, S.D., Boubin, G., Reffet, E., Kirk, R.L., Lopes, R.M., Stofan, E.R., Soderblom, L., Allison, M., Janssen, M., Paillou, P., Callahan, P., Spencer, C., The Cassini Radar Team, 2008.Dunes on Titan observed by Cassini RADAR. Icarus 194 (2), 690–703.
Rattas, M., Piotrowski, J.A., 2003.Influence of bedrock permeability and till grain size on the formation of the Saadjärve drumlin field, Estonia, under an east-Baltic Weichselian ice stream. Boreas 32 (1), 167–177.
Raukas, A., Tavast, E., 1994.Drumlin location as a response to bedrock topography on the southeastern slope of the Fennoscandian Shield. Sediment. Geol. 91 (1), 373–382. Reffet, E., du Pont, S.C., Hersen, P., Douady, S., 2010.Formation and stability of transverse
and longitudinal sand dunes. Geology 38 (6), 491–494.
Rooney, S.T., Blankenship, D.D., Alley, R.B., Bentley, C.R., 1987.Till beneath ice stream B: 2. Structure and continuity. J. Geophys. Res. Solid Earth (1978–2012) 92 (B9), 8913–8920.
Rose, J., 1987.Drumlins as part of glacier bedform continuum. In: Menzies, J., Rose, J. (Eds.), Drumlin Symposium. Balkema, Rotterdamn, pp. 103–118.
Rose, J., Letzer, J.M., 1977.Superimposed drumlins. J. Glaciol. 18 (80), 471–480. Rubin, D.M., Ikeda, H., 1990.Flume experiments on the alignment of transverse, oblique,
and longitudinal dunes in directionally varyingflows. Sedimentology 37 (4), 673–684.
Saha, K., Wells, N.A., Munro-Stasiuk, M., 2011.An object-oriented approach to automated landform mapping: a case study of drumlins. Comput. Geosci. 37 (9), 1324–1336. Smith, M.J., Clark, C.D., 2005.Methods for the visualization of digital elevation models for
landform mapping. Earth Surf. Process. Landf. 30 (7), 885–900.
Smith, M.J., Wise, S.M., 2007.Problems of bias in mapping linear landforms from satellite imagery. Int. J. Appl. Earth Obs. Geoinf. 9 (1), 65–78.
Smith, A.M., Murray, T., Nicholls, K.W., Makinson, K., Ađalgeirsdóttir, G., Behar, A.E., Vaughan, D.G., 2007.Rapid erosion, drumlin formation, and changing hydrology be-neath an Antarctic ice stream. Geology 35 (2), 127–130.
Spagnolo, M., Clark, C.D., Hughes, A.L., Dunlop, P., Stokes, C.R., 2010.The planar shape of drumlins. Sediment. Geol. 232 (3), 119–129.
Spagnolo, M., Clark, C.D., Ely, J.C., Stokes, C.R., Anderson, J.B., Andreassen, K., Graham, A.G.C., King, E.C., 2014a.Size, shape and spatial arrangement of mega-scale glacial lin-eations from a large and diverse dataset. Earth Surf. Process. Landf. 39 (11), 1432–1448.
Spagnolo, M., King, E.C., Ashmore, D.W., Rea, B.R., Ely, J.C., Clark, C.D., 2014b.Looking through drumlins: testing the application of ground-penetrating radar. J. Glaciol. 60 (224), 1126–1134.
Stokes, C.R., Clark, C.D., 1999.Geomorphological criteria for identifying Pleistocene ice streams. Ann. Glaciol. 28 (1), 67–74.
Stokes, C.R., Clark, C.D., 2002.Are long subglacial bedforms indicative of fast iceflow? Bo-reas 31 (3), 239–249.
Stokes, C.R., Lian, O.B., Tulaczyk, S., Clark, C.D., 2008.Superimposition of ribbed moraines on a palaeo-ice-stream bed: implications for ice stream dynamics and shutdown. Earth Surf. Process. Landf. 33 (4), 593–609.
Stokes, C.R., Spagnolo, M., Clark, C.D., 2011.The composition and internal structure of drumlins: complexity, commonality, and implications for a unifying theory of their formation. Earth Sci. Rev. 107 (3), 398–422.
Stokes, C.R., Fowler, A.C., Clark, C.D., Hindmarsh, R.C., Spagnolo, M., 2013a.The instability theory of drumlin formation and its explanation of their varied composition and in-ternal structure. Quat. Sci. Rev. 62, 77–96.
Stokes, C.R., Spagnolo, M., Clark, C.D., Ó Cofaigh, C., Lian, O.B., Dunstone, R.B., 2013b. For-mation of mega-scale glacial lineations on the Dubawnt Lake Ice Stream bed: 1. Size, shape and spacing from a large remote sensing dataset. Quat. Sci. Rev. 77, 190–209. Storrar, R., Stokes, C.R., 2007.A glacial geomorphological map of Victoria Island, Canadian
Arctic. J. Maps 3 (1), 191–210.
Trommelen, M., Ross, M., 2010.Subglacial landforms in northern Manitoba, Canada, based on remote sensing data. J. Maps 6 (1), 618–638.
Trommelen, M.S., Ross, M., Ismail, A., 2014.Ribbed moraines in northern Manitoba, Canada: characteristics and preservation as part of a subglacial bed mosaic near the core regions of ice sheets. Quat. Sci. Rev. 87, 135–155.
Waller, R.I., Van, D.A.T., Knudsen, Ó., 2008.Subglacial bedforms and conditions associated with the 1991 surge of Skeiðarárjökull, Iceland. Boreas 37 (2), 179–194.
Wellner, J.S., Lowe, A.L., Shipp, S.S., Anderson, J.B., 2001.Distribution of glacial geomorphic features on the Antarctic continental shelf and correlation with substrate: implica-tions for ice behavior. J. Glaciol. 47 (158), 397–411.
Wilson, I.G., 1973.Ergs. Sediment. Geol. 10 (2), 77–106.
Winsborrow, M., Clark, C.D., Stokes, C.R., 2004.Ice streams of the Laurentide ice sheet. Géog. Phys. Quatern. 58 (2–3), 269–280.
Worman, S.L., Murray, A.B., Littlewood, R., Andreotti, B., Claudin, P., 2013.Modeling emer-gent large-scale structures of barchan dunefields. Geology 41 (10), 1059–1062. Zelčs, V., Dreimanis, A., 1997.Morphology, internal structure and genesis of the Burtnieks