Int. J. Electrochem. Sci., 10 (2015) 6487 - 6499
International Journal of
ELECTROCHEMICAL
SCIENCE
www.electrochemsci.org
Evaluation of Cavitation Erosion-Corrosion Process of Q235
and ZG06Cr13Ni4Mo With Various Applied Potentials
Zhiming GAO*, Changye WANG, Yangyang LIU
School of Materials Science and Engineering, Tianjin University, Tianjin 300072, PR. China Tianjin Key Laboratory of Composite & Functional Materials
*
E-mail: [email protected]
Received: 10 March 2015 / Accepted: 19 May 2015 / Published: 24 June 2015
The effect of applied protection potentials on cavitation erosion-corrosion process of Q235 and ZG06Cr13Ni4Mo was studied by means of mass loss, EIS and SEM, parameter changes were revealed for both materials when exposed to cavitation, which provided an intuitive understanding of the cavitation failure process. The results indicate, based on the analysis of the impedance spectra together with SEM morphologies, at open circuit potential and with -800mV, -1000mV, -1200mV(vs. SCE) applied, the changes of the CPE(constant phase element) values reflect the surface roughness changes. At the same time, charge transfer resistance Rct was revealed, Rct decreased from the beginning to 8 h
at open circuit potential and became larger within 8 hours of experiment with -800mV applied for both materials. However with -1000mV and -1200mV applied, Rct remained almost constant and no obvious
changes were observed. The changes of Rct could be well explained by mixed-potential reaction theory.
The author wish this work will provide some reference for the practical application.
Keywords: Cathodic protection; cavitation erosion-corrosion; mass loss; EIS; SEM, mixed-potential
reaction theory
1. INTRODUCTION
high as 90%. Luo et al.[5,6] carried out Electrochemical Impedance Spectroscopy measurements of 20SiMn steel in different solutions to elucidate the corrosion mechanism under cavitation conditions, It was found that the free corrosion potential shifted to higher positive values, corrosion rate increased. Stack[7] evaluated a composite-based coating in sea water conditions in which experiments the effects of slurry concentration and potential were studied, erosion-corrosion maps were constructed based on the results showing the erosion-corrosion mechanism, the level of wastage and extent of synergy between the tribological and corrosion processes. Ryl et al.[8] carried out dynamic electrochemical impedance spectroscopy(DEIS) in galvanostatic mode to monitor the impedance parameters in cavitation failure within 120 minutes, it was found that the charge-transfer resistance determines changes in the corrosion rate under the combined mechanical and electrochemical factors, the author thought the decrease of Rct under cavitation exposure was connected with partial removal of the
corrosion product layer from the surface, thus exhibiting the bare reactive metal. However, in this study, we focused on a relatively long period of time within 8 hours with various applied potentials, some differences of the parameter changes were found and discussed later in the manuscript.
Precious determination of the dynamics of changes to electrochemical parameters under cavitation exposure plays a key role to understand the synergistic mechanism, it was proven that cavitation exposure has an influence on the impedance parameters, qualitative and quantitative information of corrosion factors influencing the erosion-corrosion were necessary to be presented and discussed to evaluate the process.In this study, different potentials were applied to the samples in 3.5% NaCl solution, mass loss data and EIS were analyzed, CPE value was found to be a good indication to evaluate the surface roughness both for mild steel(Q235) and stainless steel(ZG06Cr13Ni4Mo), Rct
changes with time from 1 hour to 8 hours presenting the process were different for materials, mixed-potential reaction theory was applied to discussed the phenomenon.
2. EXPERIMENTAL PROCEDURE
2.1. Material preparation and apparatus
Cavitation erosion was produced by a magnetostrictive-driven apparatus resonating at 20kHz with a peak-to-peak 60μm, working power is 216W. Q235 and ZG06Cr13Ni4Mo was chosen for the study, chemical composition(wt.%) of ZG06Cr13Ni4Mo is listed below in Table 1. Prior to each experiment, samples were grounded with 400-1500 grade emery papers and polished mechanically, degreased in acetone, then dried and stored in a desiccator[9].
Table 1. Chemical composition of ZG06Cr13Ni4Mo in wt.%
Cr Ni Mo Si Mn P S Cu V W others
All experiments were carried out at room temperature(25±2℃)with a traditional threeelectrode system in 3.5% NaCl with different applied potentials ranging from open circuit potential to -1200mV.
2.2. Mass loss study
For mass loss vs. time tests, the samples were screwed into the horn and immersed into the medium to a depth of 10mm. The exposure area of the specimen was 2.00 cm2. After each test period, the specimen was degreased, rinsed, dried, and weighed by using an analytical balance with an accuracy of 0.1mg. This test followed ASTM standard G32.
2.3. Electrochemical impedance spectroscopy
Electrochemical experiments were conducted by an EG&G Parstat 2273 station using a traditional three-electrode system. The coated sample with an exposure area of 2.00 cm2 was used as the working electrode. A saturated calomel electrode (SCE) was used as the reference electrode (RE) and the coil-shaped platinum wire as the counter electrode.
EIS were measured after 1, 2, 4, 8 hours of exposure. Perturbation amplitudes was 10mV in a frequency ranging from 10mHz to 100kHz. EIS should be measured within time as short as possible to avoid any problems caused, in present study, EIS measurement were repeated twice and the results had an acceptable reproducibility. Values of charge transfer resistance(Rct) and CPE(constant phase
element) were revealed.
2.4. Surface study
After each EIS measurement, samples were placed in the ultrasonic cleaner to detach any loose material, dried and weighted. Detailed SEM examination was performed on the surface after cavitation respectively every time node to observe the development of cavitation damage.
3. RESULTS
3.1 Mass loss of Q235 and ZG06Cr13Ni4Mo
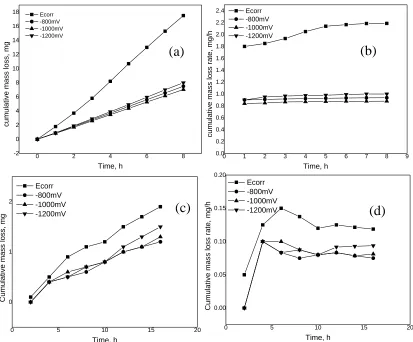
Mass loss rate of Q235 and ZG06Cr13Ni4Mo with optimum protection potential was much lower than at open circuit potential, but not much different from other applied potentials. All mass loss rate kept almost constant after 8 hours of exposure[9,10].
In a simple comparison by mass loss rate, ZG06Cr13Ni4Mo possess much higher cavitation erosion-corrosion resistance than that of Q235, while almost no mass loss was found in the first 2 hours of experiment for ZG06Cr13Ni4Mo.
0 2 4 6 8
-2 0 2 4 6 8 10 12 14 16 18
cum
ulat
ive m
ass lo
ss, m
g
Time, h
Ecorr -800mV -1000mV -1200mV
0 1 2 3 4 5 6 7 8 9
0.0 0.2 0.4 0.6 0.8 1.0 1.2 1.4 1.6 1.8 2.0 2.2 2.4
cum
ulat
ive m
ass lo
ss ra
te,
mg
/h
Time, h Ecorr
-800mV -1000mV -1200mV
0 5 10 15 20
0 1 2
Cumu
lative
ma
ss loss,
mg
Time, h Ecorr
-800mV -1000mV -1200mV
0 5 10 15 20
0.00 0.05 0.10 0.15 0.20
Cumu
lative
ma
ss loss
ra
te,
mg
/h
Time, h Ecorr
[image:4.596.94.507.190.532.2]-800mV -1000mV -1200mV
Figure 1. Cumulative mass loss curve of Q235(a), ZG06Cr13Ni4Mo(c) and cumulative mass loss rate
curve of Q235(b), ZG06Cr13Ni4Mo(d) in 3.5% NaCl solution
3.2 Electrochemical impedance spectroscopy
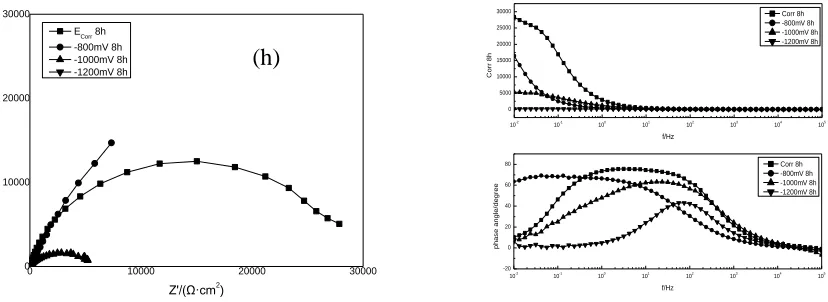
The impedance spectra measured with different applied potentials were illustrated in Fig.2. With different protection potentials, the shape of impedance spectra varied from each other. Magnitudes of the impedance were clearly observed. It is evident that the general shape of the spectra includes impedance response of the samples at higher frequencies and a corrosion process of the samples at lower frequencies[11].
As for both Q235 and ZG06Cr13Ni4Mo, obvious differences of the spectroscopy were that the capacitive loops of optimum protection potential(-800mV vs. SCE) were much larger than those of other potentials.
(c)
(d)
In previous works, plenty of work have been done to investigate the synergistic effect of erosion-corrosion effect. Guo and Lu[12] analyzed the interaction of mechanical and electrochemical factors in the erosion-corrosion process of carbon steel A1045, discovering that the synergism due to the interaction of erosion and corrosion was divided into corrosion-enhanced erosion and erosion-enhanced corrosion, and corrosion is not significantly affected by mass transfer when the rotating velocity is high enough as well as solid impingement.
-200 0 200 400 600 80010001200140016001800 -200 0 200 400 600 800 1000 1200 1400 1600 1800 -Z '' /Ω· cm 2 Z'/Ω·cm2 Ecorr 1h -800mv 1h -1000mv 1h -1200mv 1h 10-2 10-1 100 101 102 103 104 105 0 1000 2000
10-2 10-1 100 101 102 103 104 105 -10 0 10 20 30 40 50 60 70 |Z | /Ω ·c m 2 f/Hz Ecorr 1h -800mv 1h -1000mv 1h -1200mv 1h ph ase /° f/Hz Ecorr 1h -800mv 1h -1000mv 1h -1200mv 1h
-200 0 200 400 600 800 1000 1200 1400 1600 1800 -200 0 200 400 600 800 1000 1200 1400 1600 1800 -Z '' /Ω· cm 2
Z'/Ω·cm2
E
corr 2h
-800mv 2h -1000mv 2h -1200mv 2h 10-2 10-1 100 101 102 103 104 105 0 1000 2000
10-2 10-1 100 101 102 103 104 105 -10 0 10 20 30 40 50 60 70 |Z | /Ω ·c m 2 f/Hz Ecorr 2h -800mv 2h -1000mv 2h -1200mv 2h ph ase /° f/Hz Ecorr 2h -800mv 2h -1000mv 2h -1200mv 2h
-200 0 200 400 600 800 10001200140016001800
-200 0 200 400 600 800 1000 1200 1400 1600 1800 -Z '' /Ω· cm 2
Z'/Ω·cm2
Ecorr 4h
-800mv 4h -1000mv 4h -1200mv 4h 10-2 10-1 100 101 102 103 104 105 0 1000 2000
-200 0 200 400 600 800 10001200140016001800
-200 0 200 400 600 800 1000 1200 1400 1600 1800 -Z '' /Ω· cm 2
Z'/Ω·cm2
Ecorr 8h -800mv 8h -1000mv 8h -1200mv 8h 10-2 10-1 100 101 102 103 104 105 0 1000 2000 10-2 10-1 100 101 102 103 104 105 -10 0 10 20 30 40 50 60 |Z | /Ω·c m 2 f/Hz Ecorr 8h -800mv 8h -1000mv 8h -1200mv 8h ph as e /° f/Hz Ecorr 8h -800mv 8h -1000mv 8h -1200mv 8h
0 5000 10000 15000 20000 25000 30000 0 5000 10000 15000 20000 25000 30000 -Z ''/( Ω ·cm 2) Z'/(Ω·cm2 )
ECorr 1h
-800mV 1h -1000mV 1h -1200mV 1h 10-2 10-1 100 101 102 103 104 105 -5000 0 5000 10000 15000 20000 25000 30000 35000 40000 10-2 10-1 100 101 102 103 104 105 -10 0 10 20 30 40 50 60 70 80 |Z |/( Ω ·c m 2) f/Hz Corr 1h -800mV 1h -1000mV 1h -1200mV 1h p h a s e a n g le/ d e g re e f/Hz Corr 1h -800mV 1h -1000mV 1h -1200mV 1h
0 10000 20000 30000 40000 50000 0 10000 20000 30000 40000 50000 E
Corr 2h
-800mV 2h -1000mV 2h -1200mV 2h -Z ''/( Ω ·cm 2) Z'/(Ω·cm2 ) 10-2 10-1 100 101 102 103 104 105 0 10000 20000 30000 40000 50000 60000 10-2 10-1 100 101 102 103 104 105 -20 0 20 40 60 80 |Z |/( Ω ·c m 2) f/Hz Corr 2h -800mV 2h -1000mV 2h -1200mV 2h p h a s e a n g le/ d e g re e f/Hz Corr 2h -800mV 2h -1000mV 2h -1200mV 2h
0 10000 20000 30000 40000 50000 0 10000 20000 30000 40000 50000
ECorr 4h
0 10000 20000 30000
0 10000 20000 30000
ECorr 8h
-800mV 8h -1000mV 8h -1200mV 8h
-Z
''/(
Ω
·cm
2)
Z'/(Ω·cm2
)
10-2 10-1
100 101
102 103
104 105 -20
0 20 40 60 80 10-2
10-1 100
101 102
103 104
105 0
5000 10000 15000 20000 25000 30000
p
h
a
s
e
a
n
g
le/
d
e
g
re
e
f/Hz
Corr 8h -800mV 8h -1000mV 8h -1200mV 8h
C
o
rr
8
h
f/Hz
[image:7.596.93.507.84.235.2]Corr 8h -800mV 8h -1000mV 8h -1200mV 8h
Figure 2. Impedance changes after different cavitation exposure time(1 h, 2 h, 4 h, 8 h respectively)
with different applied protection potentials of Q235(a, b, c, d) and ZG06Cr13Ni4Mo(e, f, g, h)
Ryl carried out Dynamic Electrochemical Impedance Spectroscopy(DEIS) to study the on-line monitoring of impedance spectra parameters in cavitation within 120 minutes, the results correspond to degradation of mild steel samples under the influence of cavitation erosion-corrosion. It has been shown that a change of pseudo-capacitance corresponds to an increase in sample roughness, charge transfer resistance determines changes in the corrosion rate under the combined mechanical and electrochemical factors. In this study, what we are focusing and paying a close attention was the changes within an extended period of time with various applied potentials, and for a more detailed analysis and a deeper discussion, EIS results were fitted using equivalent circuits and charge transfer resistance(Rct)is discussed with the SEM micrographs to evaluate the cavitation process with different
applied potentials.
4. DISCUSSION
4.1 Electrochemical impedance parameters(CPE, Rct)and SEM morphologies
As we know, electrochemical equivalent circuit(EEC) is a classical analytical method to process EIS data[11], in this study, different models had been proposed for interpreting impedance spectra, it is evident that the general shape of all EIS plots consists of only one time constant. And due to dispersion effect, constant phase element(CPE) was used to replace capacitance component.
Therefore, a single-time-constant equivalent electrical circuit R(QR) was used for analyzing EIS plots without cathodic protection, which consists of the solution resistance Rs, the constant phase
element (CPE) and the charge transfer resistance Rct, while EIS plots with cathodic protection applied
can be characterized by R(Q(RW)). Which consists of the solution resistance Rs, the constant phase
element(CPE), the charge transfer resistance Rct and Warburg component(due to dispersion effect)
W[13,14].
ZCPE=[Q(jw)n]-1 (1)
0 1 2 3 4 5 6 7 8 9
0.0002 0.0004 0.0006 0.0008 0.0010 0.0012 0.0014 0.0016 0.0018 0.0020
CPE
/-Time,h 0mV
-800mV -1000mV -1200mV
0 1 2 3 4 5 6 7 8 9
0.0001 0.0002 0.0003 0.0004 0.0005 0.0006 0.0007 0.0008
CPE
/-Time,h
[image:8.596.81.515.126.301.2]0mV --800mV --1000mV --1200mV
Figure 3. Changes of CPE values, Q235(a), ZG06Cr13Ni4Mo(b)
Table 2. CPE values of tested samples with different applied potentials after cavitation exposure
CPE
Samples
Q235 ZG06Cr13Ni4Mo
0mV -800mV
-1000mV -1200mV 0mV -800mV -1000mV
-1200mV 1 h 0.00084 0.00125 0.00129 3.126E-4 5.626E-4 5.379E-5 1.553E-4 1.727E-4 2 h 0.00117 0.00144 9.337E-4 2.876E-4 5.728E-4 5.617E-5 2.095E-4 1.877E-4 4 h 0.00145 0.00144 7.848E-4 2.723E-4 5.781E-4 5.93E-5 2.171E-4 1.91E-4 8 h 0.00183 0.00161 6.163E-4 2.553E-4 5.793E-4 6.67E-5 2.175E-4 2.097E-4
Where ZCPE is the CPE constant, w is the angular-frequency, j2=-1 is the imaginary number and
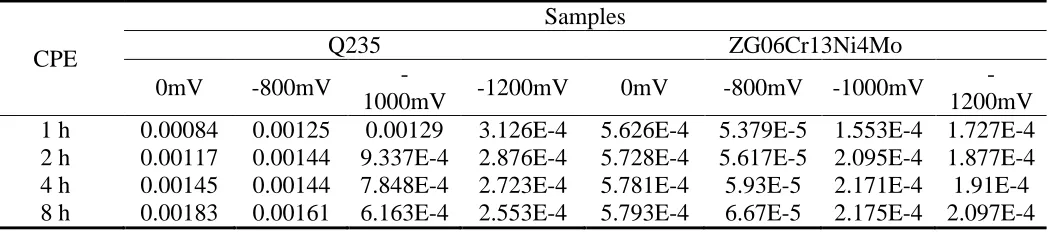
n is the CPE component. The factor n, defined as a CPE power, is an adjustable parameter that always lies between 0.5 and 1. When n=1, the CPE describes an ideal capacitor; for 0.5<n<1, the CPE describes a distribution of dielectric relaxation times in frequency space; and when n=0.5 the CPE represents a Warburg impedance with diffusion character. Basically, values between 0.7 and 0.9 are often obtained with solid electrodes in aqueous solutions, much lower values about 0.5 have frequently been observed with porous electrodes[15,16]. The rougher the surface, the larger the deviation from the ideal capacitive behaviour is, then change of CPE value is thought to be a good indication or tool to evaluate the sample surface roughness change[17].
4.1.1 Effect of cavitation on CPE behavior for Q235
As we have been discussed before, CPE is controlled by both Q and n, which is related to the surface roughness of the samples, generally attributed to the fractal geometry, inhomogeneity and
(a)
[image:8.596.40.564.385.501.2]
electrode porosity. CPE values of Q235 with various applied potentials increased with time, and at open circuit potential, the change is the greatest(from 8.40×10⁻⁴ to 1.83×10⁻³
) as well as the mass loss as we can see in Fig. 1. From the SEM morphologies of Q235 samples shown in Fig 5, we can directly perceive through sights that the samples at open circuit potential show typical cavitation erosion-corrosion morphology, with deep dimples and tiny honeycomb cavitation erosion pit, numerous hills and valleys on the surface are observed, indicating more severely damaged than with other protection potentials. The micrographs with -800mV applied show comparatively uniform appearance. Micrographs with -1000mV and -1200mV applied, corrosion depth is fairly small, but hydrogen embrittlement phenomenon leads to easier degradation and fatigue of materials under bubble collapsing effect, we can see foam-like structure occurred[18].
It should be noted that there is a interesting behavior of the CPE values, that is with -1000mV and -1200mV applied, the values keep decreasing, but increasing at open circuit potential and -800mV applied. The author speculate that this phenomenon could be related with the hydrogen evolution process, the surface suffered from the generation of hydrogen at a critical applied potential, surface metal of the samples will fail and flake off on a large scale, but surface roughness does not change significantly on the contrary. This still needs further research.
4.1.2 Effect of cavitation on CPE behavior for ZG06Cr13Ni4Mo
Changes of CPE values of ZG06Cr13Ni4Mo shows different trends and the slope is fairly small indicating that the surface roughness would not change significantly. At open circuit potential, the CPE value is the largest, but the slope is still very small. With -1000mV and -1200mV applied, the value is very close to each other. Comparing SEM morphologies of both materials, SEM micrographs of investigated ZG06Cr13Ni4Mo samples taken after 8 hours of cavitation exposure however show some differences. After 8 hours of experiment at open circuit potential, the surface roughness is a little bit increased than that with -800mV applied, but scratches from mechanical grinding with abrasive paper are still obvious and visible. Micrographs with -1000mV and -1200mV applied, only shallow pits are observed. In other words, ZG06Cr13Ni4Mo possess higher cavitation erosion-corrosion resistance.
0 1 2 3 4 5 6 7 8 9
0 200 400 600 800 1000 1200 1400 1600 1800 2000 2200
Rct
/(
Ω
·cm
2)
Time/h
Ecorr -800mv -1000mv -1200mv
0 1 2 3 4 5 6 7 8 9
0 1E5 2E5
Rct
/(
Ω
·cm
2 )
Time/h
[image:9.596.79.516.571.725.2]Ecorr -800mV -1000mV -1200mV
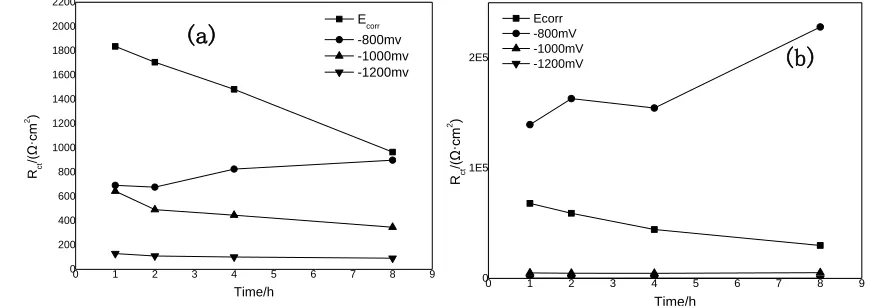
Figure 4. Changes of Rct parameter as a function of time with different applied potentials for (a)Q235,
(b)ZG06Cr13Ni4Mo
(a)
Table 2. Rct values of tested samples with different applied potentials after cavitation exposure
Rct
Samples
Q235 ZG06Cr13Ni4Mo
0mV -800mV
-1000mV
-1200mV 0mV -800mV
-1000mV -1200mV
1 h 1836 692.4 643.7 130 68054 139400 4971 258.1
2 h 1706 677.6 491.9 110.3 59050 163000 4657 200.8
4 h 1483 826.3 446.2 102 44320 154500 4580 203.6
8 h 965.5 899.5 347.3 91.8 29860 228000 5180 143
Figure 5. SEM morphologies of samples with different applied protection potentials Q235(a)open
In the first 2 hours of the mass loss study, the total amount of mass loss is too small to be measured. So the incubation period of ZG06Cr13Ni4Mo was estimated to be 2 hours, during the initial stage, material detachment is negligible as stresses arising from implosion of cavitation bubbles accumulate in material, but do not lead to erosion.
Similar experiment has been reported for CrMnN duplex stainless steel(DSS) and 0Cr13Ni5Mo stainless steel(SS) in 0.5mol/L NaCl solution[17], where the solution permit the formation of the closely adherent oxide film on surface of materials, the electrochemical dissolution was controlled by anodic reaction. Therefore, the cavitation corrosion behavior was determined by accelerated anodic reaction due to mechanically stripping of the passive film. Only part of the surface was being impacted by collapse of bubbles and interact electrochemically, the contribution of corrosion to total mass loss was small. In this study, ZG06Cr13Ni4Mo is stainless steel with high strength mechanical property, so the mass loss and mass loss rate is much smaller than that of Q235.
4.2 Effect of applied potentials on Rct behavior for Q235 and ZG06Cr13Ni4Mo
Changes of charge transfer resistance as a function of time with different applied potentials are shown in Fig.4. As both for Q235 and ZG06Cr13Ni4Mo, Rct decreases dramatically from the
beginning to 8 h at open circuit potential. When applied potential is -800mV, Rct became larger within
8 hours of experiment. When protective potentials negatively shifted to -1000mV and -1200mV, Rct
remains constant and maintains at a low value compared with open circuit potential and -800mV applied.
According to mixed-potential reaction theory[19], anodic reaction and cathodic reaction are simultaneously proceed with applied potentials. Therefore, Rct could be analyzed by following
equation:
Rctc Rcta
Rct
1 1
1
(2)
Where Rct is charge transfer resistance, Rcta anodic reaction charge transfer resistance, Rctc is
cathodic charge transfer resistance.
When applied with cathodic protection potentials, Rcta will increase while Rctc will decrease
slowly as the protection potentials negatively shifted. Hydrogen reductive reaction will occur as protection potential negatively moved to a certain value, Rctc will be controlled by cathodic reductive
resistance of both oxygen(RctcO) and hydrogen(RctcH), as follows:
RctcH RctcO
Rctc
1 1
1
(3)
Therefore, as we discussed before, typical cavitation erosion-corrosion morphology formed at open circuit potentials, Rct drops obviously within 8 hours both for Q235 and ZG06Cr13Ni4Mo at
be neglected with -800mV applied, so Rct becomes larger. Meanwhile, Rct of ZG06Cr13Ni4Mo with
-800mV applied is much larger than that of Q235, because ZG06Cr13Ni4Mo is martensitic stainless steel with high strength mechanical property, corrosion produce layer is more compact and adherent which could be proven by the color of the test solution. Q235 testing solution turned into light yellow and brown, but ZG06Cr13Ni4Mo testing solution is nearly transparent and no obvious color change is observed[18]. And the mass loss and mass loss rate is much smaller than that of Q235 which showed clear evidence. When the applied potential negatively shifted to -1000mV and -1200mV, obvious hydrogen evolution is more and more highlighted, Rctc decreased as RctcH rapidly decreased in the same
time. Corrosion product layer becomes more difficult to be absorbed on the surface due to hydrogen evolution, then Rct will decrease. Comparing the samples with -800mV and -1000mV, -1200mV
applied, erosion-corrosion effect is successively weakened corresponding to the mass loss test, but caused worse mechanical properties, material removal was accelerated because of hydrogen evolution and hydrogen permeation[20,21].
5. CONCLUSIONS
Q235 and ZG06Cr13Ni4Mo was investigated as samples by submitting to cavitation erosion-corrosion, the results permit the following results:
At open circuit potential and with -800mV, -1000mV, -1200mV applied, CPE values changed over time and could be used as indication of surface roughness, but different characteristic trend occurred when applied potential reached to a critical value.
Rct decreased from the beginning to 8 h at open circuit potential and became larger within 8
hours of experiment with -800mV applied for both materials. However with -1000mV and -1200mV applied, Rct remained almost constant and no obvious changes were observed.
The changes of Rct could be well explained by mixed-potential reaction theory for both Q235
and ZG06Cr13Ni4Mo.
ACKNOWLEDGEMENTS
The authors wish to acknowledge the financial support of the National Natural Science Foundation of China (No.51131007, No. 51371124), the Major State Basic Research Development Program (973 Program) (Granted No. 2014CB046805)and Natural Science Foundation of Tianjin (No. 14JCYBJC17700).
References
1. R.M. Fernández-Domene, E. Blasco-Tamarit, D.M. García-García, J. García-Antón, Electrochimica Acta 58 (2011) 264-275
2. Willyam R.P. Barros, Juliana R. Steter, Marcos R.V. Lanza, Artur J. Motheo. Electrochimica Acta 143 (2014) 180–187
3. L. Marchetti, E. Herms, Int. J. Hydrogen. Energ. 36 (2011) 15880 4. Tomlison W J, Talks M G, J. Triblo. Int., 24 (1991) 67
5. S.Z. Luo, Y.G. Zheng, M.C. Li, Z.M. Yao, W. Ke, Corrosion 59 (2003) 597-605 6. S.L. Jiang, Y.G. Zheng, Z.M. Yao, Corros. Sci. 48 (2006) 2614-2632
8. J.Ryl, K. Darowicki, J. Electrochem. Soc. 155 (2008) P44-P49 9. J.Ryl, K. Darowicki, P. Slepski, Corros. Sci. 53 (2011) 1873-1879
10.S.S. Rajahram, T.J. Harvey, J.C. Walker, S.C. Wang, R.J.K. Wood, Tribol. Int.46 (2012) 161-173 11.J.I. Ukpai, R. Barker, X. Hu, A. Neville, Tribol. Int. 65 (2013) 161-170
12.H.X. Guo, B.T. Lu, J.L. Luo, Electrochem. Acta 51 (2005) 315-323.
13.H.X. Hu, S.L. Jiang, Y.S. Tao, T.Y. Xiong, Y.G. Zheng, Nucl. Eng. Des. 241 (2011) 4929-4937. 14.L. Li, D.Y. Li, Wear 271 (2011) 1404-1410.
15.Z.Yao, Z.Jiang, F.Wang, Electrochim. Acta. 52 (2006) 4539-4546. 16.C.H.Kim, S.I. Pyun, J.H. Kim, Electrochim. Acta. 48 (2003) 345-354. 17.T. Nickchi, A. Alfantazi, Electrochim. Acta 58 (2011)743-749.
18.C. N. Cao, J. Zhang, An introduction to electrochemical impedance spectroscopy, Science Beijing, China 2002.
19.Yugui Zheng, Suzhen Luo, Wei Ke, Wear 262(2007) 1308-1314. 20.Y.G. Zheng, S.Z. Luo, W. Ke, Triblo. Int. 41(2008) 1181-1189.
21.B.T. Lu, W.S. Li, J.L. Luo, S. Chiovelli, J. Mater. Sci. 47 (2012) 6823–6834.