This is a repository copy of Summary vision screening data : Iceland. White Rose Research Online URL for this paper:
http://eprints.whiterose.ac.uk/148020/ Version: Published Version
Monograph:
Mazzone, P. orcid.org/0000-0003-0944-8031, Carlton, J. orcid.org/0000-0002-9373-7663 and Griffiths, H. orcid.org/0000-0003-4286-5371 (2019) Summary vision screening data : Iceland. Report. Vision Screening Country Reports . EUScreen
©2019 EUScreen. For reuse permissions, please contact the publisher.
[email protected] https://eprints.whiterose.ac.uk/
Reuse
Items deposited in White Rose Research Online are protected by copyright, with all rights reserved unless indicated otherwise. They may be downloaded and/or printed for private study, or other acts as permitted by national copyright laws. The publisher or other rights holders may allow further reproduction and re-use of the full text version. This is indicated by the licence information on the White Rose Research Online record for the item.
Takedown
If you consider content in White Rose Research Online to be in breach of UK law, please notify us by
Summary Vision Screening Data: Iceland
Produced as part of Work Package 3
Paolo Mazzone1, Dr Jill Carlton2, Dr Helen Griffiths3
1. Research Assistant, School of Health and Related Research, University of Sheffield, United Kingdom (UK) 2. Senior Research Fellow, School of Health and Related Research, University of Sheffield, United Kingdom
(UK)
3. Senior Lecturer, Academic Unit of Ophthalmology and Orthoptics, University of Sheffield, United Kingdom (UK)
Information provided by Dr Elinborg Gudmundsdottir (Paediatric Ophthalmologist, University of Iceland)
21st December 2018
Disclaimer: This is a summary report representing the responses from a country representative working within eye care services of the country reported. This report does not represent conclusions made by the authors, and is the product of professional research conducted for the EUSCREEN study. It is not meant to represent the position or opinions of the EUSCREEN study or its Partners. The information cannot be fully verified by the
authors and represent only the information supplied by the country representatives.
T E U H
ii
Contents
1 Glossary of Terms: Vision Screening iii
2 Abbreviations vi
3 Population and Healthcare Overview 1
4 Vision Screening Commissioning and Guidance 3
5 Screening programme 4
5.1 Vision screening - Preterm babies 4
5.2 Vision screening - Birth to 3 months 4
5.3 Vision screening - 3 months to 36 months 4
5.4 Vision screening - 36 months to 7 years 5
6 Automated Screening 9
7 Provision for Visually Impaired 10
8 Knowledge of existing screening programme 11
8.1 Prevalence/Diagnosis 11
8.2 Coverage 11
8.3 Screening evaluation 11
8.4 Treatment success 11
9 Costs of vision screening in children 12
9.1 Cost of vision screening 12
9.2 Cost of treatment for amblyopia 12
9.3 Cost of Treatment for strabismus 12
9.4 Cost of treatment for cataract 12
iii
1 Glossary of Terms: Vision Screening
Abnormal test result A
detected under good conditions. The result on screening
Attendance rate The proportion of all those invited for screening that are tested and receive a result:
Invited for screening includes all those that are offered the screening test.
T
Attendance rate provides information on the willingness of families to participate in screening.
Compliance with referral (percentage)
The percentage of those who are referred from screening to a diagnostic assessment that actually attend the diagnostic assessment.
Percentage of compliance provides information on the
willingness of families to attend the diagnostic assessment after referral from screening.
Coverage The proportion of those eligible for screening that are tested and receive a result:
Eligible for screening includes those within the population that are covered under the screening or health care programme.
Tested and
Factors such as being offered screening, willingness to
participate, missed screening, ability to complete the screen, and ability to document the screening results will influence the coverage.
False negatives The percentage of children with a visual deficit (defined by the
iv
False positives The percentage of children with normal vision that are referred from screening to a diagnostic assessment.
Guidelines Recommendations or instructions provided by an authoritative body on the practice of screening in the country or region.
Vision screening professional
A person qualified to perform vision screening, according to the practice in the country or region.
Inconclusive test result
A
detected due to poor test conditions or poor cooperation of the child.
Invited for screening Infants/children and their families who are offered screening.
Outcome of vision screening
An indication of the effectiveness or performance of screening, such as a measurement of coverage rate, referral rate, number of children detected, etc.
Untreated amblyopia Those children who have not received treatment for amblyopia due to missed screening or missed follow-up appointment.
Persistent amblyopia Amblyopia that is missed by screening, or present after the child has received treatment.
Positive predictive value
The percentage of children referred from screening who have a confirmed vision loss.
For example, if 100 babies are referred from screening for diagnostic assessment and 10 have normal vision and 90 have a confirmed visual defect, the positive predictive value would be 90%.
Prevalence The percentage or number of individuals with a specific disease or condition. Prevalence can either be expressed as a percentage or as a number out of 1000 individuals within the same
demographic.
Programme An organised system for screening, which could be based nationally, regionally or locally.
Protocol Documented procedure or sequence for screening, which could include which tests are performed, when tests are performed, procedures for passing and referring, and so forth.
Quality assurance A method for checking and ensuring that screening is functioning adequately and meeting set goals and benchmarks.
Referral criteria A pre-determined cut-off boundary for when a child should be re-tested or seen for a diagnostic assessment.
Risk babies / Babies at-risk
v
Two common risk factors are admission to the neonatal-intensive care unit (NICU) or born prematurely. However, other risk factors for visual defects may also be indicated in the screening
programme.
Sensitivity The percentage of children with visual defects that are identified via the screening programme.
For example, if 100 babies with visual defects are tested, and 98 of these babies are referred for diagnostic assessment and 2 pass the screening, the sensitivity is 98%.
Specificity The percentage of children with normal vision that pass the screening.
For example, if 100 babies with normal vision are tested, and 10 of these babies are referred for diagnostic assessment and 90 pass the screening, the specificity is 90%.
Target condition The visual defect you are aiming to detect via the screening programme.
vi
2 Abbreviations
ACT Alternating Cover Test
AR Autorefraction
AS Automated Screening
CT Cover Test
CV Colour Vision
EI Eye Inspection
EM Eye Motility
Fix Fixation
GDP Gross Domestic Product
GP General Practitioner
Hir Hirschberg test
NICU Neonatal-intensive care unit
PM Pursuit Movements
PPP Purchasing Power Parity
PR Pupillary Reflexes
RE Retinal Examination
ROP Retinopathy of Prematurity
RR Red Reflex Testing
SV Stereopsis
VA Visual Acuity
1
3 Population and Healthcare Overview
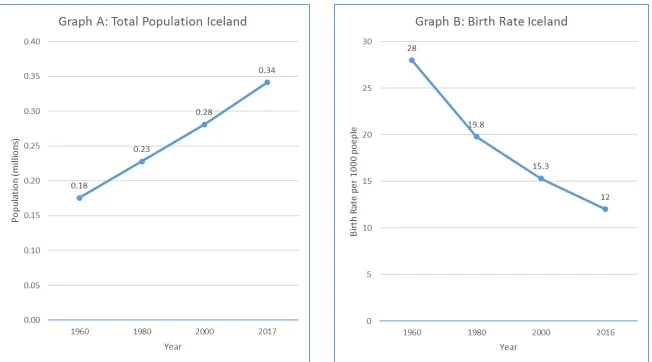
The population of Iceland is 341,284 (World Bank, 2018a) and a birth rate estimated at 12 births/1,000 population in 2016 (World Bank, 2018b). The change in population and birth rate from 1960 to 2017 is shown in Figure 1, graphs A and B respectively.
Iceland has an estimated population density of 3.4 people per square kilometre in 2017 and this has increased from 1.8 people per square kilometre in 1961 (World Bank, 2018c). In terms of healthcare facilities, the total density of hospitals in 2013 was 3.64 per 100,000 population (WHO, 2016a). Infant mortality in 2017 is estimated at 1.6 deaths/1,000 live births in total (World Bank, 2018d).
[image:9.842.77.729.105.467.2]
2
Figure 1: Change in the Total Population and Birth Rate in Iceland between 1960 and 2017
3
4 Vision Screening Commissioning and Guidance
In Iceland, there are national guidelines for conducting vision screening. Vision screening is funded by the state and is embedded into a general preventative child healthcare screening system. The content of the vision screening programme is decided upon by ophthalmologists and the Public Health Organisation. The vision screening programme began in 1974. Between the years of 1999 and 2009, visual acuity was tested at 3.5 years and 5 years by nurses in primary healthcare centres, but since 2009 visual acuity testing has commenced in children at 4 years old; instead of at 3.5 years and again at 5 years of age. Vision screening is organised nationally, with no regional variation between protocols.
The procedures for vision screening can be found in the national general health screening guidelines. The Directorate of Health regularly updates the guidelines for general screening in children, including vision screening. Updates were completed in 1996, 2009, 2010, 2013 and the last update was in 2016. Regarding the vision screening, recommendations are made by ophthalmologists. The programme has not changed since 2009. There are no methods for quality monitoring of vision screening imposed by the government.
Vision screening is performed by paediatricians, general practitioners (GP) and nurses. It is not known how many vision screening professionals there are per million people. No general professionals have been identified that do not screen, but could do so with additional training. There are specific guidelines in place for nurses, paediatricians and GPs to follow concerning vision screening. It is not known if there is any specific training to perform vision screening.
4
5 Screening programme
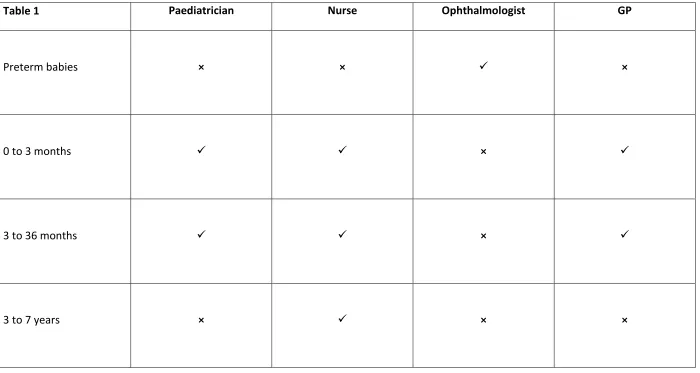
The target conditions screened for by vision screening are retinopathy of prematurity (ROP), congenital cataract, amblyopia, reduced visual acuity, refractive error, colour vision defects, and strabismus. The health care professionals delivering vision screening, venue for screening and tests used vary depending on the age of the child as shown in Tables 1, 2 and 3 respectively. Specific details of the screening offered within each age group are described more fully in sections 5.1 to 5.4 below.
5.1 Vision screening - Preterm babies
Preterm babies up to the age of 3 months are screened by an ophthalmologist in a hospital. The vision screening tests conducted are designed to detect retinopathy of prematurity (ROP). There are no guidelines concerning the number of repeated screens before referral, this is at the discretion of the screener.
5.2 Vision screening - Birth to 3 months
Well, healthy babies aged up to 3 months are screened by either a nurse, paediatrician or a GP in a primary healthcare centre. The vision screening tests conducted include eye inspection, fixation, red reflex testing, cover test, alternating cover test and eye motility. It is only the paediatrician who performs fundus red reflex examination to diagnose a white pupil, the rest of the tests are performed by both paediatrician or a nurse. The sequence of eye screening tests are:
5 days old: Paediatrician eye inspection, red reflex testing
6 weeks old: Nurse and pediatrician or GP - eye inspection, red reflex test, fixation, cover test, alternating cover test and eye motility
9 weeks old: Nurse - eye inspection, red reflex test, fixation, cover test, alternating cover test and eye motility
There are no defined guidelines on how many abnormal and how many inconclusive tests necessitate referral for further diagnostic examination.
5.3 Vision screening - 3 months to 36 months
Children aged 3 to 36 months are screened by either a paediatrician, GP, or a nurse in primary health care centre.
The tests conducted include eye inspection, fixation, red reflex testing, cover test, alternating cover test and eye motility; this is recommended at every visit. The sequence of vision screening are:
3 months old: Nurse and pediatrician or GP.
5
6 months old: Nurse
8 months old: Nurse
10 months old: Nurse and pediatrician or GP
12 months old: Nurse
18 months old: Nurse and pediatrician or GP
2.5 years old: Nurse
5.4 Vision screening - 36 months to 7 years
Children aged 36 months to 7 years are screened by a nurse in a primary healthcare centre or schools. The tests conducted include eye inspection, fixation, eye motility, cover test, alternating cover test, visual acuity measurement and stereopsis (Titmus or Lang). The visual acuity measurement and stereopsis are both conducted from 4 years of age. The same optotype charts are used and all visual acuity measurements are conducted by nurses.
The optotype charts used for visual acuity measurement include Lea symbols (logMAR) and HOTV (Crowded linear test): referral criteria are visual acuity of less than 0.8 decimal (0.3 logMAR, 6/12 Snellen). Visual acuity is measured again at school age (6 years) with referral criteria of less than 1.0 decimal (0.00 logMAR, 6/6 Snellen), and again at 9, 12 and 14 years of age (referral criteria of less than 1.0 decimal (0.00 logMAR, 6/6 Snellen).
6
[image:13.842.75.775.107.480.2]Table 1: Healthcare professionals who conduct vision screening in each age group.
Table 1 Paediatrician Nurse Ophthalmologist GP
Preterm babies × × ×
0 to 3 months ×
3 to 36 months ×
7
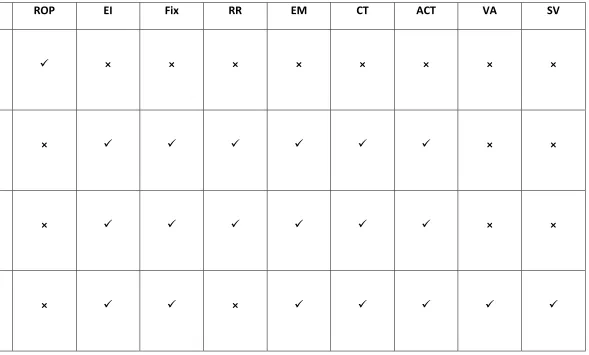
[image:14.842.185.774.107.462.2]Table 2: Vision screening tests used in vision screening for each age group.
Table 2 ROP EI Fix RR EM CT ACT VA SV
Preterm babies × × × × × × × ×
0 to 3 months × × ×
3 to 36 months × × ×
3 to 7 years × ×
8
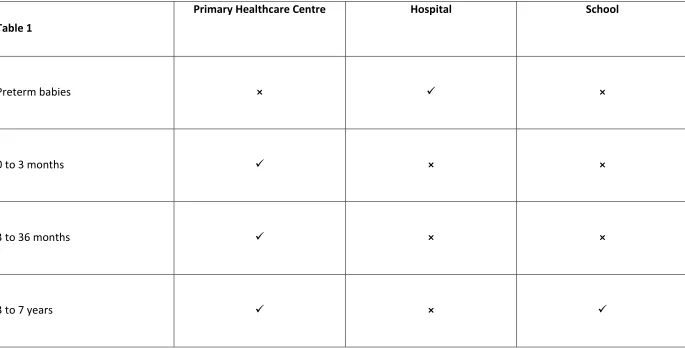
[image:15.842.82.767.123.471.2]Table 3: Location of vision screening for each age group.
Table 1
Primary Healthcare Centre Hospital School
Preterm babies × ×
0 to 3 months × ×
3 to 36 months × ×
9
6 Automated Screening
10
7 Provision for Visually Impaired
11
8 Knowledge of existing screening programme
8.1 Prevalence/Diagnosis
The prevalence of treated or untreated amblyopia by the age of 7 years is unknown, there are no published studies on this issue. The prevalence of persistent amblyopia (missed by screening or failed treatment) by the age of years is also unknown. The prevalence of strabismus is unknown, there has been no study investigating this. There is no data available concerning the incidence of the four types of amblyopia (strabismic, refractive, combined mechanism and deprivation), per age, per year in Iceland.
8.2 Coverage
It is estimated that between 90% and 100% of children are invited for vision screening in Iceland; administrative personnel send invitations. The coverage of vision screening, before the age of 7 years, is estimated at 95%. The coverage of visual acuity measurements as part of vision screening, before the age of 7 years, is estimated that 95% and of those 95% attend this appointment.
8.3 Screening evaluation
The percentage of false negatives for vision screening is estimated at less than 10%. The percentage of false positives is estimated at 10%.. The positive predictive value (PPV) of a refer result is not known. The sensitivity and specificity of vision screening is unknown
8.4 Treatment success
12
9 Costs of vision screening in children
9.1 Cost of vision screening
The salary costs per year for vision screening professionals is not provided. The cost to train general preventative child healthcare screening professionals that have been specified, between leaving secondary education to qualification, is not provided. The total screening costs, per year, for vision screening and the total costs, per child per year, for vision screening is not provided.
9.2 Cost of treatment for amblyopia
The estimated costs for treatment of typical patients, with refractive amblyopia and strabismic amblyopia including follow up is unknown.
9.3 Cost of Treatment for strabismus
The estimated costs for strabismus surgery including follow up is unknown.
9.4 Cost of treatment for cataract
The estimated costs for congenital cataract surgery, glasses, patching and follow-up of deprivation amblyopia are not available.
13
10 References
The World Bank (2018a). Population, total | Data. [online] Available at: https://data.worldbank.org/indicator/SP.POP.TOTL?locations=IS [Accessed 13 December 2018].
The World Bank. (2018b). Birth rate, crude (per 1,000 people) | Data. [online] Available at: https://data.worldbank.org/indicator/SP.DYN.CBRT.IN?locations=IS [Accessed 13 December 2018].
The World Bank. (2018c). Population density (people per sq. km of land area) | Data. [online] Available at: https://data.worldbank.org/indicator/EN.POP.DNST?locations=IS [Accessed 13 December 2018].
The World Bank. (2018d). Mortality rate, infant (per 1,000 live births) | Data. [online] Available at: https://data.worldbank.org/indicator/SP.DYN.IMRT.IN?locations=IS [Accessed 13 December 2018].
The World Bank. (2018e). Life expectancy at birth, total (years) | Data. [online] Available at: https://data.worldbank.org/indicator/SP.DYN.LE00.IN?locations=IS [Accessed 13 December 2018].
The World Bank. (2018f). Death rate, crude (per 1,000 people) | Data. [online] Available at: https://data.worldbank.org/indicator/SP.DYN.CDRT.IN?locations=IS [Accessed 13 December 2018].
World Health Organisation (WHO). (2016a). Health Infrastructure - Data by country. [ONLINE] Available at: http://apps.who.int/gho/data/view.main.30000. [Accessed 13 December 2018].