ISSN 0252-8266
O
o
o
ÍN
D
Eurostatistik
Daten zur Konjunkturanalyse
M o n a t l i c h
Eurostatistics
Data for short-term economic analysis
M o n t h l y
Eurostatistiques
Données pour l'analyse de ia conjoncture
D E
Eurostat hat den Auftrag, der
Europäischen Union
einen qualitativ hochwertigen statistischen Informationsdienst bereitzustellen
Eurostat-Reihen:
ein an den Bedarf aller Nutzer angepaßtes Angebot.
Pressemitteilungen:
Sie enthalten die Schlüsselzahlen zur EU,
zu ihren Mitgliedstaaten und ihren Partnern. Die Pressemitteilungen
werden kostenlos zur Verfügung gestellt. Unmittelbar nach ihrer
Veröffentlichung sind sie auch im Internet zu finden:
www.europa.eu.int/comm/eurostat/
Statistik kurzgefaßt:
aktuelle Zusammenfassungen der
wichtigsten Ergebnisse von statistischen Erhebungen, Studien und
Analysen.
Schlüsselindikatoren:
Diese Reihe enthält in einem handlichen
Buch von maximal 100 Seiten die wichtigsten Indikatoren zu einem
Themenbereich oder einem Teilbereich.
Panorama der Europäischen Union:
In dieser Reihe geht
es um die Merkmale und Trends in multisektoralen
Themenbereichen oder sektoralen Teilbereichen.
Methoden und Nomenklaturen:
Diese Veröffentlichunger
richten sich an Fachleute; sie beschreiben die Methoden und
Systematiken, die für einzelne Themen, Themenbereiche oder
Sektoren verwendet werden.
Detaillierte Tabellen:
Diese Veröffentlichungen richten sich ¡
Fachleute; darin sind ein Teil oder die Gesamtheit der statistischen
Angaben zu einem Thema, Themenbereich oder Sektor zu finden.
Studien und Forschung:
Zusammenfassungen der Ergebnis:
von Studien und Forschungsarbeiten im Bereich der europäischen
Statistik.
Kataloge:
Die kostenlosen Kataloge informieren rasch und gen<
über das Produkt- und Dienstleistungsangebot von Eurostat.
Our mission is to provide the
European Union
with a high-quality statistical information service
Eurostat's collections
are adapted to the needs of all users.
EM
Press releases:
key figures on the EU, the Member States and
their partners. They are provided free of charge. They are also
available on the Internet as soon as they are published:
www.europa.eu.int/comm/eurostat/.
Statistics in focus:
up-to-date summaries of the main results
of statistical surveys, studies and analyses.
Methods and nomenclatures
are intended for specialists
who want to consult the methodologies and nomenclatures used
for a theme, a sub-theme or a sector.
Detailed tables:
statistical data for specialists compiled on a
theme, sub-theme or sector.
Key indicators:
the main indicators on a theme or sub-theme in
Studies and research
summarise the results of European
an easy-to-carry booklet.
statistical studies and research and are intended for specialists.
Panorama of the European Union:
highlights the features
Catalogues:
free of charge rapid access to concise information
and trends of a multi-sectoral theme or a sectoral sub-theme. on Eurostat's products and services.
Notre mission est de fournir à
l'Union européenne
un service d'information statistique de qualité
Les collections d'Eurostat
sont une offre adaptée aux besoins de tous les utilisateurs.
FR
Communiqués de presse:
les chiffres clés sur l'UE, les États
membres et leurs partenaires. Ils sont distribués gratuitement et
sont également disponibles sur Internet dès leur publication.
Statistiques en bref:
synthèses actualisées des principaux
résultats des enquêtes, des études et des analyses statistiques.
Méthodes et nomenclatures:
les méthodologies et les
nomenclatures relatives à un thème, un sous-thème ou un secteur
o
o
o
Eurostatistik
Daten zur Konjunkturanalyse
M o n a t l i c h
Eurostatistics
Data for short-term economic analysis
M o n t h l y
Eurostatistiques
Données pour l'analyse de ia conjoncture
D E
Unmittelbarer Zugriff auf harmonisierte statistische Daten
E u r o s t a t D a t a Shops:
I n t e r n e t :
bieten ein umfassendes Angebot an
„maßgeschneiderten"
Dienstleistungen:
·*· eine unmittelbare Bearbeitung von Informationsanfragen;
* eine garantiert schnelle und individuelle Antwort;
• Wahl des Trägers, auf dem die statistischen Daten geliefert
werden.
Informationen können telephonisch, schriftlich, per Fax oder per
E-Mail angefragt werden.
Die wesentlichen statistischen Nachrichten aus der
Gemeinschaft
* Euro-Indikatoren: über 100 harmonisierte, vergleichbare
und kostenlose Indikatoren der Eurozone;
* Pressemitteilungen: direkter Zugriff auf alle
Pressemitteilungen von Eurostat.
Weitere Informationen finden sich auf der Internet-Site unter
www.europa.eu.int/comm/eurostat/
Immediate access to harmonized statistical data
E N
E u r o s t a t D a t a S h o p s :
I n t e r n e t :
provide a wide range of
tailor-made services:
*· immediate information searches
* rapid and personalised response
* choice of data carrier
Information can be requested by phone, mail, fax or e-mail.
Essentials on Community statistical news
* Euro indicators: more than 100 indicators on the
euro-zone; harmonized, comparable, and free of charge;
* Press releases: direct access to all Eurostat press releases.
For further information, visit us on the Internet at:
www.europa.eu.int/comm/eurostat/
Accès immédiat à des données statistiques harmonisées
FR
E u r o s t a t D a t a S h o p s :
I n t e r n e t :
offrent un large éventail de prestations
«sur mesure»:
* la prise en charge immédiate de toute recherche d'information,
* la garantie d'une réponse rapide et personnalisée,
* le choix du support de fourniture des données.
Les informations peuvent être demandées par téléphone, par courrier,
par télécopie ou par courrier électronique.
l'essentiel de l'actualité statistique communautaire
+
Euro-indicateurs: plus de cent indicateurs sur la zone euro
(harmonisés, comparables et disponibles gratuitement).
•k Communiqués de presse: accès direct à tous les
communiqués de presse d'Eurostat.
Pour plus d'informations, visitez le site Internet d'Eurostat:
www.europa.eu.int/comm/eurostat/
Zahlreiche weitere Informationen zur Europäischen Union sind verfügbar über Internet,
server Europa (http://europa.eu.int).
A great deal of additional information on the European Union is available on the Internet.
It can be accessed through the Europa server (http://europa.eu.int).
De nombreuses autres informations sur l'Union européenne sont disponibles sur Internet
via le serveur Europa (http://europa.eu.int).
=¿£
eurosta
EUROSTAT
L-2920 Luxembourg — Tél. (352) 43 01 -1 — Télex COMEUR LU 3423
Rue de la Loi 200, B-1049 Bruxelles — Tél. (32-2) 299 11 11
D E
Eurostat ist das Statistische
Amt der Europäischen
Gemeinschaften. Es hat den Auftrag,
die Union mit europäischen
Statistiken zu versorgen, die
Vergleiche zwischen Ländern und
Regionen ermöglichen. Eurostat
konsolidiert und harmonisiert die in
den Mitgliedstaaten erhobenen
Daten.
Um die weite Verbreitung der
gewaltigen verfügbaren Datenmenge
zu gewährleisten und den einzelnen
Nutzern zu helfen, diese
Informationen richtig zu verwenden,
hat Eurostat sein
Veröffentlichungs-und Dienstleistungsprogramm
geschaffen. Um sich gezielt an das
breite Publikum oder an Fachleute
wenden zu können, wurden für die
einzelnen Nutzergruppen spezielle
Reihen entwickelt.
Im Rahmen des neuen Programms
hat Eurostat eine Web-Site
entwickelt. Sie umfaßt ein breites
Angebot von Online-Informationen
über die Erzeugnisse und
Dienstleistungen, Pressemitteilungen,
Kataloge, Online-Veröffentlichungen
sowie Indikatoren für die Eurozone.
ERI
Eurostat is the Statistical Office
of the European Communities.
Its task is to provide the European
Union with statistics at a European
level, that allow comparisons to be
made between countries and
regions. Eurostat consolidates and
harmonizes the data collected by the
Member States.
To ensure that the vast quantity of
accessible data is made widely
available, and to help each user
make proper use of the information,
Eurostat has set up a publications
and services programme.
As part of the new programme
Eurostat has developed its website.
It includes a broad range of on-line
information on Eurostat products and
services, newsletters, catalogues,
on-line publications as well as
indicators on the euro-zone.
Yves Franchet
Director-General
F R
Eurostat est l'Office statistique
des Communautés
européennes. Il a pour tâche de
fournir à l'Union européenne des
statistiques au niveau européen,
qui permettent des comparaisons
entre pays et régions. Eurostat
consolide et harmonise les données
collectées par les États membres.
Pour assurer que l'ensemble des
données disponibles soit largement
accessible et pour aider chaque
utilisateur à faire bon usage de
toute cette information, Eurostat a
mis en place un programme de
publications et de services.
Dans le cadre du nouveau
programme, Eurostat a développé
son site Internet. Celui-ci comprend
toute une série d'informations
en ligne sur les produits et les
services d'Eurostat, ses bulletins
d'information, ses catalogues et ses
publications en ligne ainsi que des
indicateurs sur la zone euro.
Yves Franchet
Directeur-Général
SEITE - PAGE - PAGE
VORWORT
FOREWORD
AVANT-PROPOS
ZEICHEN UND ABKÜRZUNGEN
SYMBOLS AND ABBREVIATIONS
SIGNES ET ABREVIATIONS
SCHAUBILDER : siehe ausführliche Aufstellung Seite 1
GRAPHICS
: see detailed list
on
page
1
GRAPHIQUES : voir liste détaillée page I
TABELLEN : siehe ausführliche Aufstellung Seite Ml
TABLES : see detailed list
on
page
III
TABLEAUX : voir liste détaillée page III
Volkswirtschaftliche Gesamtrechnungen ESVG 95
National accounts ESA 95
Comptes nationaux SEC 95
Beschäftigung
Employment
Emploi
Arbeitslosigkeit
Unemployment
Chômage
Industrie
Industry
Industrie
Energie
Energy
Energie
D i e n s t l e i s t u n g e n
Services
Services
Landwirtschaftliche Erzeugnisse
Agricultural products
Produits agricoles
Außenhandel
External trade
Commerce extérieur
Verbraucherpreise
Consumer prices
Prix à la consommation
Agrarpreisindizes
Indices of agricultural prices
Indices des prix agricoles
Finanzstatistiken
7
8
9
29
31
45
57
63
87
93
101
107
135
145
Mit der monatlich erscheinenden Veröffentlichung
Eurostatistik - Daten zur
Konjunkturanalyse
werden innerhalb kürzester Frist die neuesten statistischen Daten über
die Europäische Union und die Eurozone als Ganzes, über jedes Mitgliedsland sowie über
die Vereinigten Staaten und Japan bekanntgegeben.
Eurostatistik - Daten zur Konjukturanalyse
enthält die wichtigsten, bei Eurostat verfügbaren
Statistiken zur konjunkturellen Entwicklung.
Die Publikation wurde im Umfang bewußt klein gehalten und enthält keine Anmerkungen
zur Methodik, die im übrigen in den spezialisierten Veröffentlichungen von Eurostat zu finden
sind.
Eurostatistik - Daten zur Konjunkturanalyse
enthält keine Kommentare. Dafür werden die
wichtigsten Daten in der Veröffentlichungsreihe "Statistik kurzgefaßt" kommentiert.
Die veröffentlichten Daten stammen aus der Referenz-Datenbank New Cronos.
Diese Daten sind, ebenso wie die Zeitreihen, auch in elektronischer Form verfügbar, und
zwar in der Domain EUR 2 von New Cronos.
FOREWORD
Eurostatistics
-
data for short-term economic analysis
is a monthly publication aimed at
providing, as rapidly as possible, the latest statistical data on the European Union and the
euro-zone as a whole, each Member State, the United States and Japan.
Eurostatistics - data for short term economic analysis
presents the most relevant statistics
on the economic situation held by Eurostat.
The publication is deliberately streamlined and does not contain any methodological notes,
which are given in Eurostat's specialized publications.
Eurostatistics - Data for short-term economic analysis
does not include comments.
For this, Statistics in focus will comment on the most important data.
The data presented are taken from Eurostat's on-line database, New Cronos, Eurostat's
reference environment. These data, as well as the chronological series, are also available in
electronic form, this being the EUR 2 domain in New Cronos.
AVANT-PROPOS
Eurostatistiques - Données pour l'analyse de la conjoncture
est une publication mensuelle
qui a pour but de fournir dans les meilleurs délais les données statistiques les plus récentes
pour l'Union européenne et la zone Euro en tant qu'ensembles, pour les pays membres
ainsi que pour leurs principaux partenaires extra-communautaires (Etats-Unis d'Amérique
et Japon).
Eurostatistiques - Données pour l'analyse de la conjoncture
reprend les statistiques les plus
importantes sur la situation économique disponibles auprès d'Eurostat.
Cette publication ne comporte pas de notes méthodologiques. Elles sont disponibles dans
les publications spécialisées d'Eurostat.
Eurostatistiques - Données pour l'analyse de la conjoncture
ne comprend pas de
commentaires. Par contre, les données les plus importantes sont commentées dans la
collection "Statistiques en bref".
Les données présentées proviennent de la base de données New Cronos environnement
de référence d'Eurostat.
S Y M B O L S A N D S I G N E S E T
ABBREVIATIONS ABRÉVIATIONS
0
Weniger als die Hälfte der
verwendeten Einheit
%
Prozent
T/T—1 %
Prozentualer Zuwachs
eines Vierteljahres gegenüber
dem vorhergehenden
Vergleichszeitraum
(Monat,Vierteljahr,Jahr)
Data less than the unit used
Per cent
Percentage increase of
one period (month,
quarter, year) on the
corresponding previous
period
Donnée inférieure à la moitié
de l'unité utilisée
Pourcentage
Accroissement en
pourcentage d'une période
(mois, trimestre ou année) sur
la periode précédente
π τ - 1 2 %
1990=100
1000
Mio
M r d B n M r d
t
tJ (GCV)
GWh
USD
ECU
SZR S D R D T S
SITCSITCCTCI
EU15
Prozentualer Zuwachs
eines Monats gegenüber
dem entsprechenden
Monat des Vorjahres
Basisjahr
in 1000
Million
Milliarde
Metrische Tonne
Terajoule = 10
9kJ
Gigawattstunde = 10
6kWh
US-Dollar
Europäische Währungseinheit
Sonderziehungsrechte
Standard International Trade
Classification
Mitgliedstaaten insgesamt
Percentage increase on
the corresponding month
of the previous year
Reference year
Thousand
Million
Thousand million
Ton
Terajoule=109kJ
Gigawatt hour (= 106kWh)
US dollar
European currency unit
specail drawing rights
Standard international
trade classification
Total of Member States
of the EU
Accroissement en
pourcentage d'un mois sur le
mois correspondant de l'année
précédente
Année de base
Millier
Million
Milliard
Tonne métrique
Terajoule = 109kJ
Gigawattheure = 106kWh
Dollar US
Unité monétaire européenne
Droits de tirages spéciaux
Classification type pour le
commerce international
Ensemble des États membres
de l'UE
EUR11
B/L
A K P A C P A C P
B I P G D P P I B
OPECOPECOPEP
EGKSECSCCECA
ESVGESASEC
tRöetoetep
Wirtschafts- und
Währungsunion (B, D, E, F,
IRL, I, L, NL, A, Ρ, FIN)
Belgisch-Luxemburgische
Wirtschaftsunion
Länder Afrikas,
der Karibik und des
Pazifiks - Abkommen
von Lomé
Bruttoinlandsprodukt
Organisation der
erdölexportierenden
Länder
Europäische Gemeinschaft
für Kohle und Stahl
Europäische System
Volkswirtschaftlicher
Gesamtrechnungen
Tonne Rohöleinhiet
Economic Monetary Union (B,
D, E, F, IRL, I, L, NL, A, P, FIN)
Belgo-Luxembourg
economic union
African, Caribbean and Pacific
countries of the
Lomé Convention
Gross domestic product
Organization of petroleum
exporting countries
European coal and steal
community
Union Monétaire Economique
(Β, D, E, F, IRL, I, L, NL, Α, Ρ,
FIN)
Union économique
belgo-luxembourgeoise
États d'Afrique, des Caraïbes
et du Pacifique - Convention
de Lomé
Produit intérieur brut
Organisation des pays
exportateurs de pétrole
Communauté européenne du
charbon et de l'acier
European System of Accounts
Système Européen des
Comptes
\J>
Graphics
SCHAUBILDER
GRAPHICS
GRAPHIQUES
m
#
Bruttoinlandsprodukts
ESVG95
Gross domestic product
ESA95
Produit intérieur brut
SEC95
eurostat
g
- . | (Volumenindex 1995=100)
(Volume index 1995=100)
(Indice de volume 1995=100)
■ ' . _ : : ■ ' . . .
EU-15
-h
EUR-11
■JPN
■USA
120
115
S
/
110
105
100
95
90
SCHAUBILDER
GRAPHICS
GRAPHIQUES
■ , j
f m
Bruttoinlandsprodukts
Gross domestic product
Produit intérieur brut
ΗVi
\j\
ESVG95
ESA95
SEC95
(Volumenindex 1995=100)
(Volume index 1995=100)
(Indice de volumel 995=100)
eurostat
1996
1997
1998
1999
EU-15
Belgique/België
1996
1997
1998
1999
EU-15
Danmark
0102
1996
I I
1997
EU-15
1998
1999
L
-i
Deutschland
1996
1997
1998
1999
EU-15
3
Espana
FRANC
SCHAUBILDER
GRAPHICS
GRAPHIQUES
~3Δ
01
eurostat
Bruttoinlandsprodukts
ESVG95
(Volumenindex 1995=100)
Gross domestic product
Produit intérieur brut
ESA95
SEC95
(Volume index 1995=100)
(Indice de volume 1995=100)
0102
1996
1997
1998
1999
1996
1997
1998
1999
EU-15
Nederland
EU-15
Osterreich
0102
1996
I
1 EU-15
1997
UL
1998
I Pnrtnqql
1999
1996
1997
1998
1999
r = i
EU-15
ι
ι Suomi/Finland
SVERIGE
0102
1996
1997
1998
1999
120 -,
118
116
114
112
110
108
106
104
102
100
-UNITED KINGDOM
0102
SCHAUBILDER
GRAPHICS
GRAPHIQUES
W.
06
eurostat
Arbeitslosenquoten
insgesamt - saisonbereinigt
Unemployment rates total
seasonally adjusted
Taux de chômage total
désaisonnalisé
25
20
15
10
5
0
BELGIQUE/BELGIE
1996
1997
EU-15
F = ^ 1 EUR-11
0601
1998
1999
Belgique/België
DANMARK
25
20
15
10 -f
5
-0601
1996 I b U - 1 5
1997 I I b U H - 1 1
1998 1999
ι J Uanmark
25-1
2 0
1 5
-10
5
-0601
υ -
1996= 1 Fl 1-1 5
1997
I I b U H - 1 1
1998 1999
ι. : ι Deutschland
25 -,
2 0
15
10
5
η
-ESPANA
0601
■
1 1 1
1996
1997
1998
1999
Γ = Ί EU-15 Γ ^ ^ Ί EUR-11
Espana
FRANCE
25 η
20
15
SCHAUBILDER
GRAPHICS
GRAPHIQUES
Wå
06
eurostat
Arbeitslosenquoten
insgesamt - saisonbereinigt
Unemployment rates total
seasonally adjusted
Taux de chômage total
désaisonnalisé
IRELAND
25 -,
20
-15
10
5
-0601
ITALIA
25 -,
20
1 5
-io -;
0601
1996
I
I EU-15
1997
I
I RJH-11
1998
1999
Irsland
1996
I
I EU-15
1997
I
I bUH-11
1998
Italia
1999
25
20
15
10
5
-EMBOUF
0601
1996
1997
1998
1999
E==D EU-15
r ^ ^ l
EUR-11
Luxembourg
NEDERLAr
25
20
15
10
5
-0601
1996
I — I EU-15
1997
I - - - I hUH-11
1998
|
1
1999
Nederland
ÖSTERREIC
25
20
15
10
-0601
25 -η
2 0
1 5
SCHAUBILDER
GRAPHICS
GRAPHIQUES
ΈΔ
Arbeitslosenquoten Unemployment rates total Taux de
chômage total
eurostat
insgesamt - saisonbereinigt
seasonally adjusted
désaisonnalisé
SUOMI/FINLAND
0601
SVERIGE
0601
1996
I
1 EU-15
1997
I - - - I EUR-11
1998
I
I
1999
1996
I
1 EU-15
1997
I
I hUH-11
1998
I I
1999
Sverige
25
20
15
10
-UNITED KINGDOM
0601
25
20
15
10
-0 Λ
|
1996
EU-15
1997
I - - - I hUR-11
1998
1999
ι
ι
United Kingdom
USA
0601
1996
I
1 EU-15
1997
I
I hUH-11
1998
I I
USA
1999
25
20
15
10
5
-0601
SCHAUBILDER
GRAPHICS
GRAPHIQUES
IS
eurostat
Industrielle Produktion
Industrie insgesamt
(ohne Baugewerbe)
Trend 1995=100
Industrial production
Total industry
(excluding construction)
Trend 1995=100
Production industrielle
Ensemble de I'indudstrie
(sans bâtiment)
Tendance 1995=100
NACE Rev.1 C-E
EU-15
-A
EUR-11
■USA
-JPN
125
120
115
* - " - - . " *
110
105
100
95
SCHAUBILDER
GRAPHICS
GRAPHIQUES
m
07
■ m e t a t
eurostat
Industrielle Produktion
Industrie insgesamt
(ohne Baugewerbe)
Trend 1995=100
Industrial production
Total industry
(excluding construction)
Trend 1995=100
Production industrielle
Ensemble de I'indudstrie
(sans bâtiment)
Tendance 1995=100
BELGIQUE/BELGIË
DANMARK
0701
S98 098 N98 D98 J99 F99 M99 A99 M99 J99 J99 A99 S99 S98 098 N98 D98 J99 F99 M99 A99 M99 J99 J99 A99 S99
EU-15
ι»-'·"!
Belgique/België
EU-15
Danmark
DEUTSCHLAND
0701
S98 098 N98 D98 J99 F99 M99 A99 M99 J99 J99 A99 S99 S98 098 N9B D98 J99 F99 M99 A99 M99 J99 J99 A99 S99
EU-15
ι
ι
Deutschland
EU-15
Ellada
SCHAUBILDER
GRAPHICS
GRAPHIQUES
^a 07
eurostat
Industrielle Produktion
Industrie insgesamt
(ohne Baugewerbe)
Trend 1995=100
Industrial production
Total industry
(excluding construction)
Trend 1995=100
Production industrielle
Ensemble de I'indudstrie
(sans bâtiment)
Tendance 1995=100
IRELAND
180-1
170
160
150
-140
130
120
110
100
90
80
0701
S98 098 N98 D98 J99 F99 M99 A99 M99 J99 J99 A99 S99
EU-15
Ireland
130
125
120
115
110
-105
100
95
90
85
-80
JA
0701
S98 098 N98 D98 J99 F99 M99 A99 M99 J99 J99 A99 S99
EU-15
Ώ
Italia
LUXEMBOURG
0701
NEDERLAND
0701
S98 098 N98 D98 J99 F99 M99 A99 M99 J99 J99 A99 S99
" = 1 EU-15
Luxembourg
S98 098 N98 D98 J99 F99 M99 A99 M99 J99 J99 A99 S99
U
EU-15
Nederland
OSTERREICH
130
125
120
115
110
105
100 4
95
90
85
SCHAUBILDER
GRAPHICS
GRAPHIQUES
m
07
eurostat
Industrielle Produktion
Industrie insgesamt
(ohne Baugewerbe)
Trend 1995=100
Industrial production
Total industry
(excluding construction)
Trend 1995=100
Production industrielle
Ensemble de l'indudstrie
(sans bâtiment)
Tendance 1995=100
S98 098 N98 D98 J99 F99 M99 A99 M99 J99 J99 A99 S99 S98 098 N98 D98 J99 F99 M99 A99 M99 J99 J99 A99 S99
EU-15
Suomi/Finland
EU-15
Sverige
0701
130 η
125
120
115
110
105
100
95 -i
90
85
S98 098 N98 D98 J99 F99 M99 A99 M99 J99 J99 A99 S99
SCHAUBILDER
GRAPHICS
GRAPHIQUES
eurostat
Verbaucherpreisindizes
Gesamtindex
TAT-12%
Consumer prices indices
General index
T/T-12%
Indice des prix à la consommation
Indice général
TAT-12%
EU-15
USA
■JPN
4,0
3,5
/ V ·
r\
-1,0
GRAPHICS
GRAPHIQUES
13 21
eurostat
Harmonisierte
Harmonized indices of
Verbraucherpreisindizes
consumer prices General
Gesamtindex T/T-12%
index T/T-12%
Indices harmonisés des prix
à la consommation
Indice d'ensemble T/T-12%
BELGIQUE/BELGIË
2101
DANMARK
2101
098 N98 D98 J99 F99 M99 A99 M99 J99 J99 A99 S99 099 098 N98 D98 J99 F99 M99 A99 M99 J99 J99 A99 S99 099
EU-15
C
EUR-11
Belgique/België
Ξ ]
EU-15
EUR-11
Danmark
N98 D98 J99 F99 M99 A99 M99 J99 J99 A99 S99 099 098 N98 D98 J99 F99 M99 A99 M99 J99 J99 A99 S99 099
EU-15
EUR-11
Deutschland
EU-15
3
EUR-11
Π
Ellada
098 N98 D98 J99 F99 M99 A99 M99 J99 J99 A99 S99 099
FRANCE
2,0
1,6
2101
SCHAUBILDER
GRAPHICS
GRAPHIQUES
m
21
eurostat
Harmonisierte
Verbraucherpreisindizes
Gesamtindex T/T-12%
Harmonized indices of
consumer prices
General index T/T-12%
Indices harmonisés des prix
à la consommation
Indice d'ensemble T/T-12%
2101
098 N98 D98 J99 F99 M99 A99 M99 J99 J99 A99 S99 099 098 N98 D98 J99 F99 M99 A99 M99 J99 J99 A99 S99 099
EU-15
Ώ
EUR-11
Ireland
EU-15 Γ = 1 EUR-11 I I Italia
LUXEMBOURG
2101
^¿¿.
2,8
2,4
2,0
1,6
1,2
0,8
0,4
0.0
NEDERLAND
2101
098 N98 D98 J99 F99 M99 A99 M99 J99 J99 A99 S99 099 ° 9 8 N98 D98 J99 F99 M99 A99 M99 J99 J99 A99 S99 099
EU-15
EUR-11
Luxembourg
EU-15 E
EUR-11
Nederland
SCHAUBILDER
GRAPHICS
GRAPHIQUES
m
21
eurostat
Harmonisierte Harmonized indices of
Verbraucherpreisindizes consumer prices General
Gesamtindex T/T-12% index T/T-12%
Indices harmonisés des prix à la
consommation
Indice d'ensemble T/T-12%
2101
098 N98 D98 J99 F99 M99 A99 M99 J99 J99 A99 S99 099 098 N98 D98 J99 F99 M99 A99 M99 J99 J99 A99 S99 099
EU-15
3 EUR-11
Suomi/Finland
EU-15
C
EUR-11
Sverige
UNITED KINGDOM
098 N98 D98 J99 F99 M99 A99 M99 J99 J99 A99 S99 099
SCHAUBILDER
GRAPHICS
GRAPHIQUES
ΈΔ
eurostat
Wechselkurs
(Durchschnitt)
Exchange rate
(Mean)
Taux de change
(Moyenne)
■1 EURO = ... USD
1 EUR(*) = ... YEN
1,5
170
1,4
1,3
1,2
1,1
J \
160
150
140
130
1
120
110
1,0
1996
1997
1998
100
1999
SCHAUBILDER
GRAPHICS
GRAPHIQUES
ΈΔ 2'
eurostat
Wechselkurs (1)
(Durchschnitt)
Exchange rate (1]
(Mean)
Taux de change(1)
(Moyenne)
DANMARK
N98 D98 J99 F99 M99 A99 M99 J99 J99 A99 S99 099 N99
1
EUR:
3 1
USD
=
N98 D98 J99 F99 M99 A99 M99 J99 J99 A99 S99 099 N99
1
EUR:
1
USD:
2401
N98 D98 J99 F99 M99 A99 M99 J99 J99 A99 S99 099 N99 N98 D98 J99 F99 M99 A99 M99 J99 J99 A99 S99 099 N99
1
EUR
=
1
USD
=
...
1
EUR
=
■
1 USD:
SCHAUBILDER
GRAPHICS
GRAPHIQUES
■Γ
ΉΔ
J
eurostat ' V
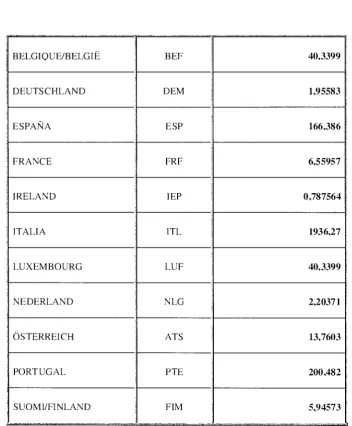
Umrechnungstabelle
des Euro
[image:29.595.118.471.250.677.2]Conversion table
of the euro
Table de conversion
de l'euro
1
EUR
=
...
BELGIOUE/BELGIË
¡
DEUTSCHLAND
ESPAÑA
FRANCE
IRELAND
ITALIA
LUXEMBOURG
NEDERLAND
ÖSTERREICH
; PORTUGAL
; SUOMI/FINLAND
BEF
DEM
ESP
FRF
IEP
ITL
LUF
NLG
ATS
PTE
FIM
40,3399 !
1,95583
\
166,386 |
6,55957 !
0,787564 I
1936,27
40,3399
2,20371
13,7603
200,482
Tabellen
Volkswirtschaftliche Gesamtrechnungen
ESG 95
VOLKSWIRTSCHAFTLICHE GESAMTRECHNUNGEN ESVG 95
NATIONAL ACCOUNTS ESA 95
COMPTES NATIONAUX SEC 95
1996 1997 1998 1999 1996 1997 1998 1999 II V II V II V II V
0101
EU-15 6678.91 6838.88 7021.47 7166.31 1666.05 1675.83 1681.50 1685.16 1704.96 1717.66 1731.10 1743.22 1751.86 1761.93 1764.46 1771.43 1780.88Bruttoinlansprodukt
Mrd Euro(")
1995
EUR-11 5378.36 5496.47 5646.24 5770.20 1341.90 1349.90 1353.30 1353.91 1370.36 1380.32 1391.88 1401.92 1409.04 1416.66 1418.62 142478 1432.21 B 212.78 219.61 225.99 230.32 52.97 53.40 53.68 53.64 5479 55.39 55.82 55.B5 56.74 56.80 56.63 56.78 57.72 DK 141.71 146.16 150.08 152.62 35.48 35.65 35.59 35.96 36.73 36.61 36.88 37.29 37.13 37.86 37.82 37.62 37.69 D 1894.38 1921.87 1963.23 1996.10 473.77 475.85 477.83 475.64 481.14 482.84 484.66 489.78 489.78 491.76 490.42 492.61 492.83 EL 90.84 93.72 97.18 100.46 E 457.34 474.88 493.67 510.00 113.79 115.09 115.60 116.73 118.02 119.08 121.11 121.80 122.75 124.22 124.96 125.73 127.16 F 1201.20 1224.85 1263.59 1293.09 299.65 301.15 301.51 302.87 304.76 307.20 310.55 313.42 316.06 317.40 319.72 321.11 323.60 326.94 0.00Gross domesticproduct
Bn euro(')
1995
IRL 54.33 60.12 65.23 71.27 I 846.30 858.85 870.33 884.14 210.88 211.91 211.14 210.86 214.30 215.85 217.25 216.22 217.29 218.60 217.63 218.03 218.94 L 13.81 14.37 15.19 15.66 NL 326.96 339.35 351.78 359.75 78.15 79.11 79.35 80.07 80.88 82.00 82.82 83.58 84.20 84.63 85.60 86.17 86.85 A 180.16 184.70 190.70 195.01 45.06 45.02 45.35 45.55 45.73 46.32 47.00 47.46 47.66 47.71 47.83 48.04 48.46 Ρ 83.15 86.02 89.03 91.89 14.09 13.87 14.28 14.33 14.57 14.4C 14.84 14.92 15.1C 14.9C 15.26 FIN 102.34 108.06 114.10 118.35 25.26 25.78 26.16 26.15 26.95 27.32 27.66 28.08 28.39 28.70 28.95 29.04 29.33 S 179.04 182.2C 187.44 191.52 44.62 44.97 45.05 45.26 45.3C 45.85 46.43 46.02 46.87 47.16 47.84-
J
r
eurostal
Produit intérieur brut
Mrd euro(')
1995
UK 881.73 912.69 933.14 943.80 219.49 220.88 222.87 225.31 227.23 229.43 230.55 231.80 232.88 234.12 234.23 234.53 235.71 US 5865.17 6129.33 6392.97 6526.39 1463.19 1471.22 1488.89 1506.88 1525.90 1540.90 1552.63 1578.03 1586.37 1601.15 1624.26 1639.03 1646.66 1669.00 JP 4126.60 4192.38 4087.20 4110.27 1028.35 1031.29 1047.41 1064.56 1038.08 104879 1039.05 1026.40 1018.96 1016.01 1007.59 1027.50 1028.56 1996 1997 1998 1999 1996 III III IV 1997 I II III IV 1998 I
II III IV 1999 I II III
0102
EU-15 1.5 2.4 2.7 2.1 0.3 0.6 0.6 0.3 0.2 1.2 0.8 0.8 0.7 0.5 0.6 0.1 0.4 0.5Veränderung des
Bruttoinlandsprodukts
Volumen -(Τ/Γ-1 %)
EUR-11 1.3 2.2 2.7 2.2 0.2 0.7 0.6 0.3 0.0 1.2 0.7 0.8 07 0.5 0.5 0.1 0.4 0.5 Β 0.9 3.2 2.9 1.9 -0.1 0.4 0.8 0.5 -0.1 2.1 1.1 0.8 0.1 1.6 0.1 -0.3 0.3 1.6 DK 2.9 3.1 2.7 1.7 0.5 1.4 0.5 -0.2 1.0 2.1 -0.3 0.7 1.1 -0.4 2.0 -0.1 -0.5 0.2 D 0.8 1.5 2.2 1.7 -0.9 1.4 0.4 0.4 -0.5 1.2 0.4 0.4 1.1 0.0 0.4 -0.3 0.5 0.0 EL 2.4 3.2 3.7 3.4 E 2.3 3.8 4.0 3.3 0.8 0.8 1.1 0.4 1.0 1.1 0.9 1.7 0.6 0.8 1.2 0.6 0.6 1.1Changes in gross domestic
product -volume terms
(T/T-1 %)
F 1.1 2.0 3.2 2.3 0.8 0.1 0.5 0.1 0.5 0.6 0.8 1.1 0.9 0.B 0.4 0.7 0.4 0.8 1.0 IRL 8.3 10.7 8.5 9.3 I 0.9 1.5 1.3 1.6 0.7 -0.4 0.5 -0.4 -0.1 1.6 0.7 0.7 -0.5 0.5 0.6 -0.4 0.2 0.4 L 2.6 4.1 5.7 3.2 NL 3.0 3.8 3.7 2.3 0.9 0.6 1.2 0.3 0.9 1.0 1.4 1.0 0.9 0.7 0.5 1.2 0.7 0.8 A 2.0 2.5 3.3 2.3 0.5 0.9 -0.1 0.7 0.4 0.4 1.3 1.5 1.0 0.4 0.1 0.3 0.4 0.9 Ρ 3.2 3.5 3.5 3.2 0.5 0.9 -1.6 3.0 0.4 1.7 -1.2 3.0 0.6 1.2 -1.3 2.4Evolution di
FIN 4.1 5.6 5.6 3.7 2.4 0.5 2.1 1.5 -0.1 3.1 1.4 1.3 1.5 1.1 1.1 0.9 0.3 1.0 S 1.3 1.8 2.9 2.2 0.4 0.4 0.8 0.2 0.5 0.2 1.1 1.3 -0.9 1.9 0.7 1.4produit intérieur
brut-volume
(T/T-1 %)
UK 2.6 3.5 2.2 1.1 0.8 0.5 0.6 0.9 1.1 0.9 1.0 0.5 0.5 0.5 0.5 0.1 0.1 0.5 US 3.7 4.5 4.3 2.1 0.7 1.7 0.6 1.2 1.2 1.3 1.0 0.8 1.6 0.5 0.9 1.4 0.9 0.5 1.4 JP 5.1 1.6 -2.5 0.6 2.9 0.2 0.3 1.6 1.6 -2.5 1.0 -0.9 -1.2- 0 7
-0.3
-0.8
2.0
0.1
OVor 1/1/1999 un ECU
Die Dalen für EU-15 und EUR-11 wurden in einer zusammenhängenden Weise errechnet, die alle verfügbaren Daten der Mitgliedstaaten, die vierteljährliche Ergebnisse bereitstellen, verwendet.
Vierteliahrhche Daten : NL, A, P, US und JP Inlandskonzept
C)ECU before 1/1/1999
Data for EU-15 and EUR-11 are calculated statistically using data available from those Member States which compile quaterly accounts.
Quaterly data : NL. A, P, US and JP under national concept
OECU avant 1/1/1999
Les données d'EU-15 et EUR-11 sont calculées selon un cadre statistique utilisant comme indicateurs les données de tous les Etats membres qui élaborent une comptabilité trimestrielle.
VOLKSWIRTSCHAFTLICHE GESAMTRECHNUNGEN ESVG 95
NATIONAL ACCOUNT ESA 95
COMPTES NATIONAUX SEC 95
Ξ £
eurostat
1996 I
IV 1997 I
IV
1 9 9 8 I I
1999 IV
Privater Endverbrauch
0103 MrdEuro(')
1995
Private final consumption
Bn euro(')
1995
Consommation finale privée
Mrd euro(')
1995
EU-15 EUR-11 Β DK EL IRL NL FIN UK
us
JP1996 1997 1998 1999 3842.65 3913.12 4029.08 4135.38 3039.12 3081.22 3170.86 3257.89 115.14 117.74 121.72 124.62 71.58 74.25 76.86 78.41 1076.59 1084.57 1109.41 1138.58 67.71 69.45 70.70 72.11 272.67 280.51 292.05 302.80 668.00 669.26 691.93 711.13 28.40 30.20 32.69 35.14 497.35 509.93 519.33 528.58 6.95 7.13 7.26 7.44 161.86 166.15 173.04 179.29 101.45 102.19 103.89 106.16 53.26 54.85 57.92 60.17 52.90 54.44 57.43 59.63 93.74 95.63 98.09 100.74 567.84 589.94 609.77 623.37 3924.34 4071.41 4269.83 4388.75 2431.07 2442.48 2429.17 2411.68 956.96 963.59 965.62 969.63 976.88 978.95 987.67 996.31 1004.04 1010.96 1017.77 1024.91 1028.32 756.96 762.12 762.48 765.16 769.08 770.31 776.67 783.94 789.91 796.19 800.82 805.18 806.95 28.78 28.76 28.92 29.20 29.33 29.51 29.73 30.43 30.32 30.53 30.46 31.08 30.88 17.80 17.94 18.12 18.18 18.79 18.39 18.87 18.89 19.27 19.26 19.42 19.42 19.09 268.59 269.82 270.30 270.83 272.17 270.51 272.22 275.96 275.74 278.15 279.16 281.19 279.91 67.35 6B.53 68.69 69.52 69.47 70.47 71.09 71.35 72.73 73.47 74.54 74.89 75.90 166.45 168.14 165.95 166.06 166.35 167.39 169.72 171.05 173.25 174.06 175.17 175.56 176.41 177.98 0.00 123.70 124.34 125.40 126.16 127.55 127.81 128.06 128.42 129.67 130.29 130.60 130.86 131.28 46.43 47.00 47.24 47.54 48.04 48.12 48.97 49.37 50.06 50.73 51.13 51.82 25.67 25.07 25.28 25.44 25.43 25.58 25.71 25.74 25.93 26.04 26.12 26.28 26.42 9.26 9.25 9.34 9.47 9.49 9.59 9.69 9.90 10.09 10.15 10.22 13.14 13.16 13.42 13.46 13.55 13.58 13.85 14.02 14.25 14.42
1 4 7 6 14.69 14.75 23.22 23.58 23.60 23.61 24.02 23.99 24.07 24.19 24.40 24.69 24.88 253.97 263.21 268.89 262.04 267.79 278.12 283.68 276.69 282.01 291.71 297.68 291.23 297.36 9 7 8 7 3
983.95 991.70 1003.74 1008.24 1024.47 1032.95 1047.03 1062.63 1072.94 1085.13 1102.47 1116.21 1128.75
6 0 5 7 0
606.58 613.33 635.22 603.20 612.65 606.80 608.84 607.99 607.15 606.23 613.78 618.68 1996 1997 1998 1999 1996 1997 1998 1999
Veränderung des privaten
0104 Endverbrauch -Volumen
(T/T-1%)
EU-15 EUR-11 Β DK D
Changes in private final
consumption-volume terms
(T/T-1%)
EL IRL NL
Evolution de la consommation
finale privée -volume
(T/T-1%)
S UK us
FIN 1.0 0.1 0.7 0.2 0.4 0.8 0.2 0.9 0.9 0.8 0.7 0.7 0.7 0.3 1.0 -0.1 07 0.1 0.4 0.5 0.2 0.8 0.9 0.8 0.8 0.6 0.5 0.2 0.2 0.3 -0.1 0.5 1.0 0.4 0.6 0.7 2.4 -0.4 0.7 -0.3 2.0 -0.6 1.1 0.5 0.8 1.0 0.3 3.3 -2.1 2.6 0.1 2.0 -0.1 0.8 -0.0 -1.7 0.0 0.3 0.5 0.2 0.2 0.5
- 0 . 6
0.6 1.4
- 0 . 1 0.9
0.4 0.7
- 0 . 5
1.4 - 1 . 2
1.8 0.2
1.2 - 0 . 1
1.4 0.9 0.4 1.9 1.0 1.5 0.5 1.4 1.9 - 0 . 7
1.0 - 1 . 3
0.1 0.2 0.6 1.4 0.8 1.3 0.5 0.6 0.2 0.5 0.9 0.4 0.1 0.5 0.9 0.6 1.1 0.2 0.2 0.3 1.0 0.5 0.2 0.2 0.3 0.7 0.2 1.2 0.5 0.6 1.1 0.2 1.8 0.8 1.4 1.3 O.B 1.4 1.1 1.1
- 2 . 3
0.8 0.6
- 0 . 0 0.6 0.5 0.1 0.7 0.4 0.3 0.6 0.5 2.6 - 0 . 2
- 0 . 1 1.0 1.4 0.3 1.0 1.0 2.2 2.0 0.6 0.7 2.4 -0.5 0.2 2.0 0.3 0.7 0.2 2.0 1.2 1.7 1.2 2.3 -0.4 0.4 0.6 - 0 . 7
1.6 0.1
0.0 1.7
- 0 . 1 0.3 0.5 0.9 1.2 0.8 -2.4 1.5 3.6 2.2 -2.6 2.2 3.9 2.0
- 2 . 5 1.9 3.4 2.1 -2.2 2.1 JP 1.8 1.8 3.0 2.6 1.4 1.4 2.9 2.7 1.2 2.3 3.4 2.4 3.0 3.7 3.5 2.0 0.8 0.7 2.3 2.6 1.9 2.6 1.8 2.0 2.1 2.9 4.1 3.7 1.3 0.2 3.4 2.8 6.1 6.3 8.3 7.5 0.9 2.5 1.8 1.8 2.1 2.5 1.8 2.5 4.0 2.7 4.2 3.6 2.0 0.7 1.7 2.2 2.5 3.0 5.6 3.9 3.5 2.9 5.5 3.8 1.3 2.0 2.6 2.7 3.6 3.9 3.4 2.2 3.3 3.8 4.9 3.6 2.9 0.5
- 0 . 6
- 0 . 7
0.8 1.1 0.5 0.8 1.2 0.5 1.6 0.8 1.4 1.5 1.0 1.1 1.6 1.3 1.5 -0.3 0.2 1.1 3.6
- 5 . 0
1.6
-1.0
0.3
- 0 . 1
- 0 . 1 - 0 . 2
1.3
0.8
O V o r 1/1/1999 un ECU
Die Daten für E U - 1 5 und E U R - 1 1 w u r d e n in einer z u s a m m e n h ä n g e n d e n W e i s e errechnet, die alle verfügbaren Daten der Mitgliedstaaten, die vierteljährliche Ergebnisse bereitstellen, verwendet.
Vierteljahrliche Daten : NL, A, P, U S und JP Inlandskonzept
C ) E C U before 1/1/1999
Data for E U - 1 5 and E U R - 1 1 are calculated statistically using data availablefrom those M e m b e r States which compile quaterly accounts.
Quaterly data : NL, A, P, US and J P under national concept
O E C U avant 1/1/1999
Les d o n n é e s d ' E U - 1 5 et E U R - 1 1 sont calculées selon un cadre statistique utilisant c o m m e indicateurs les d o n n é e s de tous les Etats m e m b r e s quiélaborent une comptabilité trimestrielle.
VOLKWIRTSCHAFTLICHE GESAMTRECHNUNGEN ESVG 95
NATIONAL ACCOUNTS ESA 95
COMPTES NATIONAUX SEC 95
1996 1997 1998 1999 1996 1997 1998 1999 II V II V II V II V
0105
EU-15 1388.72 1392.04 1410.20 1433.92 346.45 348.39 349.66 346.98 347.51 349.02 348.53 352.18 352.53 352.84 352.66 356.68 357.53Endverbrauch des Staates
Mrd Euro(")
1995
EUR-11 1117.03 1122.62 1137.23 1154.79 278.46 280.45 281.30 279.79 280.29 281.42 281.11 284.37 284.42 284.51 283.93 287.27 287.77 B 46.24 46.02 47.14 47.73 11.58 11.62 11.55 11.50 11.50 11.48 11.54 11.70 11.70 11.83 11.92 11.95 11.91 DK 36.66 37.05 38.14 38.75 9.14 9.23 9.20 9.23 9.26 9.29 9.28 9.45 9.51 9.57 9.62 9.61 9.64 D 380.41 376.10 377.84 382.11 94.69 95.92 95.86 94.42 94.16 94.26 93.36 95.49 94.85 94.48 93.14 95.60 95.22 EL 13.92 13.87 13.92 13.76 E 81.80 84.03 85.74 87.42 20.42 20.47 20.59 20.72 20.93 21.12 21.28 21.42 21.43 21.42 21.49 21.55 21.61Final consumption of general
government
Bneuro(")-1995
F 290.08 294.89 298.23 303.00 72.35 72.62 72.99 73.32 73.54 73.88 73.99 74.17 74.43 74.48 74.78 75.24 75.56 75.77 0.00 IRL 7.3C 7.65 7.86 8.2C I 155.59 154.85 156.78 158.87 37.88 38.08 38.04 37.75 37.69 37.72 37.80 37.88 38.09 38.24 38.59 38.84 39.07 L 1.81 1.82 1.83 1.89 NL 75.94 78.47 81.06 83.49 11.14 11.08 11.14 11.10 11.18 11.30 11.35 11.42 11.45 11.56 11.62 11.72 A 35.83 34.43 34.87 35.39 8.93 8.97 8.98 8.60 8.57 8.63 8.63 8.69 8.74 B.70 8.74 8.71 8.87=
Jr
eurostat
Commation finale des administrations
publiques
Mrd euro(') -1995
P 14.51 14.81 15.3C 15.61 2.34 2.35 2.36 2.37 2.36 2.4C 2.42 2.44 2.46 2.4£ 2.49 FIN 23.01 23.68 24.01 24.31 5.74 5.76 5.81 5.84 5.91 5.95 5.98 5.93 6.00 6.04 6.05 5.98 6.03 S 45.53 44.6C 45.43 45.85 11.27 11.5E 11.47 11.02 11.09 11.34 11.17 11.27 11.32 11.41 11.46 UK 172.32 169.92 171.59 176.74 43.25 43.05 43.42 42.05 42.52 42.77 42.51 42.23 42.91 43.04 43.34 43.62 43.98 US 871.80 891.89 903.09 917.50 218.64 217.86 219.68 220.46 223.30 223.73 223.95 222.86 226.06 225.74 227.99 228.79 229.46 232.10 JP 392.62 398.32 404.38 407.67 97.65 97.46 100.36 97.90 100.40 101.58 99.38 100.08 100.24 101.01 100.44 101.22 100.77Veränderung des Endverbrauch des
0106 Staates -Volumen
(T/T-1%)
Changes in the final consumption of
general government -volume terms
(T/T-1%)
EU-15 EUR-11 Β DK EL
Evolution de la consommation finale
des administrations publiques -volume
(T/T-1%)
IRL
I
NL
FIN
UK
US
JP
1996 1997 1998 1999 1996 I 1.8 0.2 1.3 1.7 1.8 0.5 1.3 1.5 2.4 -0.5 2.4 1.3 3.0 1.6
2.2 1.0 1.3 -1.1 -0.4 2.7 0.5 0.4 2.0 1.1 -1.0 2.0
2.3 1.7 1.1 1.5 4.8 3.0 1.4 -0.5 1.3 1.3 5.1 0.3 0.5 3.5 -0.4 3.3 3.3 3.0 -0.2 2.0 -0.6 0.6 -0.3 0.7 1.1 0.5 0.6 0.3 0.9 0.5 0.9 0.6 -3.9 1.3 1.5 0.0 -0.0 0.4 0.2 -4.3 -0.3 0.6 0.1 0.6 0.6 -0.5 0.5 -0.4 1.9 1.8 2.1 3.3 2.1 0.4 0.4 0.4 0.4 0.5 0.6 0.7 0.9 1.0 0.9 0.7 0.6 2.5 2.9 1.4 1.2 0.3 0.7 0.3 0.9 0.5 1.3 0.7 0.4 -0.8 1.1 0.6 0.2 -1.1 0.8 -0.2 -2.1 1.9 0.9 -0.7 0.4 2.7 -0.9 -3.9 0.7 2.2 -1.5 0.9 0.4 0.8 0.6 1.7 -1.4 1.0 3.0 -0.5 1.7 -0.5 0.9 -3.2 1.1 0.6 -0.6 -0.7 1.6 0.3 0.7 0.6 0.8 0.6 2.3 1.3 1.6 0.3 1.6 -0.4 0.8 0.4 1.3 0.2 0.1 -0.5 1.4 -0.1 1.0 0.4 0.3 1.2 1.9 1.5 1.5 0.8 0.5 -0.2 -0.2 3.0 -2.5 2.6 1.2 -2.2 0.7 0.2 0.8 -0.6 0.8 -0.4
IV
1997 I 1998IV
1999 I -0.5 0.7 0.6 0.4 -0.8 0.2 0.4 -0.1 1.1 0.1 0.1 -0.1 1.1 0.2 -0.7 0.6 0.7 0.3 -0.5 0.2 0.4 -0.1 1.2 0.0 0.0 -0.2 1.2 0.2 0.7 0.7 0.3 -0.6 -0.4 0.0 -0.2 0.5 1.4 -0.0 1.2 0.7 0.3 -0.3 0.7 0.4 1.0 -0.4 0.3 0.4 0.3 -0.0 1.8 0.7 0.6 0.6 -0.2 0.3 -2.2 0.7 1.3 -0.1 -1.5 -0.3 0.1 -1.0 2.3 -0.7 -0.4 -1.4 2.6 -0.4 0.2 0.4 0.2 0.6 0.6 1.0 0.9 0.7 0.7 0.1 -0.1 0.3 0.3 0.3 0.4 0.4 0.5 0.5 0.3 0.5 0.2 0.2 0.4 0.1 0.4 0.6 0.4 0.3 0.4 0.4 0.5 -0.1 -0.8 -0.2 0.1 0.2 0.2 0.6 0 4 0.9 0.6 0.6OVor 1/1/1999 un ECU
Die Daten fur EU-15 und EUR-11 wurden in einer zusammenhängenden Weise errechnet, die alle verfügbaren Daten der Mitgliedstaaten, die vierteljährliche Ergebnisse bereitstellen, verwendet.
Vierteljahrliche Daten : NL. A, P, US und JP Inlandskonzept
OECU before 1/1/1999
Data for EU-15 and EUR-11 are calculated statistically using data availablefrom those Member States which compile quaterly accounts.
Quaterly data : NL, A, P. US and JP under national concept
OECU avant 1/1/1999
Les données d'EU-15 et EUR-11 sont calculées selon un cadre statistique utilisant comme indicateurs les données de tous les Etats membres quiélaborent une comptabilité trimestrielle.
VOLKSWIRTSCHAFTLICH GESAMTRECHNUNGEN ESVG 95
NATIONAL ACCOUNTS ESA 95
COMPTES NATIONAUX SEC 95
Ξ £
eurostat
1996 1997 1998 1999 1996 I I I 1997 I 1998 I 1999 I IIV
0107
Bruttoanlageinvestitionen
Mrd Euro( )
1995
Gross fixed capital formation
Bn euro(')
1995
Formation brute de capital fixe
Mrd euro(')
1995
EU-15 EUR-11 Β DK EL IRL I NL FIN UK US JP
1325.77 1364.57 1434.75 1484.83 1103.80 1126.94 1175.07 1215.92 43.23 45.97 47.64 49.25 26.90 29.67 31.78 32.59 417.32 419.29 425.18 432.67 17.89 19.61 21.52 23.80 100.21 105.19 114.87 124.49 223.24 224.36 237.11 246.74 9.39 10.41 11.76 13.11 157.38 158.77 164.25 168.94 2.95 3.34 3.42 3.52 68.48 72.52 76.32 77.27 43.08 44.28 46.47 48.52 20.18 22.55 24.73 26.40 17.19 19.20 20.93 22.33 26.72 25.44 27.88 29.16 147.25 158.36 173.97 178.59 1117.39 1200.86 1327.72 1243.42 1242.48 1232.18 1141.47 1083.94 333.17 334.84 334.07 332.44 340.30 343.33 348.50 355.63 353.23 362.30 363.59 370.85 372.85 277.99 278.87 277.86 275.84 280.85 283.30 286.95 291.90 289.73 296.55 296.88 303.34 305.28 10.73 10.79 11.00 10.95 11.99 11.22 11.81 11.55 11.80 12.20 12.09 12.14 12.42 6.61 6.84 7.02 7.06 7.50 7.58 7.58 8.03 7.88 7.97 7.96 8.28 8.05 106.27 106.49 105.79 103.60 104.94 105.85 105.90 107.50 104.14 106.91 105.69 108.99 108.35 IV 25.11 25.89 24.94 25.51 25.93 26.74 27.02 28.09 28.03 28.97 29.80 30.31 31.27 55.94 55.88 55.83 55.04 55.90 56.30 57.26 58.07 59.09 60.02 60.91 62.16 63.19 64.34 0.00 39.42 39.07 39.05 39.01 39.39 39.68 40.58 41.11 40.86 41.12 41.05 41.61 42.05 14.98 15.43 15.89 15.99 16.39 16.3B 16.63 16.82 16.77 17.09 17.36 18.19 10.76 10.71 10.90 10.82 10.98 11.20 11.41 11.66 11.59 11.71 11.70 11.84 11.99 3.95 4.05 4.43 4.34 4.51 4.50 4.78 4.86 4.93 4.81 5.29 4.21 4.35 4.41 4.39 4.83 4.97 5.02 4.98 5.15 5.36 5.44 5.39 5.49 6.65 6.75 6.58 6.19 6.57 6.27 6.42 6.61 6.96 7.11 7.20 34.77 36.59 38.15 39.09 37.34 39.36 42.50 43.61 40.46 43.23 46.61 46.70 42.81 278.27 282.85 286.21 291.08 297.07 304.91 307.21 321.50 330.43 333.11 342.02 351.22 356.28 362.65 314.35 311.56 314.10 312.35 304.86 304.07 299.07 287.74 277.97 274.00 271.08 285.00 280.83 1996 1997 1998 1999 1996 I
III IV 1997 I
III IV 1998 I
III IV 1999 I
III
0108
EU-15 1.6 2.9 5.1 3.5- 1 . 0
2.9 0.5
- 0 . 2
- 0 . 5
2.4 0.9 1.5 2.0
- 0 . 7
2.6 0.4 2.0 0.5
Veränderung der
Bruttoanlageinvestitionen
-(T/T-1 %)
EUR-11 0.9 2.1 4.3 3.5- 1 . 6
3.3 0.3
- 0 . 4 - 0 . 7
1.8 0.9 1.3 1.7
- 0 . 7
2.4 0.1 2.2 0.6 Β 0.9 6.3 3.6 3.4
- 0 . 6
0.2 0.5 1.9
- 0 . 4
9.5
- 6 . 4
5.3
- 2 . 2
2.1 3.5
- 0 . 9
0.4 2.3 DK 5.0 10.3 7.1 2.5
- 3 . 8
2.3 3.4 2.7 0.6 6.2 1.1 0.0 5.8
- 1 . 8
1.1
- 0 . 1
4.0
- 2 . 8
D
- 1 . 1
0.5 1.4 1.8
- 4 . 3
6.8 0.2
- 0 . 7 - 2 . 1
1.3 0.9 0.1 1.5
- 3 . 1
2.7
- 1 . 2
3.1
- 0 . 6
-Volumen
EL 8.E 9.6 9.7 10.6 E 2.0 5.0 9.2 8.4- 2 . 0
3.4 3.1
- 3 . 7
2.3 1.6 3.1 1.0 4.0
- 0 . 2
3.3 2.9 1.7 3.2
Changes
F- 0 . 0
0.5 5.7 4.1
- 0 . 2
0.3
- 0 . 1
- 0 . 1 - 1 . 4
1.6 0.7 1.7 1.4 1.8 1.6 1.5 2.1 1.6 1.8 IRL 13.7 10.9 13.C 11-E
in gross fixed capital
volume terms
(T/T-1 %)
I 2.3 0.9 3.5 2.9 0.9- 0 . 8
- 0 . 9
- 0 . 0
- 0 . 1
1.0 0.8 2.3 1.3
- 0 . 6
0.6
- 0 . 2
1.4 1.0
L
- 2 . 5
13.2 2.2 3.0 NL 6.3 5.9 5.2 1.3 2.8 0.3 3.0 3.0 0.6 2.5
- 0 . 1
1.6 1.1
- 0 . 3
1.9 1.6 4.8
formation
A 2.5 2.8 4.9 4.4 1.2 0.9- 0 . 5
1.8
- 0 . 7
1.5 2.0 1.8 2.3
- 0 . 6
1.1
- 0 . 1
1.2 1.3 Ρ 5.7 11.8 9.7 6.7
- 2 . 9
3.8 2.7 9.2
- 1 . 8
3.9
- 0 . 3
6.2 1.7 1.4
- 2 . 4
9.9
Evolution de la formation
brute de capital fixe -volume
(T/T-1 %)
FIN 8.4 11.7 9.0 6.7 8.6- 0 . 1
3.4 1.3
- 0 . 5
10.0
2.9 1.1
- 0 . 9
3.5 4.1 1.5
- 1 . 1
2.0
s
3.7
- 4 . 8
9.6 4.6
1.0
- 1 . 5
1.5
- 2 . 6
- 5 . 9
6.2
- 1 . 7
2.4 3.1 5.3 2.1 1.3 UK 4.9 7.5 9.9 27 4.4
- 7 . 7
5.2 4.3 2.5
- 4 . 5
5.4 8.0 2.6
- 7 . 2
6.9 7.8 0.2
- 8 . 3
US 8.4 7.5 10.6 4.3 2.9 3.3 1.7 1.2 1.7 2.1 2.6 0.8 4.7 2.8 0.8 27 2.7 1.4 1.8 JP 11.1
- 0 . 8 - 7 . 4
- 5 . 0
5.5 2.7
- 0 . 9
0.8
- 0 . 6 - 2 . 4
- 0 . 3
- 1 . 6
- 3 . 8 - 3 . 4
- 1 . 4
- 1 . 1
5.1
- 1 . 5
(*)Vor 1/1/1999 un ECU
Die Daten für E U - 1 5 und E U R - 1 1 w u r d e n in einer z u s a m m e n h ä n g e n d e n W e i s e errechnet, die alle verfügbaren Daten der Mitgliedstaaten, die vierteljährliche Ergebnisse bereitstellen, verwendet.
Vierteljahrliche Daten : NL, A, P, US und JP Inlandskonzept
C ) E C U before 1/1/1999
Data for E U - 1 5 and E U R - 1 1 are calculated statistically using data availablefrom those M e m b e r States which compile quaterly accounts.
Quaterly data : NL, A, P, U S and J P under national concept
(*)ECU avant 1/1/1999
Les d o n n é e s d ' E U - 1 5 et E U R - 1 1 sont calculées selon un cadre statistique utilisant c o m m e indicateurs les d o n n é e s de tous les Etats m e m b r e s quiélaborent une comptabilité trimestrielle.
VOLKSWIRTSCHAFTLICHE GESAMTRECHNUNGEN ESVG 95
NATIONAL ACCOUNTS ESA 95
COMPTES NATIONAUX SEC 95
m
Vorratsveränderungen und
0109 Nettozugang an Wertsachen
MioEuro(>1995
Changes in inventories and
acquisitions less disposals of
valuables -Mio eurof) -1995
eurostat
Variations de stocks et acquisitions
moins cessions d'objets de valeur
Mio eurof) -1995
EU-15 EUR-11 DK EL IRL NL FIN UK US JP
1996 1997 1998 1999
1996
1997
1998
1999
5380 25250 52367 38765 I 840 II -1605 V -177 2590 I 5613 II 4873 V 12175 11006 I 14273 II 11183 V 15910 9255 I 9335
II V
5888 22955 47023 38725 1395 -1326 409 1185 5689 4799 11282 9889 12366 9582 15190 9824 11502
-770 -1191 783 778 -208 273 -24 -887 -754 17 433 385 460 470 -532 -728 -346
358 538 1024 998 232 142 -276 238 117 241 -62 308 250 164 281 -612 -268
-2695 109 4664 4C 18498 28C 13816 538 -1068 -2615 -1228 -53 961 801 2722 1388 5551 3576 8060 2562 4964
1271 1006 1490 354 871 -36 512 532 748 -798 524 161 70 989 270 -15 306
-1693 698 936 1113 5409 727 4159 1015
262 -1493 275 636 -134 906 447 2216 1650 1000 2137 1400 1026 -594 0
6927 -352 13972 -132 18219 -20€ 16532 -312
-561 915 -683 -521 2784 2331 3921 3252 3216 3007 3811 4330 4077
647 344 503 -375 519 -62 89 6 285 172 45 891 27 -25 136 -669
190 3202 3861 3822 188 434 399 935 799 940 1302 1179 1104 1235 1335 1435 1851
120C 1045 122C 1372 169 298 218 239 168 279 201 34C 362 465 413
973 447 356 849 -81 285 300 122 275 -176 225 5 304 190 -142 274 -5
-166 582 1522 1082 -128 -286 -73 789 -11C 2E 746 733 1046 -145 217
1984 4556 6946 2067 -110726 -120968 -127608 -118888 -120606 -131292 -137262 -129122 -130739 -141396 -149212 -140853 -143504
23907 54045 63273 51905 5922 9835 6471 10078 17763 11750 14428 20908 10605 16523 15205 12773 7657 11907
16397 31835 9099 73519 3205 4090 4771 2539 7210 7920 8171 6233 6419 5492 42B7 4109 5248
Vorratsveränderungen und
0110 Nettozugang an Wertsachen^)
Volumen-% des BIP
Changes in inventories and
acquisitions less disposals of
valuables(
1y-volume terms-% of GDP
EU-15 EUR-11 DK EL IRL NL
Variations de stocks et acquisitions
moins cessions d'objets de valeur(
1)
volume -%du PIB
FIN UK US JP
1996 1997 1998 1999
1996 I
1997 I
1998 I
1999
IV
Daten vorläufig nicht verfügbar
Hvor 1/1/1999 un ECU
Die Daten fur EU-15 und EUR-11 wurden in einer zusammenhängenden Weise errechnet, die alle verfügbaren Daten der Mitgliedstaaten. die vierteljährliche Ergebnisse bereitstellen, verwendet.
Data currently unavailable
C)ECU before 1/1/1999
Data for EU-15 and EUR-11 are calculated statistically using data availablefrom those Member States which compile quaterly accounts.
Données actuellement indisponibles
C)ECU avant 1/1/1999