Int. J. Electrochem. Sci., 8 (2013) 6055 - 6067
International Journal of
ELECTROCHEMICAL
SCIENCE
www.electrochemsci.orgStructural, Thermal and Electrical Properties of Li
4-2xZn
xSiO
4Ceramic Electrolyte Prepared by Citrate Sol Gel Technique
S.B.R.S Adnan1,* and N.S. Mohamed2 1
Institute of Graduate Studies, University of Malaya, 50603 Kuala Lumpur, Malaysia 2
Centre for Foundation Studies in Science, University of Malaya, 50603 Kuala Lumpur, Malaysia *
E-mail: [email protected]; [email protected]
Received: 17 November 2012 / Accepted: 5 April 2013 / Published: 1 May 2013
The aim of this work is to investigate the structural, thermal and electrical properties of Zn doped Li4SiO4 synthesized by a sol gel method. The formation of the compound is confirmed by X-ray diffraction study. Thermal properties of the compounds are measured using DSC analysis while the electrical characteristics are investigated by impedance spectroscopy. The introduction of zinc ions considerably raises the conductivity and improves thermal stability of the parent compound Li4SiO4. The compound of Li3.88Zn0.06SiO4 gives a maximum value of 3.2 x 10⁻⁵ S cm-1 at room temperature and 1.08 x 10⁻³ S cm-1 at 500 oC. The charge carrier concentration, mobile ion concentration and ion hopping rate are calculated by fitting the conductance spectra to power law variation, σac (ω) = σo +
Aωα. The charge carrier concentration and mobile ion concentration are found to be constant over the temperature range from 303 K to 773 K while mobility of ion increases with temperature implying that the increase in conductivity with temperature is due to increase in ion mobility. The transference number corresponding to Li+ ion transport determined by means of Bruce and Vincent technique shows that majority charge carriers in the compound are Li+ ions.
Keywords: Arrhenius, ceramic, electrolyte, Li4SiO4, sol gel, transference number
1. INTRODUCTION
concern in electrolyte research is to enhance ionic conductivity which is the main challenge faced by researchers in this field.
In the search for a variety of batteries and solid state electrolyte with Li+ ion conductors, considerable interest has been shown in systems based on lithium orthosilicate (Li4SiO4) which is chemically stable [2-16]. Li4SiO4 exist in two polymorphic forms which are separated by a broad transition region between 600 oC and 725 oC [2]. The crystal structure of this compound consists of lithium-oxygen polyhedral which represent the lithium sites, are connected together by multiple sharing of faces to form three dimension network of cages linked by triangular windows. On average, the lithium sites are less than half full and so there are also plenty of other sites which are unoccupied but could be occupied transiently and afford extra conduction pathways [2,5,10].
Li4SiO4, itself is a poor conductor (σRT = 10-8-10-6 S cm-1) [2,5,17]. However, its conductivity can be greatly enhanced by aliovalent doping such as Li4-2xDxSiO4 (D = Co2+, Ni2+, Mg2+)[5,8], Li4-3xTxSiO4 (T = Al3+, Ga3+, B3+, In3+)[4,6-9,15-16] and Li4-xMxSi1-xO4 (M = V5+, As5+, P5+) [11-14]. These doping may create vacant sites in the crystal and any lithium ion in the immediate vicinity can jump to the vacant sites. This leaves the previous site of the ion vacant which could now host another ion. This results the transport of ions across the solid giving rise to conductivity. Their concentration is the main factor determining the conductivity of this solid electrolyte [18].
West [10] has reported previously the conductivity data for the Li3.4Zn0.3SiO4 compound at temperature 450 oC to 700 oC with conductivity value 3.4 x 10⁻⁴ S cm-1 and 2.3 x 10⁻² S cm-1 respectively using conventional solid state reaction. However, the works reported in the literature only focused for high temperature application (>450 oC). No works on this type material for low and medium temperature devices application has been reported. Such study is interesting one as development of the electrolytes with high conductivity at low and medium temperatures can broaden their use to low and medium temperature solid state devices such as in energy and transportation sector, communication electronics, display devices, medicine and metallurgy.
Meanwhile, the synthesis using citrate sol gel technique has been reported can enhance the conductivity compared to the conventional solid state reaction [19]. Furthermore, this technique has other advantages such as lowering the synthesis temperature, effective in improving the linkage between grain boundary, molecular-level homogeneity can be easily achieved and the homogeneous mixture containing all the compounds in the correct stoichiometry ensures a much higher purity of the sample. This method is also simple and therefore suitable for both small scale and large scale production. [2-3,19-20].
2. EXPERIMENTAL PROCEDURE 2.1 Synthesis of Li4-2xZnxSiO4
In this study, four compounds with x = 0, 0.06, 0.12, 0.20 were prepared via sol gel technique. For sample preparation, lithium acetate (C2H3LiO2) zinc acetate (C4H10O6Zn) and tetraethyl orthosilicate (SiC8H20O4) were used as the starting materials. Meanwhile citric acid was used as the chelating agent. Lithium acetate and zinc acetate were dissolved in distilled water and later mixed with citric acid under magnetic stirring. The solution was transferred into a reflux system and continuously stirred until a homogeneous solution was formed. Solution of tetraethyl orthosilicate was then added to the homogeneous solution. After stirring for 12 hours, the solution was taken out and then vaporized for about two hours under magnetic stirring at 75 oC. The resulting wet gel was dried in an oven at 150oC for 24 hours to remove water particles, resistance organic groups as well as to avoid ceramic cracks. The powder was pressed using a Specac pellet hydraulic press to form pellet with diameter and thickness of 13 mm and 2 mm respectively. The pellets were later sintered at 850 oC for 12 hours.
2.2. Characterization techniques.
Bruker AXS D8 X-ray diffractometer employing Cu-K radiation was used to perform X-ray diffraction in order to identify the crystalline phase of the material. Thermal behavior of the sintered sample was analyzed by differential scanning calorimetry (DSC) (EVO Labsys thermal analyzer) in N2 atmosphere at a constant heating rate of 10oC/min in the temperature range between room temperature and 1300 oC. The compounds electrical properties were determined by ac impedance spectroscopy using Solatron 1260 impedance analyzer over a frequency range from 0.1 to 106 Hz. An applied voltage was fixed at 110 mV.
The dc conductivity was determined using the equation:
σb = b AR
d
(1) where d is the sample thickness, A is the area of the electrode and Rb is the bulk resistance
which is determined from impedance plot.
The ac conductivity has been evaluated from dielectric data in accordance with the relation: σac= ωεoε’’ tan δ (2)
where εo is permittivity of the free space (8.854 x 10⁻¹⁴ F cm-1 ), ω is 2f , ε’’ is dielectric loss
sandwiched between lithium metal electrodes which are used as non-blocking electrodes that only allow Li+ ions to transfer. The lithium transference number (τLi+) was calculated using the equation:
ss ss
o o o ss Li R I V I R I V I ss ss e R I V R (3)
In this equation, Io is initial current (t = 0), Iss is steady state current, Ro and Rss are initial
resistance of the passive layer (before polarization) and resistance of the passive layer (after polarization) respectively and V is applied voltage bias (V = 500 mV). Re is resistance of the
electrolyte which is calculated using Ohm’s law:
o o
e R
I V
R (4)
3. RESULT AND DISCUSSION 3.1. Structural properties
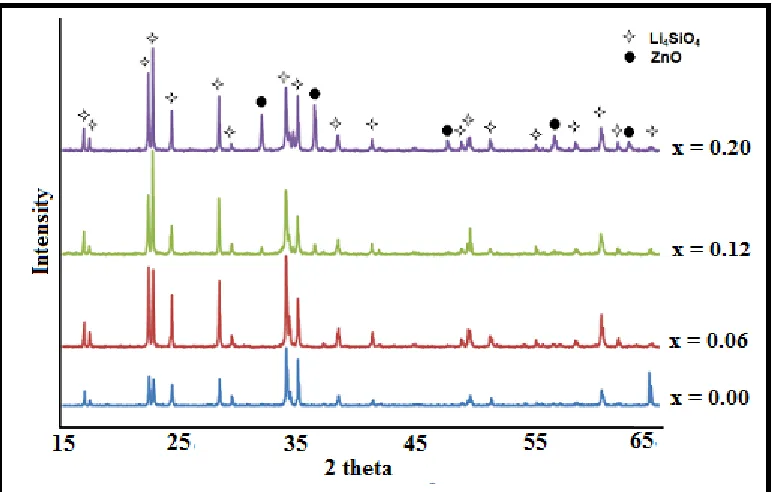
Fig. 1(a) presents the XRD spectra of all the Li4-2xZnxSiO4 samples. The XRD spectra of all
samples can be indexed to monoclinic structure in space group P21/m [25].
[image:4.596.107.493.473.719.2]
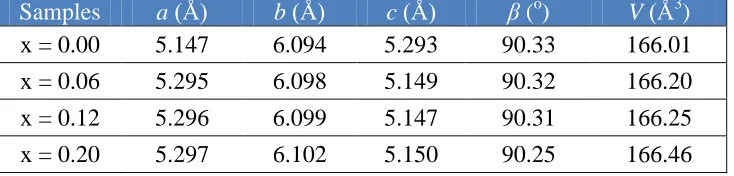
Table 1. Lattice parameters of the Li4-2xZnxSiO4 samples
Samples a (Å) b (Å) c (Å) β (o) V (Å3)
x = 0.00 5.147 6.094 5.293 90.33 166.01
x = 0.06 5.295 6.098 5.149 90.32 166.20
x = 0.12 5.296 6.099 5.147 90.31 166.25
x = 0.20 5.297 6.102 5.150 90.25 166.46
Compared with the XRD spectra of the Li4SiO4 sample, single phase solid electrolyte only appear in the sample with x=0.06 which shows no extra peaks in its XRD spectrum. The peaks shift to higher diffraction angle indicating that Zn2+ ion is in the Li4SiO4 structure rather than forming impurities. The diffraction peaks are also broadened by Zn doping, which implies that the crystal size decreases with increasing Zn content. The peak at diffraction angle 65o tends to disappear with increasing Zn amount. Meanwhile, small peaks attributed to ZnO arise in XRD patterns appear in the sample doped with x=0.12 and x=0.20.
The lattice parameters of the Li4-2xZnxSiO4 samples are listed in Table 1. The parameters of
Li4SiO4 are in good agreement with the values reported by Dubey and West [26]. The value of a, b and V (unit cell volume) increase with increasing x and the value of c is first decreases and then increases with increasing x. Among all of the lattice parameters, monoclinic angle β decreases slightly with increasing x. The increase in the unit cell volume is mostly related to the Zn2+ insertion into Li4SiO4 structure which can be attributed to the larger atomic size of Zn2+(0.74 Å) than that of Li+ (0.68 Å) [7,27].
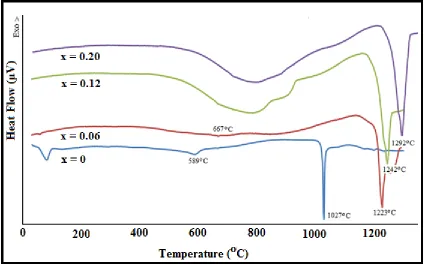
3.2. Thermal properties
The DSC curves for Li4-2xZnxSiO4 samples are shown in Fig. 2. There are three endothermic
Figure 2. DSC curves of Li4-2xZnxSiO4 samples.
3.3. Electrical properties 3.3.1 Dc conductivity
The dc conductivity of Li4-2xZnxSiO4 was determined from the bulk resistance, Rb using
[image:6.596.85.510.72.337.2]equation (1). The dc conductivity for all samples at 500 oC and RT are listed in Table 2. The maximum conductivity is observed at x = 0.06 with conductivity value of 3.20 x 10⁻⁵ S cm-1 at RT and increases to 1.08 x 10⁻³ S cm-1 at 500oC. The conductivity increases by an order of magnitude compared to the Li4SiO4 with replacement of Li+ to Zn2+. Even though the solubility of zinc in this electrolyte is low, small addition of Zn2+ significantly raises the conductivity. The conductivity decreases with further increase in x due to the presence of the impurities, ZnO which may block the migration of Li+ ion between grains. However, the conductivity of the samples with x = 0.12 and x = 0.20 is still higher than that of Li4SiO4. This effect is due to the increase of cation vacancies in the monoclinic structure [5].
Table 2. Conductivity data for Li4-2xZnxSiO4 samples at ambient temperature and 500 oC
Samples σ500 (S cm-1) σRT (S cm-1)
[image:6.596.188.406.658.753.2]
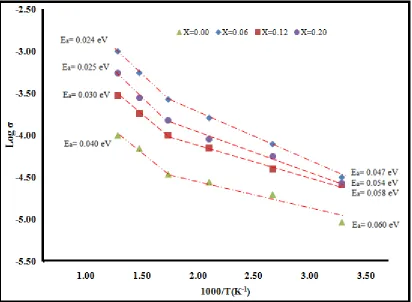
The temperature dependence of the d.c conductivity of Li4-2xZnxSiO4 samples is shown in Fig.3. The activation energy, Eα of the dc conductivity is calculated according to the Arrhenius equation:
σbT = A exp (
kT Ea
) (5)
where A is the pre-exponential factor, Eα is the activation energy for conduction and k is the
Boltzman constant. The conductivity of all samples increases with temperature. However, all the σ-1000/T plots show a discontinuity at 300 oC (1000/T = 1.75 K-1) which is in agreement with the results reported by Wakihara et al [5] but in contrast to the result of West [10] who reported a discontinuity at 180 oC for Li4SiO4. The change in slope of σ-1000/T plots could be due to an order-disorder transition of Li+ and Zn2+ ions since there is no experimental evidence for a phase transition occurring in the sample upon heating at room temperature until 500 oC as shown in Fig. 2. In the other words, the conductivity may be influenced at even slightest change in structure arrangement [5].
The activation energy for all samples which was extracted from the Arrhenius plots is shown in Fig. 4. The low value of activation energy indicates high mobility of ions in the sample. However, the presence of impurities in the samples of x = 0.12 and x = 0.20 lowers the ionic mobility and decreases the conductivity [31].
[image:7.596.94.506.404.706.2]
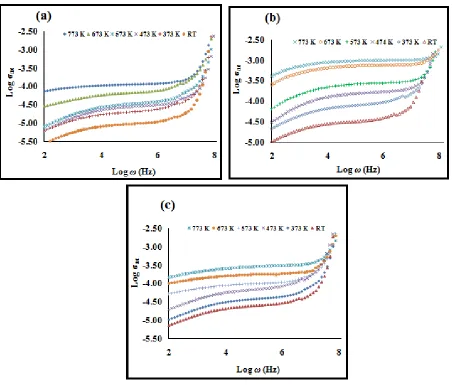
3.3.2 Conductivity spectra
Conductivity spectra for Li4-2xZnxSiO4 samples at various temperatures are presented in Figure 4. At low frequencies, a plateau characterizes the dc conductivity. At high frequencies, conductivity increases according to universal power law. The conductivity can thus be represented by the expression as follows:
'( ) (0)A (6)
[image:8.596.74.527.351.736.2]where σ(0) is the d.c conductivity of the sample, A is a temperature dependant parameter and α is the power law exponent which represents the degree of interaction between the mobile ion and is less than 1. When temperature increases, the transition from the d.c plateau to a.c conductivity dispersion region shifts towards higher frequency range. At high frequencies, the conductance spectra at different temperatures converge. This indicates that a.c conductivity is independent of temperature at high frequencies [2,32-36].
According to the jump relaxation model, which takes account of the coulomb interaction between mobile ions, the exponent of the power law in Eq. (6) relates to ratio of [2,34,37-38]:
rate relaxation site rate backhop
(7)
The backhop is the backward motion of a hopping ion to its initial site, which is caused by the coulomb repulsive interaction between mobile ions. The site relaxation is the shift of a site potential minimum to the position of the hopping ion, which is caused by a rearrangement of neighboring ions. The decrease in α with zinc doping (Table 4) may be due to the formation of vacant sites for Li ion migration, which in turn reduces the backhop rate and hence decreases α.
According to Almond and West [32-35,39-40], the hopping rate of ion in a material is valuable information to elucidate the ionic conduction. The ionic hopping rate, ωp can be obtained directly from
a.c conductivity data since it corresponds to ()2(0) [32-33, 38]. The charge carrier concentration, C can be calculated from the definition for the dc conductivity of the ion conducting material which is given by [32-35, 39-40]:
p dcT C
(8)
where ) ( ) 1
( 2 2 1
n n N e a k
C (9)
Here e is electron charge, γ is correlation factor which is set equal to 1, N is equivalent site per unit volume and a is the jump distance between two adjacent sites for the ions to hope which is assumed to be 3Å for all materials [33-34]. n is concentration of mobile ions which can be calculated using Eq. 9 and k is Boltzmann constant. The ionic mobility, μ canbe calculated using equation:
ne
dc
(10)
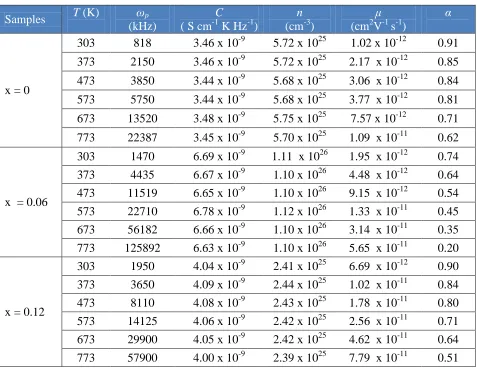
The values of ωp, C, n, μ and α for sample Li4-2xZnxSiO4 samples at various temperatures are
tabulated in Table 4. From the table, the charge carrier concentration, C and mobile ion concentration,
n are constant over temperature range studied for all samples. This implies that all the lithium ions which are responsible for the conductivity are in mobile state thus can be best represented by the strong electrolyte model [32, 34-35, 40]. As such, the higher conductivity observed for Li3.88Zn0.06SiO4
is due to high mobile ion concentration ( 1026) compared with that ( 1025) observed for both Li4SiO4 (
x = 0) and Li3.76Zn0.12SiO4 ( x = 0.16).
the increase in ionic mobility since the density of mobile ions is constant over the temperature range studied [32-33,38]. The ion mobility value is higher in Li3.88Zn0.06SiO4 sample compared to
Li3.76Zn0.12SiO4 sample. This may be attributed to the existence of ZnO impurities which distorted the
[image:10.596.61.538.206.577.2]crystal lattice in the sample and decreases the mobility of ions as well as the mobile ion concentration.
Table 4. Values of ωp, C , n, μ and α at various temperatures for sample Li4-2xZnxSiO4 (x = 0, 0.06
and 0.12)
Samples T (K) ωp (kHz)
C
( S cm-1 K Hz-1)
n
(cm-3)
μ
(cm2V-1 s-1)
α
x = 0
303 818 3.46 x 10⁻⁹ 5.72 x 1025 1.02 x 10⁻¹² 0.91 373 2150 3.46 x 10⁻⁹ 5.72 x 1025 2.17 x 10⁻¹² 0.85 473 3850 3.44 x 10⁻⁹ 5.68 x 1025 3.06 x 10⁻¹² 0.84 573 5750 3.44 x 10⁻⁹ 5.68 x 1025 3.77 x 10⁻¹² 0.81 673 13520 3.48 x 10⁻⁹ 5.75 x 1025 7.57 x 10⁻¹² 0.71 773 22387 3.45 x 10⁻⁹ 5.70 x 1025 1.09 x 10⁻¹¹ 0.62
x = 0.06
303 1470 6.69 x 10⁻⁹ 1.11 x 1026 1.95 x 10⁻¹² 0.74 373 4435 6.67 x 10⁻⁹ 1.10 x 1026 4.48 x 10⁻¹² 0.64 473 11519 6.65 x 10⁻⁹ 1.10 x 1026 9.15 x 10⁻¹² 0.54 573 22710 6.78 x 10⁻⁹ 1.12 x 1026 1.33 x 10⁻¹¹ 0.45 673 56182 6.66 x 10⁻⁹ 1.10 x 1026 3.14 x 10⁻¹¹ 0.35 773 125892 6.63 x 10⁻⁹ 1.10 x 1026 5.65 x 10⁻¹¹ 0.20
x = 0.12
303 1950 4.04 x 10⁻⁹ 2.41 x 1025 6.69 x 10⁻¹² 0.90 373 3650 4.09 x 10⁻⁹ 2.44 x 1025 1.02 x 10⁻¹¹ 0.84 473 8110 4.08 x 10⁻⁹ 2.43 x 1025 1.78 x 10⁻¹¹ 0.80 573 14125 4.06 x 10⁻⁹ 2.42 x 1025 2.56 x 10⁻¹¹ 0.71 673 29900 4.05 x 10⁻⁹ 2.42 x 1025 4.62 x 10⁻¹¹ 0.64 773 57900 4.00 x 10⁻⁹ 2.39 x 1025 7.79 x 10⁻¹¹ 0.51
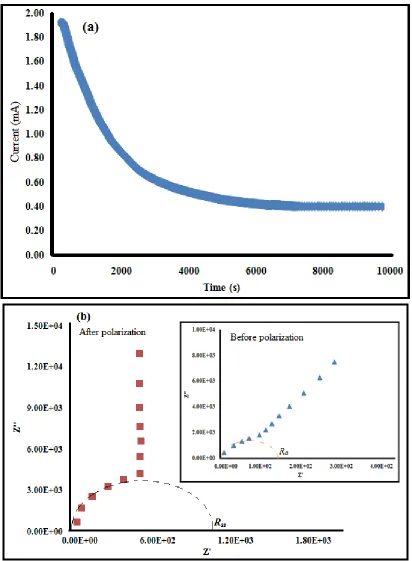
3.3.3 Lithium Transference Number
Figure 5(a) presents the plot of current versus time for the Li/ Li3.88Zn0.06SiO4/Li cell. The
Figure 5. (a) Current verses time plot for Li3.88Zn0.06SiO4 sample and (b) Impedance response of the
[image:11.596.93.505.69.630.2]sample before and after dc polarization.
Table 5. Data obtained from lithium transference number measurement of the Li3.88Zn0.06SiO4 sample
Sample V(mV) Iss(mA) Rss(Ω) Re(Ω)
τ
Li+ [image:11.596.76.518.717.753.2]
4. CONCLUSIONS
The effect of Zn doping on Li4SiO4 was studied by XRD, DSC and EIS. The XRD result shows that Zn is successfully inserted into the Li4SiO4 structure. Meanwhile the DSC result reveals that doping with Zn increases thermal stability of the compound. The RT conductivity of the Zn doped compound is an order of magnitude higher compared to the undoped Li4SiO4. The conductivity– temperature study shows that the entire compound obeys the Arrhenius law. The conductivity parameters such as hopping frequencies, charge carrier concentration and mobile ion concentration have been calculated by fitting the conductance spectra to power law variation. The data of these parameters prove that increase in conductivity with temperature is due to increase in ion mobility. The value of lithium transference number in the sample with x = 0.06 is 0.82 and reasonable value for application in lithium batteries.
ACKNOWLEDGMENTS
Financial support by University of Malaya research grant (PV027/2012A) is gratefully acknowledged.
References
1. M. Parka, X. Zhanga, M. Chunga, G. B. Lessa, A. M. Sastrya, J. Power Sources, 195 (2010) 7904. 2. S.B.R.S Adnan, N.S Mohamed, Mater. Res. Innovations, 16 (2012) 281.
3. S.B.R.S Adnan, N.S Mohamed, K.A Norwati, World academy of science, engineering and technologys, 50 (2011) 670.
4. J.B Chavarria, P. Quintana, A. Huanosta, Solid state Ionics, 83 (2006) 24. 5. M. Wakihara, T. uchida, T. Gohara, Solid state Ionics, 31 (1988) 17.
6. Y. Saito, K. Ado, T. Asai, H. Kageyama, O. Nakamura, Solid State Ionics, 47 (1991) 149.
7. C. Masquelier, M. tabuchi, T. Takeuchi, W. Soizumi, H. Kageyama, O. Nakamura, Solid State Ionics, 79 (1995) 98.
8. Y. Saito, T. Asai, K. Ado, H. Kagayema, O. Nakamura, Solid state Ionics, 40/41 (1990) 34. 9. E.I Burmakin, Solid State Ionics, 36 (1988) 155.
10.A.R West, Appl. Electrochem., 3 (1973) 327.
11.A. Khorassani, A. R West, Solid State Chem., 53 (1984) 369. 12.A. Khorassani, A. R West, Solid State Ionics, 7 (1982) 1.
13.A. R Rodger, J. Kuwano, A.R West, Solid State Ionics, 15 (1985) 185. 14.Y. Tao, D. Yi, J. Li, Solid State Ionics, 179 (2008) 2396.
15.R.I Smith, A. R West , Solid State Chem., 93 (1991) 436. 16.R.I Smith, A. R West, Solid State Chem., 88 (1990) 564.
17.I. Hodge, M.D Ingram, A.R West, American Ceramic Soc., 59 (1976) 360. 18.P.P Kumar, S. Yashonath, Chem. Sci., 118 (2006) 135.
19.X. Song, M. Jia, R. Chen, J. Mater. Processing Technol., 120 (2002) 21.
20.R. Adnan, N. A Razana, I. A Rahman and M. Akhyar Farrukh, J. Chinese Chem. Soc., 57(2010) 222.
21.R.I Smith, A.R West, Solid State Chem., 88 (1990) 564.
22.P. G. Bruce, J. Evans, C. A. Vincent, Solid State Ionics 28–30 (1988) 918. 23.M. Riley, S. Peter, Fedkiw, S. A. Khan, Electrochem. Soc., 149 (2002) A667. 24.A.M.M. Ali , M.Z.A Yahya , H. Nahron, R. H. Y. Subban, Ionics, 12 (2006) 303.
26.B.L Dubey, A.R West, J. Inorg. Nuclear Chem., 35 (1973) 3713.
27.S. Zhang, C. Deng, B.L Fu, S.Y Yang, L. Ma, Electrochim. Acta, 55 (2010) 8482. 28.H. Kleykamp, Thermochim. Acta, 287 (1996) 191.
29.G.W Hollenberg, J. Nuclear Mater., 103 (1981) 591.
30.D. Vollath,H. Wedemeyer, H. Zimmermann,H. Werle, J. Nuclear Mater., 174 (1990) 86. 31.M. Dudek, Int. J. Electrochem. Sci., 7 (2012) 2874.
32.S.B.R.S Adnan, N.S. Mohamed, Int. J. Electrochem. Sci., 7 (2012) 9844.
33.L. P. Teo & M. H. Buraidah & A. F. M. Nor & S. R. Majid, Ionics 18 (2012) 655.
34.M. Vijayakumar, G. Hirankumar, M.S. Bhuvaneswari, S. Selvasekarapandian, J. Power Sources, 117 (2003) 143.
35.T. Savitha, G. Hirankumar, M.S. Bhuvaneswari, S. Selvasekarapandian, C.S. Ramya, R. Baskaran, P.C Angelo, J. Power Sources,157 (2006) 553.
36.A.M. Abo El Ata, S.M. Attia, T.M Meaz, Solid State Sci., 6 (2004) 61. 37.K. Funke, Solid State Ionics, 94 (1997) 27.
38.M.A Afifi, M.EL-Nahass, A.E Bekheet, I.T Zedan, S.R Elliot, Physica B : Physics of Condensed Matter, 400 (2007) 248.
39.D.P Almond, A.R West, Solid State Ionics, 9&10 (1983) 277. 40.D.P Almond, A.R West, Solid State Ionics, 23 (1987) 27.
41.Yongxin An, Pengjian Zuo, Xinqun Cheng, Lixia Liao, Geping Yin, Int. J. Electrochem. Sci., 6 (2011) 2398 .