Int. J. Electrochem. Sci., 7 (2012) 6214 - 6220
International Journal of
ELECTROCHEMICAL
SCIENCE
www.electrochemsci.org
Short Communication
Determination of the Real Surface Area of a Screen-Printed
Electrode by Chronocoulometry
Vasiliki Fragkou1, Yi Ge1*, Greg Steiner3, Dom Freeman2, Norbert Bartetzko3, Anthony P F Turner 1 ,4*
1
Cranfield Health, Vincent Building, Cranfield University, Cranfield, Bedfordshire, MK43 0AL, UK
2
Pelikan Technologies, Inc.1072 East Meadow Circle, Palo Alto, CA 94303, USA
3
Pelikan Technologies GmbH & Co. KG, Lise Meitner Strabe 7, D-48161, Munster, Germany
4
Biosensors & Bioelectronics Centre, IFM, Linköping University, SE-58183, Linköping, Sweden
*
E-mail: y.ge@cranfield.ac.uk; anthony.turner@liu.se
Received: 27 April 2012 / Accepted: 25 May 2012 / Published: 1 July 2012
A simple and effective method applying chronocoulometry and cyclic voltammetry to the determination of the real surface area of a screen-printed electrode, for the first time, is reported. The method is based on the Anson plot and the standard addition method. This method could greatly facilitate determination of the real surface area of commercial screen-printed electrodes, which still remains underdeveloped despite the critical importance of quality control in this industry.
Keywords: Screen-Printed Electrodes, Real/Active Surface Area, Chronocoulometry, Anson Plot, Standard Addition Method
1. INTRODUCTION
Various electrochemical methods that determine the real surface area of conventional solid electrode (e.g. carbon electrodes and metal electrodes) have been reported [3]. Furthermore, Trasatti and Petri described many methods for the determination of real electrochemical surface area of liquid electrodes [4]. By contrast, however, the determination of the real electrochemical surface area of screen-printed electrodes still remains underdeveloped, which is mainly due to the inherent physical properties of screen-printed electrodes. Thus, some electrochemical methods require good surface condition and are therefore inapplicable to the determination of the real surface area of screen-printed electrodes [5]. In addition, there are some other hindrances such as the complexity and non-uniformity of the materials and production procedures for screen-printed electrodes. To the best of our knowledge, no effective method has previously been reported for the determination of the real electrochemical surface area of screen-printed electrodes.
2. EXPERIMENTAL
2.1 Materials (Apparatus & Reagents)
TMPD (N,N,N',N'-tetramethyl-p-phenylenediamine) was purchased from Acros-Organics (Geel, Belgium). 2-(1-Methoxy)propyl acetate 97%, used as diluter for preparing stock solutions of TMPD, was purchased from Acros-Organics (Geel, Belgium). All reagents used to make PBS (phosphate buffer saline) buffers were purchase from Sigma-Aldrich (Dorset, UK). Deionised water was used in all solution preparations.
The commercial screen-printed electrodes applied in this study were supplied by Pelikan Technologies GmbH (Muenster, Germany). The screen-printed electrodes were fabricated on polyvinyl chloride (PVC) sheets using a screen-printer. Each electrode comprised a three electrode system: a printed Ag/AgCl reference electrode a Ag/AgCl counter electrode and a carbon electrode acting as the working electrode.
2.2 Methods
All of the cyclic voltammetric and chronocoulometric experiments were conducted using a µ-Autolab type III potentiostat (Eco Chemie, Netherlands). The final data included in this communication were the mean of the measurements in triplicate, except the chronocoulometric experiment where 5 replicates had been run. All solutions were degassed by bubbling pure nitrogen before use.
10mM PBS buffer (pH 7.4), in order to achieve a completely dissolved and homogenous solution. An aliquot (0.7 μL) of each concentration was then added on the electrode and cyclic voltammograms were run with a scan rate of 50mV/sec.
The chronocoulometric experiments were conducted by applying two potentials. The pulse width was 2 sec. The first potential (-0.25 V) was low so that no electrochemical reduction of TMPD occured, and the second potential (0.25 V) applied was high enough to reduce all the TMPD. After adding 0.7 μL of 10mM pH 7.4 PBS on the electrode, the total charge passed versus time was recorded for 4 seconds.
SEM images of the working electrode paste were obtained using a ISI ABT-55 low-vacuum scanning electron microscope. The working electrode paste provided by Pelikan was spread to an even film on a microscope glass slide by using a plastic spatula. After being dried for 2 hours in oven at 65
o
C, the slide was tailored and placed on a cylinder holder for the observation.
3. RESULTS & DISCUSSION
In this communication, we describe a simple and effective methodology utilising chronocoulometry for the determination of the real electrochemical surface area of a screen-printed electrode for the first time. This study focuses on the screen-printed carbon electrode, and the method explored is based on the Anson plot and the standard addition method.
Chronocoulometry (CC) is one of the classical electrochemical techniques used in electroanalytical chemistry. Briefly speaking, it is the measurement of charge (coulombs) as a function of time. In other words, a fast-rising potential pulse is applied to the working electrode and the electrical charge passing through this electrode is measured as a function of time [6]. The technique of chronocoulometry has been successfully applied to the surface area measurement of conventional solid electrode, kinetics of both heterogeneous electron transfer reactions and chemical reactions coupled to electron transfer [7].
The analysis of the chronocoulometric data is based on the Anson equation (Eq.1) [8] which defines the charge-time dependence for linear diffusion control:
Q = 2nFACD1/2π1/2t1/2 (1)
Herein, Q represents the charge (coulombs). n and A represent the number of electrons transferred and the real electrochemical surface area of the electrode (cm2), respectively. F is the Faraday’s constant (96,485 coulombs/mole). The concentration of the mediator is denoted by C where the diffusion coefficient of the mediator (cm2/sec) and time (sec) are denoted by D and t, respectively.
There is a linear relationship between the charge (Q) and the square root time (t ½). A plot of Q vs. t ½ is often referred as the Anson plot [7] where the slope (a) can be determined by the following equation (Eq.2):
Therefore, the real electrochemical surface area of the electrode (A) can be calculated from the slope in Eq.3, provided the other four parameters (n, F, C and D) are known.
A = a/(2nFCD1/2/π1/2) (3)
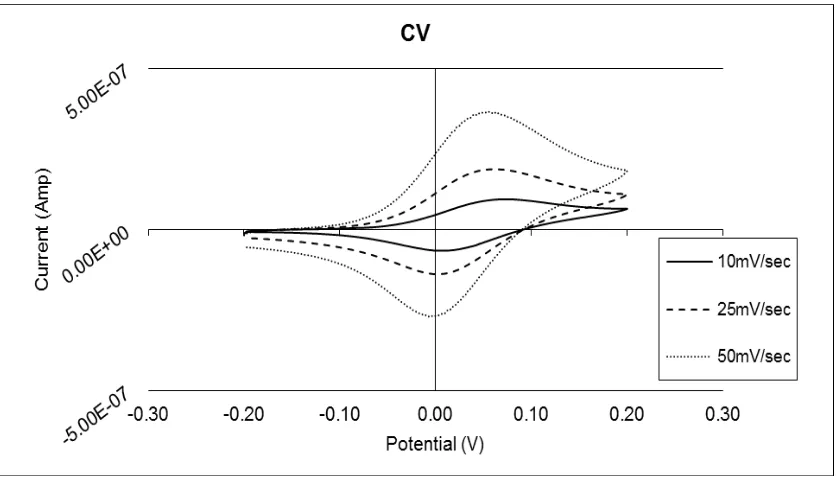
[image:4.596.90.509.317.557.2]Apart from the number of electrons transferred (n) and the Faraday’s constant (F) which are already well known, the calculation of the diffusion coefficient (D) of the mediator was achieved by using cyclic voltammetry. As can been seen in Fig. 1, after adding 0.7μL phosphate buffer saline (PBS) on a screen-printed electrode, cyclic voltammograms were obtained with three different scan rates and the resulting currents of the oxidation peaks were plotted against the square root of the scan rates. The slope obtained is equal to the diffusion coefficient of the mediator. Thus, the diffusion coefficient of the mediator is 5.98E-08 cm2sec-1 (the coefficient of variation is 15%, while the confidence interval is 1.04%).
Figure 1. Cyclic voltammograms of a commercial screen-printed electrode at three different scan rates
The method of standard addition is widely applied to determine the analyte concentration in a complex matrix if the analytical signal is proportional to the analyte concentration [9]. It can be presented as Eq.4 if the sample response is known to vary linearly with sample concentration [10]
Cu = ru Cs / (ru + s – ru) (4)
Where:
Cu: unknown concentration
ru: response of the unknown (analytical signal of the unknown)
ru+s: response of the unknown plus the standard (analytical signal of the unknown plus the
standard)
In practice, several aliquots of standard TMPD solution were added to the system. A plot was then created showing the response against the concentration of each addition, and the straight line obtained was then extrapolated back to a zero response. The negative intercept on the concentration axis represents the unknown concentration, which could be calculated by dividing the positive intercept on the response axis by the slope.
Since in our case it is well known that the electrical current of an electrochemical process is linearly proportional to the concentration of the analyte used [11], by using the standard addition method (Eq.4), the unknown concentration (Cu) of the mediator TMPD was obtained successfully. The
average concentration of the mediator TMPD in the commercial screen-printed electrode was 3.03 M (3.03E-06 mol·cm-3) (the coefficient of variation is 16%, while the confidence interval is 0.55%).
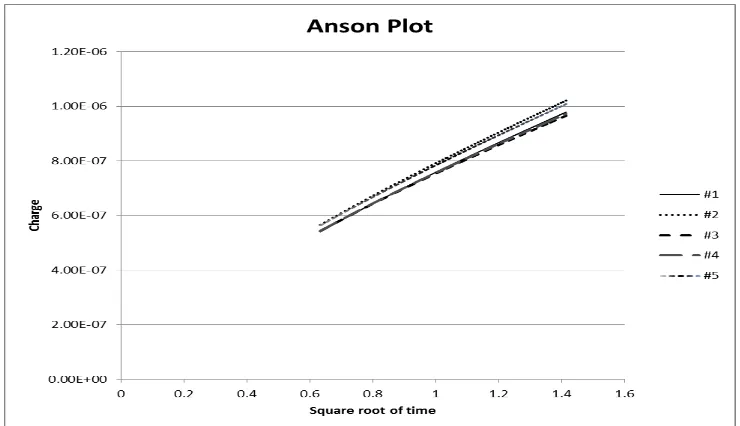
[image:5.596.113.483.521.734.2]Consequently, by using the Anson plot (Fig. 2) generated in the following chronocoulometric measurement and the Anson Equation (Eq.3) introduced previously, the real electrochemical surface area of the commercial screen-printed electrode was estimated as 0.80 mm2 (the coefficient of variation is 4.25%, while the confidence interval is 0.03%) (Tab. 1).
Table 1. Real electrochemical surface area of the screen-printed electrodes
Replicates slope C (μM) C (mol/cm3) D(cm2/sec) A (mm2)
1 6.29E-07 3027.5 3.03E-06 5.98E-08 0.79
2 6.24E-07 3027.5 3.03E-06 5.98E-08 0.77
3 6.88E-07 3027.5 3.03E-06 5.98E-08 0.85
4 6.44E-07 3027.5 3.03E-06 5.98E-08 0.79
5 6.65E-07 3027.5 3.03E-06 5.98E-08 0.82
0.80 Average
0.03 STDEV
4.25 Coefficient of Variation % 0.03 Confidence Interval (95%)
As can been in Tab. 1, the standard deviation of the real electrochemical surface area is quite small. In other words, a batch of screen-printed electrodes showed relatively consistent results for the real electrochemical surface area determination using the above method. As a result, it is suggested that the method could be considered reliable, since the reproducibility between replicate determinations for biosensors should be at least ± (5%-10%) [11].
Furthermore, as expected, the real electrochemical surface area of the screen-printed electrode is much larger than the geometrical electrode surface area, which is 0.25 mm2. The roughness factor [12] is 2.72 (ratio of electrochemical surface to the geometrical surface). This roughness factor could be attributed to the morphology of the working electrode paste. The rough surface of the working electrode paste was confirmed by scanning electron microscopy (SEM) in Fig. 3.
[image:6.596.143.454.467.716.2]
4. CONCLUSIONS
In conclusion, we have first demonstrated a simple and effective method using chronocoulometry and cyclic voltammetry for the determination of the real surface area of a screen-printed electrode. The resulting high roughness factor (ρ) of the working electrode paste was in agreement with the image of SEM. This method should facilitate determination of the real surface area of commercially produced screen-printed electrodes thus improving quality control in this critically important industry, which serves the needs of people with diabetes.
ACKNOWLEDGEMENT
Financial support from Pelikan Technologies, Inc. is gratefully acknowledged.
References
1. X. Adolphe, S. Martemianov, I. Palchetti, M. Mascini, J. Appl. Electrochem. 35 (2005) 599. 2. R.H. Jung, K.K. Lian, C. Li, H. Wu (1998) US patent 5,728,181.
3. G. Jarzqbek, Z. Borkowska, Electrochim. Acta. 42 (1997) 2915. 4. S. Trasatti, A. Petri, Pure & Appl. Chern. 63 (1991) 711.
5. T. Grygar, F. Marken, U. Schröder, F. Scholz, Collect. Czech, Chem. Commun. 67 (2002) 163. 6. J. F. Rusling, M.Y. Brooks, Anal. Chem. 56 (1984) 2147.
7. A.W. Bott, W.R. Heineman, Curr. Separ. 4 (2004) 121. 8. F.C. Anson, Anal. Chem. 38 (1966) 54.
9. B. E. H. Saxberg, B. R. Kowalski, Anal. Chem. 51 (1979) 1031. 10.E.T. Powner, F. Yalcinkaya, Sensor Rev. 17 (1997) 107.