Glass
.
White Rose Research Online URL for this paper:
http://eprints.whiterose.ac.uk/146537/
Version: Published Version
Article:
Kaspar, T.C., Ryan, J.V., Pantano, C.G. et al. (15 more authors) (2019) Physical and
optical properties of the International Simple Glass. npj Materials Degradation, 3 (1). 15.
ISSN 2397-2106
https://doi.org/10.1038/s41529-019-0069-2
eprints@whiterose.ac.uk
https://eprints.whiterose.ac.uk/
Reuse
This article is distributed under the terms of the Creative Commons Attribution (CC BY) licence. This licence
allows you to distribute, remix, tweak, and build upon the work, even commercially, as long as you credit the
authors for the original work. More information and the full terms of the licence here:
https://creativecommons.org/licenses/
Takedown
If you consider content in White Rose Research Online to be in breach of UK law, please notify us by
ARTICLE
OPEN
Physical and optical properties of the International
Simple Glass
Tiffany C. Kaspar 1, Joseph V. Ryan1, Carlo G. Pantano2, Jarrett Rice2, Cory Trivelpiece 2, Neil C. Hyatt3, Claire L. Corkhill 3, Colleen Mann3, Russell J. Hand 3, Michael A. Kirkham3, Charles L. Crawford4, Carol M. Jantzen4, Jincheng Du 5, Xiaonan Lu5,
Michael T. Harrison6, Cody Cushman7, Matthew R. Linford7and Nicholas J. Smith8
Radioactive waste immobilization is a means to limit the release of radionuclides from various waste streams into the environment over a timescale of hundreds to many thousands of years. Incorporation of radionuclide-containing wastes into borosilicate glass during vitrification is one potential route to accomplish such immobilization. To facilitate comparisons and assessments of
reproducibility across experiments and laboratories, a six-component borosilicate glass (Si, B, Na, Al, Ca, Zr) known as the International Simple Glass (ISG) was developed by international consensus as a compromise between simplicity and similarity to waste glasses. Focusing on a single glass composition with a multi-pronged approach utilizing state-of-the-art, multi-scale experimental and theoretical tools provides a common database that can be used to assess relative importance of mechanisms and models. Here we present physical property data (both published and previously unpublished) on a single batch of ISG, which was cast into individual ingots that were distributed to the collaborators. Properties from the atomic scale to the macroscale, including composition and elemental impurities, phase purity, density, thermal properties, mechanical properties, optical and vibrational properties, and the results of molecular dynamics simulations are presented. In addition, information on the surface composition and morphology after polishing is included. Although the existing literature on the alteration of ISG is not extensively reviewed here, the results of well-controlled static alteration experiments are presented here as a point of reference for other performance investigations.
npj Materials Degradation (2019) 3:15 ; https://doi.org/10.1038/s41529-019-0069-2
INTRODUCTION
The disposition of radioactive wastes originating from various sources including the cleanup of legacy wastes from heavy metals separations, used nuclear fuel (UNF) from power generation, and the wastes generated in UNF recycling programs is a major environmental and human health concern. In most countries, vitrification is seen as the best-demonstrated solution for immobilizing radionuclides for disposal.1 Borosilicate glass, in
particular, can incorporate many different elements, rendering it appropriate to accommodate radioactive wastes of different compositions. In addition, technologies are well established for processing borosilicate glasses at industrial scales under hot-cell constraints. For these reasons, borosilicate glasses were selected for the immobilization of high-level waste and are used in all reprocessing nations.
One of the primary objectives of radioactive waste immobiliza-tion is to limit the release of radionuclides into the biosphere over long time periods, often covering many thousands of years. The high chemical durability of borosilicate glass means that direct experimental studies of glass behavior at laboratory timescales cannot be simply extrapolated to performance lifetimes of hundreds to thousands of years. Instead, meaningful experimental
data are collected at shorter timescales and (often) under accelerated corrosion conditions, and this information is used to develop a mechanistic understanding of the processes responsible for glass degradation and radionuclide release. Robust models based on this understanding must be developed in order to calculate the long-term behavior of a glass waste form.2,3
The value of such an understanding has been recognized by the international scientific community involved in waste glass corrosion,2 as well as the broader waste disposal community.4
Given the complexity of the various mechanisms of glass corrosion, the waste glass community recognized the usefulness of analyzing simpler glass compositions to avoid potentially complex interactions. Using a single glass composition for study that is simple but representative of borosilicate waste glasses enables the direct comparison of results from multi-pronged research efforts that utilize state-of-the-art, multi-scale experi-mental and theoretical tools across laboratories. Combined, these results will provide fundamental insights into the corrosion behavior of the glass and will facilitate consensus regarding the rate-controlling process(es) of glass corrosion. To that end, a six-component glass, known as the International Simple Glass (ISG), was designed in 2011 to be a compromise between simplicity and similarity to waste glasses.2The composition of ISG was selected
Received: 8 May 2018 Accepted: 14 December 2018
1Paci
fic Northwest National Laboratory, Richland, WA 99354, USA;2Materials Research Institute, Department of Materials Science and Engineering, Pennsylvania State University,
University Park, PA 16802, USA;3ISL, Department of Materials Science and Engineering, University of Sheffield, Sheffield S1 3JD, UK;4Savannah River National Laboratory, Aiken,
SC 29808, USA;5Department of Materials Science and Engineering, University of North Texas, Denton, TX 76203, USA;6National Nuclear Laboratory, Sellafield CA20 1PG Cumbria,
UK;7Department of Chemistry and Biochemistry, Brigham Young University, Provo, UT 84602, USA and8Corning Research and Development Corporation, Corning, NY 14831,
USA
such that the ratio of the main components are equal to those of SON68, the inactive reference glass for the R7T7 glass being produced at the AREVA NC La Hague plant in France.2This was
chosen because of the wealth of data already obtained worldwide on the SON68 composition (see, for example, refs.5–9), its similarity
to other borosilicate glasses under consideration, and the fact that glass of the ISG composition (denoted CJ4) had recently been subjected to a 14-year static dissolution test.10 Through closely
coupled theory, experiment, and modeling, the work performed on the ISG composition will help to provide understanding of key mechanisms that control glass corrosion under different environ-mental conditions, ultimately leading to the development of robust corrosion models that can predict the extent of glass alteration in a wide variety of local environments throughout the lifetime of a geologic repository.
Here we summarize the physical properties of ISG from the atomic scale to the macroscale. This paper serves as a lead-in to a special issue of npj Materials Degradation (volume 2) devoted to ISG. It presents both a review of published data on unaltered ISG and a compilation of unpublished data collected by many of the research groups involved in the study of ISG. Interested readers are encouraged to contact the relevant research group for further information. Although the existing literature on the alteration of ISG is not extensively reviewed here, the results of well-controlled static alteration experiments (American Society for Testing Materials (ASTM) C1285) are presented as a point of reference for other performance investigations. The basic property informa-tion presented here complements the articles in the ISG special issue that deal directly with the alteration behavior of ISG. Understanding the detailed physical properties of ISG is one key to
developing accurate alteration models and provides data against which to test atomistic models.
RESULTS ISG composition
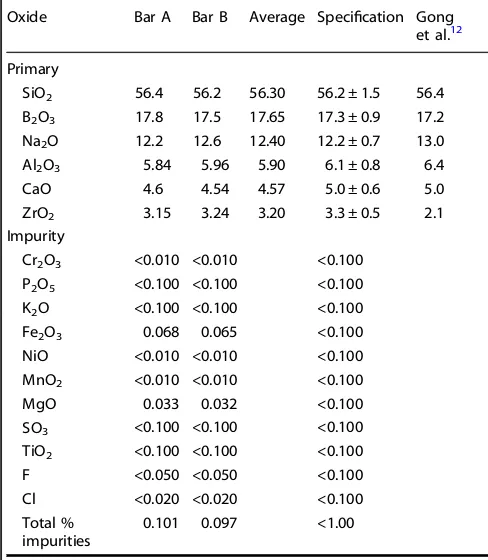
The compositions of two bars of ISG (denoted Bar A and Bar B) were measured immediately following synthesis to evaluate whether the synthesized glass composition fell within the specified tolerances and to get a measure of the compositional homogeneity from block to block.11 Six samples were cut from
each bar and measured independently. The samples were digested using three different digestions (KOH, LiBO2, and Na2O2/NaOH) and analyzed by both inductively coupled plasma–atomic emission spectroscopy (ICP-AES) for cation analysis and ion chromatography (IC) for anion (F and Cl) analysis. Two sets of ICP-AES and IC measurements were performed on each digestion, and the resulting 12 measurements for each bar from each technique were averaged. The mass% composition of each bar (average of 12 measurements, normalized to 100 mass%) is shown in Table 1, along with the compositional tolerances specified before synthesis.11 For all six oxide components, the
measured compositions fall within the specified tolerances. Some differences are present between the two bars (e.g., Al2O3), but these differences do not exceed the tolerance.
The composition of another bar of ISG was measured independently using ICP-AES after the glass was dissolved by LiB fusion.12 The resulting composition is also presented in
Table1. In contrast to the measurements of Bar A and Bar B, the concentration of two oxides falls outside the specified tolerances: Na2O is higher than expected, while ZrO2is lower than expected. Impurity concentrations were specified to be <0.1 mass% for
each individual impurity, with the total impurity concentration <1.0%. As presented in Table1, this specification was easily met. Only Fe2O3and MgO were present above the detection limit of ICP-AES. Individually they fall below the 0.1 mass% limit and, when combined, do not exceed 1.0 mass%.
Phase separation
Multicomponent glasses can potentially undergo phase separa-tion into two or more distinct amorphous regions or crystalline secondary phases. The alteration behavior of phase-separated glass differs markedly from its single-phase counterpart due to the different composition, density, and surface tension of the separated phase(s).13 To ensure that the alteration results
obtained for ISG can be attributed to intrinsic properties of the glass without the influence of phase-separated components, it is necessary to evaluate ISG ingots for phase separation.
Taylor14provides a simple approach to predict immiscibility in
complex borosilicate glass systems by evaluating the composition of the Na2O–B2O3–SiO2(NBS) sub-mixture of the multi-component glass relative to the immiscibility dome in the NBS ternary phase diagram.15 This so-called
“Taylor Rule” was later extended by Peeler and Hrma16 for application to alkali-borosilicate glasses.
They concluded that glasses with normalized alkali concentrations <20 mass% were predicted to undergo immiscible phase separation, as evidenced by microstructural analysis by secondary electron microscopy and (in some cases) transmission electron microscopy (TEM) of 24 simulated waste glasses. The normalized alkali concentration (NAlk) is calculated from the composition (g, in mass fraction) as:
NAlk¼ gNa2O
þ0
:67gk2Oþ2gLi2O
gNa2Oþ0:67gK2Oþ2gLi2OþgSiO2þgB2O3
[image:3.595.45.289.77.357.2]´100% (1)
Table 1. Composition of ISG ingots, in mass%11
Oxide Bar A Bar B Average Specification Gong
et al.12
Primary
SiO2 56.4 56.2 56.30 56.2 ± 1.5 56.4
B2O3 17.8 17.5 17.65 17.3 ± 0.9 17.2
Na2O 12.2 12.6 12.40 12.2 ± 0.7 13.0
Al2O3 5.84 5.96 5.90 6.1 ± 0.8 6.4
CaO 4.6 4.54 4.57 5.0 ± 0.6 5.0
ZrO2 3.15 3.24 3.20 3.3 ± 0.5 2.1
Impurity
Cr2O3 <0.010 <0.010 <0.100
P2O5 <0.100 <0.100 <0.100
K2O <0.100 <0.100 <0.100
Fe2O3 0.068 0.065 <0.100
NiO <0.010 <0.010 <0.100
MnO2 <0.010 <0.010 <0.100
MgO 0.033 0.032 <0.100
SO3 <0.100 <0.100 <0.100
TiO2 <0.100 <0.100 <0.100
F <0.050 <0.050 <0.100
Cl <0.020 <0.020 <0.100
Total %
impurities 0.101 0.097 <1.00
Bar A and Bar B are averages of 12 measurements each. The specifications were determined before synthesis. For comparison, an independent composition measurement of a different ISG ingot by Gong et al.12is also tabulated
ISGInternational Simple Glass
2
1234567
For the case of ISG,gK2O¼gLi2O¼0, and Eq. (1) reduces to:
NAlk¼ gNa2O
gNa2OþgSiO2þgB2O3
´100% (2)
With the ISG glass composition ofgNa2O¼0:122 mass fraction,
gSiO2 ¼0:562 mass fraction, andgB2O2 ¼0:173 mass fraction from
Table1,NAlkis calculated to be 14.2%. This value is less than Peeler and Hrma’s16criterion of a normalized alkali concentration of 20
mass%, and thus the composition of ISG is potentially subject to amorphous phase separation.
The Thermodynamic Hydration Energy Reaction Model (THERMO) developed by Jantzen13,17 empirically assesses the
potential for liquid–liquid phase separation of a 14-component glass formulation. The discrimination function in the model purports to distinguish between homogeneous and phase-separated glasses on a compositional basis with glasses deemed to be homogeneous when the following equation is satisfied:
1:6035x 5:6478yþ210:9203<0 (3)
where y is the sum (in mass%) of “denser” components and x is the sum of“less dense”components. Applying this formula to six-component ISG,y=Al2O3+CaO (in the original formulation of Eq. (3), “minor sludge components” such as ZrO2 were not included in the calculation) andx=Na2O+SiO2+B2O3; the left side of Eq. (3) is then+13.5, suggesting that ISG is likely to phase-separate. However, in a simple glass composition such as ISG, the presence of ZrO2 may be significant. If the ZrO2 content is included in the calculation ofy, the left side of Eq. (3) becomes
−4.6, implying that ISG will remain single-phase. Taken together,
the results from Peeler and Hrma’s16assessment and the THERMO model13,17led us to conclude that ISG is near the phase separation
threshold.
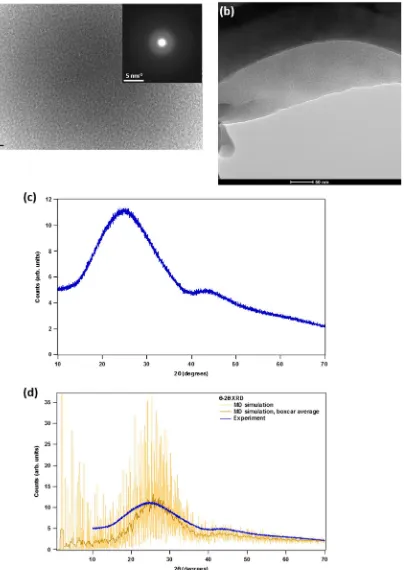
To investigate whether phase separation has occurred in ISG, cross-sectional TEM micrographs and selected area diffraction patterns were collected from an annealed glass monolith and a crushed, unannealed fiber and are presented in Fig. 1a, b, respectively. Thefigures show levels of contrast typical of those found in amorphous materials; no nanometer-scale regions of contrast are observed that would indicate inhomogeneity or crystallinity. The selected area diffraction pattern in Fig.1a reveals no spots or rings indicative of crystalline ordering. Further investigation of crushed (<75μm) and rinsed ISG by X-ray
diffraction (XRD) is presented in Fig. 1c. A zero background holder fabricated from single crystal silicon was used to eliminate spurious diffraction signals. The diffraction pattern in Fig. 1c is characterized by a principal symmetric diffuse scattering feature centered at 2θ~ 25°, and a second feature centered at 2θ~ 43°.
The feature at ~25° arises from a correlation length of around 3.5 Å, the origin of which is the average Si–Si separation distance (via the Si–O–Si linkage) of ~3.1 Å. The feature at ~43° corresponds to a shorter correlation length of around 2.0 Å. The presence of a second feature is sometimes an indication that the glass has phase-separated into two distinct amorphous phases. However, as seen in Fig.1d, the pattern calculated from a quenched, single-phase molecular dynamics (MD) simulation of ISG18 exhibits a
similar low-intensity feature centered around ~42–45°. Although the origin of this feature has not been determined, its presence in the calculated XRD pattern from single-phase ISG indicates that it is an intrinsic feature of the glass structure and likely not an indication of phase separation. Combined with the TEM micro-graphs in Fig.1a, b, it appears that the ISG ingots synthesized by Mo-Sci are homogenous, with these data providing no evidence that they have undergone liquid–liquid or crystalline phase separation.
Bulk density
The density of ISG is an important parameter in the analysis of solution composition data after alteration, such as calculations of the alteration layer equivalent thickness. To determine the density of ISG, it has been measured in both powder and monolithic forms by several techniques, and the resulting values are summarized in Table2. Employing the buoyancy method (Archimedes’method) in deionized (DI) water, the density was determined to be 2.509 ± 0.001 g cm−3, averaged over 8 total measurements on three
samples. A similar value was determined by Guerette et al.19The
density value determined by the specific gravity of solids method for a powder sample was slightly different. Measurements using helium pycnometry also resulted in slightly higher density values.
Atomic-scale structure of ISG from simulations
Despite the extensive research on borosilicate glasses, little is known about the details of their atomic-level short- and medium-range structures. Although these properties are challenging to assess experimentally in complex amorphous materials such as glasses, significant insight can be gained by modeling the amorphous structure within theoretical frameworks such as MD simulations. Generating an accurate atomic-level model of ISG can inform the analysis of glass alteration18,20and is one step toward
developing representative, atomic-scale simulations of glass alteration behavior.
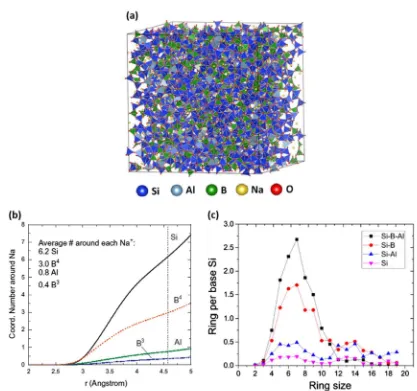
Ren et al.21 studied the atomic-scale structure of simpli fied variants of ISG without CaO and ZrO2 (referred to as“simplified ISG”(SISG); the mole fraction of CaO in ISG is added to Na2O, and likewise the mole fraction of ZrO2is added to SiO2, producing an SISG composition of 61.8 mol% SiO2, 16.0 mol% B2O3, 18.4 mol% Na2O, and 3.8 mol% Al2O3) with MD simulations using newly developed partial charge pairwise potentials, in which partial atomic charges in the long-range Coulombic interaction depend on the [Na2O]/[B2O3] and [SiO2]/[B2O3] ratios in the borosilicate glass. An initial, randomly generated atomic structure simulation was melted at 6000 K, gradually quenched to 300 K, then relaxed. A snapshot of the relaxed structure is presented in Fig.2a. This simulated heat treatment produced a glass structure with a density of 2.536 g cm−3, in good agreement with the experimental
density values in Table 2. No obvious phase separation was observed, although phase separation may be difficult to reproduce in MD simulations, given the limited timescale and relatively small system size. It was found that Na+plays a
charge-compensation role for four-fold coordinated B and Al, with a slight preference for Al (see Fig.2b). In simulated SISG, 78.4% of B ions were four-fold coordinated, which is a higher percentage than the 59% measured experimentally for ISG by solid-state nuclear magnetic resonance (NMR),22and 98.0% of Al ions were four-fold
coordinated, demonstrating that Al3+acts as a network former in
SISG. An investigation of the medium-range structure of SISG, which is difficult to access experimentally, showed that B ions play an important role connecting Si and Al networks. Evidence of this is presented in Fig.2c, in which Si-Al ring sizes exhibit a broad distribution indicative of a fragmented network, whereas six-membered rings dominate when B is included in the analysis. Ren et al.21 hypothesized that, as B is preferentially leached during
glass dissolution, the remaining, altered glass will have a very fragmented, nanoporous network structure.21
Recently, the development of boron oxide potentials that enable the simulation of multicomponent oxide borosilicate glasses have led to MD simulations of the full ISG composition.18
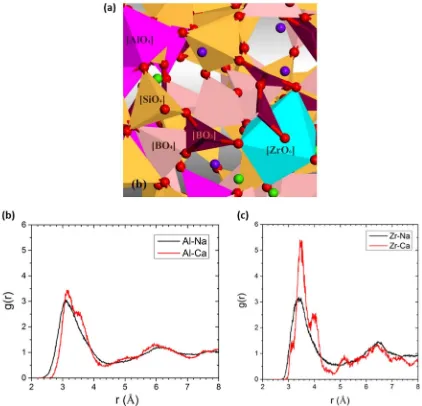
Fig.3a shows a snapshot of a portion of the simulation cell of ISG (the full cell is 24,000 atoms), illustrating the network structure. Table 3 summarizes the simulation results in terms of bond distance (r–O), average cation coordination number (CNavg), and CN distributions. The average boron coordination is calculated to be 3.59, with a4B value (fraction of B as BO4) of 59%, which is in
reasonable agreement with recent NMR results of 52%4B.18At the same time, the average Al coordination is around 4, consistent with the simplified ISG described earlier.21 Zr coordination is
found to be 5.7, with the majority (86%) being six-fold
coordinated. The Si–O, Al–O, and Na–O bond distances are in good agreement with previous experimental results on various silicate glasses.23–25An important structural issue is to identify the
types of modifiers that provide charge compensation of the
glass-Fig. 1 aTransmission electron microscopic (TEM) micrograph of as-synthesized International Simple Glass (ISG) as crushed powder. Inset:
selected-area diffraction pattern.bTEM micrograph of unannealed ISGfiber as crushed powder.cPowder X-ray diffraction (XRD) pattern (θ–θ
reflection mode) of as-synthesized, crushed ISG, measured using a single crystal silicon zero background holder.dCalculation of Cu Kαpowder
XRD pattern using a 6000-atom unit cell taken from an molecular dynamics simulation of ISG,18boxcar average of calculated pattern, and
[image:5.595.110.514.58.628.2]former oxygen polyhedra ([AlO4]− and [ZrO6]2−). This can be
studied from the Na/Ca-Al/Zr pair distribution functions shown in Fig.3b, c. It can be seen that Ca and Na have similar probabilities of being the charge compensation ion for four-fold-coordinated
Al, but Ca has a slightly higher probability of being the charge compensation ion for six-fold-coordinated Zr.
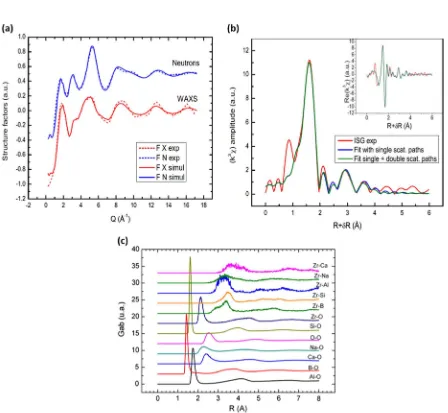
Bouty et al.26,27 used the Empirical Potential Structure Re fi ne-ment (EPSR) method, a reverse Monte Carlo technique, to develop an atomistic simulation of ISG from experimental wide-angle X-ray scattering (WAXS), neutron diffraction,11B NMR, and Zr
K-edge X-ray absorption near edge structure28 and extended X-ray
absorptionfine structure (EXAFS) data collected on ISG that was fabricated in their laboratory. The EPSR method uses a combined Lennard-Jones and Coulomb potential; once a stable glass structure is achieved, a small perturbation term (an “empirical potential”) is introduced which evolves during the simulation to better fit the experimental structure factor data. With this approach, the structure factors determined experimentally from WAXS, neutron diffraction, and EXAFS could be reproduced reasonably well, as shown in Fig. 4. The bond distances (r–O) and coordination numbers (CNavg) from these simulations are consistent with previous experimental results26 and with the
values obtained by Collin et al.,18as shown in Table3. From the
EPSR simulations, it is found that there is a stronger interaction between Zr and Na and Ca than between Zr and Si.27EXAFS data, fitted with models informed by the EPSR simulation results, reveal that B may be present in the local environment around Zr.26
Fig. 2 Molecular dynamics (MD) simulations of simplified International Simple Glass (SISG) glass.21aSnapshot of SISG structure after melt
quenching process.bThe average coordination number of Si, Al,3B, and4B around each Na+.3B and4B refer to three-fold and four-fold
[image:6.595.39.284.124.247.2]coordinated B, respectively.cRing size distribution of SISG. Reprinted from ref.21with permission from Elsevier
Table 2. Density measurements of ISG
Method Sample Average density Reference
Buoyancy Monolith 2.509 ± 0.001 This worka
Archimedes, DI water Not specified
2.50 ref.19
Specific gravity of solids,
DI water Powder 2.523 ± 0.042 This work
b
He-pycnometry Powder 2.513 This workc
He-pycnometry Not
specified 2.533 ± 0.003 This work
d
DIdeionized,ISGInternational Simple Glass
aData from the Savannah River National Laboratory bData from the University of North Texas cData from the Pennsylvania State University dData from the University of Shef
field
[image:6.595.81.498.309.700.2]Thermal properties
Quantifying the thermal properties of ISG, such as its glass transition temperature and viscosity, is necessary in order to understand the glass structure of a specimen given its thermal history. The glass transition temperature, Tg, of ISG has been measured variously by differential scanning calorimetry (DSC), differential thermal analysis (DTA),12,19 and dilatometry;12,19 the
measured values are given in Table4. The effect of heating rate on the measured value ofTgby DSC was characterized. For a heating rate of 5 °C min−1, the T
gof ISG was measured as 524 °C, which increased to 577 °C at a heating rate of 20 °C min−1. Gong et al.12
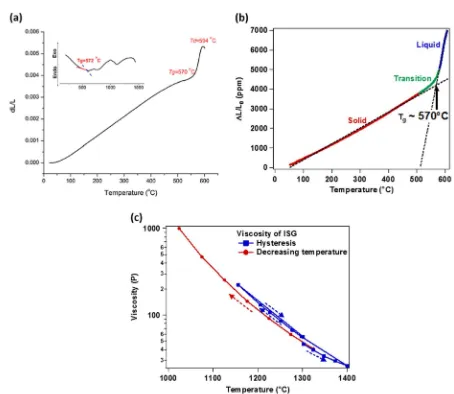
observed two broad exothermic peaks at 705 °C and 1000 °C by DTA (Fig.5a, inset), which most likely correspond to crystallization temperatures.
The thermal expansion curve of ISG as measured by dilatometry is presented in Fig.5b. The intersection of linesfit to the solid and liquid regions is taken to representTgand gives a value of ~570 °C. This value, and the shape of the thermal expansion curve, matches well with that measured by Gong et al.12 Similar results, with Tg=575 °C, were obtained by Guerette et al.19
Viscosity measurements were performed on ISG29 using a
Harrop high-temperature viscometer as described previously.30
The initial measurement sequence used a hysteresis loop that started at the known processing melt temperature of the ISG glass at 1300 °C. The viscosity was measured in 25 °C increments up to 1400 °C, then measurements were made starting at 1300 °C in decreasing 25 °C increments through 1200 °C, followed by final measurements at 1156 °C and 1300 °C. The measured viscosity vs. temperature is shown in Fig. 5c. The viscosity decreases monotonically from 131.2 P at 1206 °C to 56.5 P at 1301 °C and 26.0 P at 1400 °C. A different sequence was also applied with a separate sample of the ISG glass that started viscosity measure-ments above the melt temperature at 1325 °C, with successive decreasing increments of 50 °C, down to a final temperature of 1024 °C. This viscosity vs. decreasing temperature plot is also shown in Fig.5c. At 1024 °C, the viscosity of ISG is 999.4 P.
Mechanical properties
Glass matrices utilized to stabilize nuclear waste will experience cracking as they cool from the molten state, with the degree of
Fig. 3 aSnapshot of portion of International Simple Glass structure from molecular dynamics simulations. The orange, magenta, cyan, dark
red, and light pink polyhedrons correspond to Si, Al, Zr, [BO3], and [BO4] units, respectively. The red, purple, and green spheres represent
oxygen, sodium, and calcium atoms, respectively.b,cModifier cation (Na, Ca)–Alband–Zrcpair distribution functions (g(r)). Reproduced from ref.18under the terms of the Creative Commons CC BY license
[image:7.595.91.513.57.463.2]Fig. 4 Empirical Potential Structure Refinement (EPSR) simulations of experimental data obtained on International Simple Glass (ISG).
aStructure factors from wide-angle X-ray scattering (F X exp) and neutron diffraction (F N exp) data, along with the respective structure factors from the EPSR simulations (F X simul and F N simul).26bISGk3
χfunction from ZrK-edge extended X-ray absorptionfine structure (red),
along withfits including only single scattering paths (blue) or single and double scattering paths (green).27Inset: real part of
k3χ.cPartial pair
distribution functions for ISG.aandbreproduced from ref.26with permission from Elsevier.creproduced from ref.27with permission from
[image:8.595.40.545.86.218.2]Elsevier
Table 3. Summary of ISG glass structure from simulations: bond lengthrX−O, cation average coordination number (CNavg), and corresponding CN distributions in ISG
rX−O(Å)
26 CN
avg26 rX−O(Å)
18 CN
avg18 Coordination number (CN) distribution (%)18
3 4 5 6 7 8 9 ≥10
Si 1.61 ± 0.01 4.0 1.61 4.00 — 100 ± 0.0 — — — — — —
B 1.42 ± 0.01 3.47 1.45 ([3]B)
1.55 ([4]B) 3.59 41.3 ± 0.5 58.7 ± 0.5 — — — — — —
Al 1.72 ± 0.01 4.0 1.77 4.00 0.5 ± 0.2 98.6 ± 0.2 0.9 ± 0.2 — — — — —
Zr 2.09 ± 0.01 6.04 2.10 5.68 — — 10.7 ± 1.2 85.7 ± 0.6 3.6 ± 0.7 — — —
Na 2.47 7.42 0.1 ± 0.1 0.6 ± 0.1 5.9 ± 0.5 17.6 ± 0.9 28.1 ± 0.6 27.5 ± 0.6 15.4 ± 1.4 3.5 ± 1.9
Ca 2.42 6.62 — 1.8 ± 0.8 11.2 ± 1.7 32.9 ± 3.3 34.3 ± 2.3 16.1 ± 0.4 3.5 ± 0.6 —
O 2.59 — — — — — — — — —
ISGInternational Simple Glass
Reproduced from ref.26with permission from Elsevier and ref.18under the terms of the Creative Commons CC BY license
[image:8.595.70.518.261.674.2]cracking dependent on the mechanical strength of the waste form, the thermal expansion properties (particularly thermal expansion mismatch between the glass and the canister), and the cooling rate and associated temperature gradient across the canister profile. In addition, ballistic radioactive decay events can generate both
structural damage and helium or oxygen bubbles, all of which lead to static pressure build-up and volumetric swelling.19Given these
stresses, it is helpful to understand the mechanical properties of glasses used to immobilize nuclear waste.
The reduced Young’s modulus (Er) was measured by nanoin-dentation of the polished ISG surface (1μm diamond paste, then
annealed to 520 °C) and found to be 81 ± 3 GPa, as presented in Table 5. This result can be compared to those by Hopf and Pierce,31 who measured the polished surface (1
μm diamond
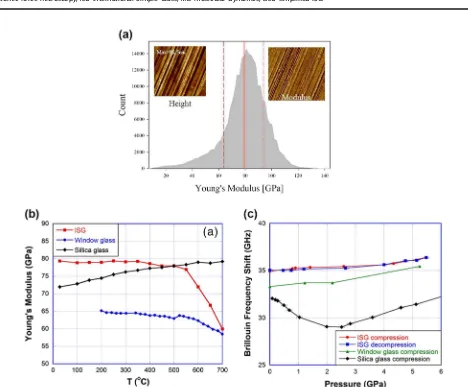
lapping disc) of ISG with atomic force microscopy (AFM). Analysis of the force–distance curves generated at each pixel of the AFM image can provide an estimate of the local modulus, adhesion force, energy dissipation, and deformation of the glass. Figure6a presents the topology image and mechanical property estimates for 1 of the 15 regions measured on the polished ISG surface. The derived Young’s modulus (E) at each pixel is plotted as a histogram in Fig. 6a. The average modulus from this plot is E=78.8 ± 15.1 GPa, which matches well with the value from nanoindentation (Table5).
The temperature-dependent Young’s, bulk (K), and shear (G) moduli were determined by Guerette et al.19using Brillouin light
[image:9.595.48.292.140.251.2]scattering. Room temperature moduli values are given in Table5, and the temperature dependence of Young’s modulus is plotted in Fig. 6b. The room temperature value of Young’s modulus is ~79 GPa, which is consistent with the nanoindentation and AFM31
Table 4. Glass transition temperature (Tg) of ISG
Method Tg(°C) Reference
DTA 575 ± 3 °C ref.19
DTA 572 °C ref.12
Dilatometry 575 ± 3 °C ref.19
Dilatometry 570 °C This worka
Dilatometry 570 °C ref.12
DSC 577 °C This worka
DSC 577 ± 3 °C This workb
DSCdifferential scanning calorimetry,DTAdifferential thermal analysis,ISG International Simple Glass
aData from the Paci
fic Northwest National Laboratory
bData from the University of North Texas
Fig. 5 aThermal expansion curve measured by dilatometry.12Inset: differential thermal analysis curve.
bThermal expansion curve measured by dilatometry. Dashed lines indicate linearfits to solid and liquid regions, respectively. (Data from the Pacific Northwest National Laboratory).
cViscosity measured by Harrop high-temperature viscometer.29
[image:9.595.72.526.307.701.2]results presented above (Table 5). For comparison of the temperature-dependent properties, pure silica glass (Suprasil 300) and window glass (71.2 mass% SiO2, 13.6 mass% Na2O, 9.7 mass% CaO, 4.0 mass% MgO) were also measured and plotted in Fig.6b. The temperature dependence of the Young’s modulus of ISG exhibits a slightly negative slope from room temperature to 550 °C. This behavior, taken in conjunction with the slightly negative slope in bulk modulus and zero slope in sheer modulus over the same temperature range,19 falls between that of
abnormal glasses (e.g., silica), whose elastic moduli increase with temperature, and normal glasses (e.g., window glass), whose
elastic moduli decrease with temperature. Beyond 550 °C, there are significant decreases in elastic moduli that correlate with the onset of structural softening accompanying the glass transition.
Young’s, bulk, and shear moduli were calculated for SISG (Ca-and Zr-free ISG) simulations using MD theory21 and are also
tabulated in Table 5. The calculated value of bulk modulus matches well with the room temperature bulk modulus measured by Brillouin light scattering,19but the calculated values of Young
[image:10.595.39.558.199.268.2]’s and shear moduli are considerably larger than the experimental values. This discrepancy may be due to the modified composition of the simulated SISG. Another potential source of error in the
Table 5. Table of mechanical properties measured for ISG
Mechanical property Nanoindentation (GPa) AFM force curves (GPa)31 Brillouin light scattering (GPa)19 MD simulation of SISG (GPa)21
Young’s modulus 81 ± 3 78.8 ± 15.1 79.4 ± 0.3 95.8 ± 5.7
Bulk modulus — — 49.0 ± 0.2 47.3 ± 3.1
Shear modulus — — 32.3 ± 0.2 41.2 ± 2.4
Hardness 7.6 ± 0.6 — — —
Calculated values from MD simulations of SISG are also included
AFMatomic force microscopy,ISGInternational Simple Glass,MDmolecular dynamics,SISGsimplified ISG
Fig. 6 aHistogram of the pixel-by-pixel measurement of Young’s modulus of a polished International Simple Glass (ISG) surface. Left inset:
Atomic force microscopic height image (10 × 10μm2, 512 × 512 pixel map); right inset: Two-dimensional image of Young’s modulus.31
bYoung’s modulus of ISG as a function of temperature, measured by Brillouin light scattering. Window glass and pure silica glass are shown for comparison. Errors are ± 0.1 GPa.19
cBrillouin frequency shift of ISG glass as a function of pressure. Window glass and pure silica glass are shown for comparison. Errors are ± 0.1 GHz.19areprinted in part from ref.31with permission from Elsevier.bandcreprinted in part from ref.19
with permission from Elsevier
[image:10.595.59.527.285.672.2]simulations is the potential models employed, which overestimate the fraction of four-fold coordinated B (4B) for glass compositions with a high [Na2O]/[B2O3] ratio; a higher fraction of 4B leads to higher predicted moduli values.
To study the structure and elastic property evolution of ISG under pressure, Guerette et al.19 measured Brillouin light
scattering as a function of pressure up to 5.5 GPa. Quantitative elastic moduli values at elevated pressure could not be calculated, since the density and refractive index of ISG are not known as a function of pressure. However, the Brillouin frequency shift provides a qualitative measure of elastic moduli change with pressure. Figure6c plots the Brillouin frequency shift as a function of pressure for ISG, as well as window glass and silica glass. The overlap of the compression and decompression curves indicates that no permanent structural changes take place in ISG up to 5.5 GPa. In contrast to silica glass, ISG does not exhibit an elastic minimum. This implies that ISG does not provide enough space within the glass matrix for displacements through bond rotation that ultimately lead to permanent densification, in contrast to silica glass under pressure.
Optical and vibrational properties
Probing ISG with photons is a non-destructive way to elucidate the optical, electronic, and vibrational properties of the glass. Ultraviolet-visible (UV-Vis) spectroscopy and spectroscopic ellip-sometry (SE) provide complementary information on the optical constants (index of refraction) and absorption properties of ISG, while Raman spectroscopy reveals the vibrational signatures of moieties in the glass structure. These non-destructive techniques can be used in situ32or ex situ8,20,33to investigate the thickness,
structure, and composition of glass alteration layers. The detailed optical absorption properties also play a significant role in the analysis of ISG monoliths by atom probe tomography.34
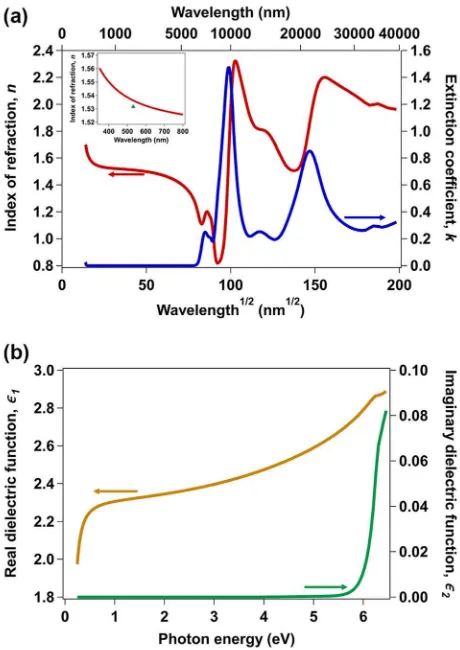
The full optical spectrum of ISG, from the UV to the infrared (IR) region, was mapped by simultaneouslyfitting an optical model to UV-visible SE, IR SE (Corning Research and Development Corpora-tion), and UV-Vis absorption34data. The optical model consisted of
a set of more than ten Gaussian oscillators to model the complex absorbance features in the IR region. From the absorption data, ISG is completely transparent in the visible region <2.25 eV (>550 nm), with the band edge located at ~4.1 eV (~300 nm). A Cody–Lorentz oscillator was placed at 12.5 eV, with its band edge set to 5.8 eV, to capture the effect of out-of-range absorptions on the refractive index over the measured spectral region. The optical constants of ISG from the optical model are plotted in Fig.7a as the index of refraction, n, and extinction coefficient, k, vs. the square root of wavelength. As shown in the inset, the refractive index in the visible region matches well with the value of 1.5315 ± 0.00002 determined by Guerette et al.19at 532.18 nm with a prism
coupler. The real and imaginary parts of the complex dielectric function of ISG are plotted in Fig.7b.
Du et al. prepared transition metal (TM) and rare earth (RE) doped ISG to measure the optical absorption properties.34 They
found that TM dopants add broad peaks in the transparent region of ISG. RE dopants, in contrast, lower the overall magnitude of the absorption coefficient and introduce more complex, sharper features in the transparent region than TM dopants.
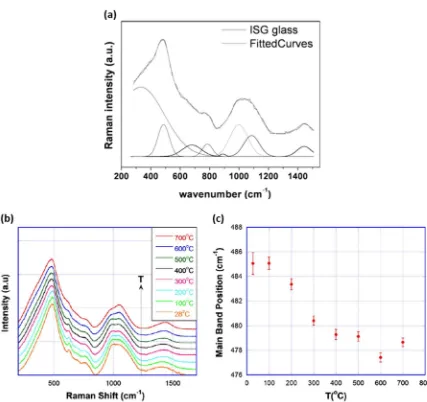
Abdelouas et al.35 measured the Raman spectrum of an ISG
coupon, as shown in Fig.8a. The spectrum was deconvolved with eight Gaussian curves. Not all the Gaussian peaks could be assigned owing to the complexity of the glass. However, some broad assignments can be tentatively made, as indicated in Table6. The broad band at 900–1200 cm−1was deconvolved
into four Gaussian peaks assigned toQ1,Q2, andQ3species, where Qnrepresents SiO4tetrahedra withnbridging oxygens. It should be noted that, although the assignment of Raman features to distinct Qn species is accepted practice,36 a recent study of the
vibrational spectra of a variety of silicate glasses by IR spectro-scopy emphasized that these are collective vibrations occurring in regions of the glass network where a givenQnspecies is present.37 The broad band centered at 488 cm−1is assigned to the twisting
and stretching modes of Si–O–Si. Abdelouas et al.35assigned the broad feature observed at ~680 cm−1 to a poorly crystalline
calcium silicate.38,39However, the presence of calcium silicates at a
detectable level is unlikely, given the low Ca content of ISG (<5 mass% CaO). More likely, this feature arises from vibrational modes associated with borosilicate rings.19,40
Guerette et al.19measured the Raman spectra of ISG glasses as a
function of temperature and pressure. In Fig.8b, it can be seen that the Raman spectra do not change appreciably upon heating to 500 °C. This is consistent with the measurements of elastic moduli in the same temperature range, which were found to be relatively insensitive to temperature (see Fig.6b).19From 500 to
700 °C, some Raman features become less intense, notably the 630 cm−1 peak (breathing mode of borosilicate rings) and
950–980 cm−1(Q
2species). Figure8c plots the shift of the main Raman band around 500 cm−1, attributed to Si–O–Si vibrational
modes (Table6), as the temperature increases. The peak position shifts lower with increasing temperature, which indicates greater Si–O–Si bond angles accompanying volume expansion. No significant change in the Raman spectrum of ISG is observed
before and after compressing to 5.5 GPa,19 corroborating the
Brillouin frequency shift data (Fig.6c), which showed that ISG is relatively impervious to pressure changes in this range.
Fig. 7 Optical properties of International Simple Glass (ISG).aIndex of refraction (left axis) and extinction coefficient (right axis) of ISG plotted against the square root of wavelength. Inset: Index of refraction in the visible wavelength range vs. wavelength (line) and index value determined by prism coupler measurement19(symbol). b Real (left axis) and imaginary (right axis) components of the dielectric function of ISG
[image:11.595.320.550.57.382.2]Polished surfaces of ISG
Studies on the dissolution behavior of silicate glasses have suggested that the surface morphology and composition can greatly affect the dissolution or alteration rate.12,41 Gin et al.41
measured the dissolution rate of ISG from a glass coupon with only one polished side; the reactive surface area of the coupon was determined to be 1.7 times the geometric surface area. In a detailed follow-up study, Fournier et al.42showed that the reactive
surface area of crushed and sieved ISG powder, calculated assuming that the initial dissolution rate is the same as from a polished ISG monolith, is 1.3 times greater than the geometric surface area calculated assuming the particles are spherical, while Brunauer–Emmett–Teller analysis of nitrogen or krypton gas adsorption data suggests surface areas that are 1.9 times greater than the reactive surface area. These results have a profound impact on the accuracy of dissolution rates measured for crushed glass powders. It is also important to understand the morphology and composition of the polished surface of ISG monoliths that are placed in contact with aqueous solutions during corrosion experiments.
Hopf and Pierce31measured surface topology via tapping-mode
AFM of ISG monolith surfaces after polishing in water with
Fig. 8 aRaman spectrum of International Simple Glass (ISG) glass (top curve). Spectrum was deconvolved with eight Gaussian curves (bottom
curves;fit is overlayed on experimental curve).35bRaman spectrum of ISG glass as a function of temperature.19cShift of main band position
frombas a function of temperature.19
areprinted from ref.35with permission from John Wiley and Sons.
bandcreprinted from ref.19with
[image:12.595.77.504.50.452.2]permission from Elsevier
Table 6. Tentative assignment of vibrational bands observed in Raman spectra of ISG19,35
Species Vibrational band
frequency35 Vibrational bandfrequency19
Ca-O polyhedra 325 cm−1
Si-O-Si twist, stretch 488 cm−1 500 cm−1 Calcium silicate
(poorly crystalline) 680 cm −1
B-O rings, breathing 630 cm−1
Q1 896 cm−1
Q2 998 cm−1
Q3 1085 cm−1
B–O stretch 1442 cm−1 1200–1550 cm−1
ISGInternational Simple Glass
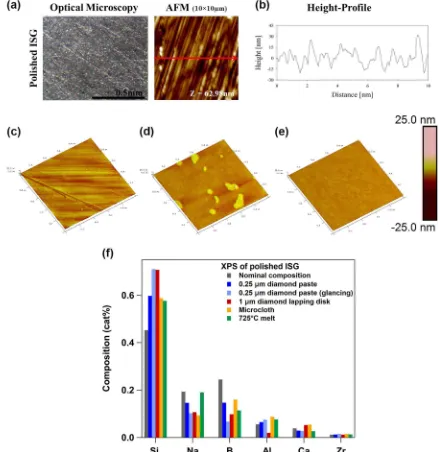
[image:12.595.37.283.579.716.2]diamond lapping discs down to 1μm. Resulting optical micro-scope and AFM images are shown in Fig.9a, and a height profile corresponding to the AFM image is presented in Fig. 9b. After polishing, the glass surface transforms into a relatively smooth and flat surface that contains a streaky and somewhat parallel microstructure. A comparison of AFM root mean square (RMS) roughness values for the polished and unpolished glass surfaces suggests that the RMS roughness of the polished sample (10 ± 3 nm) is 50 times lower than the unpolished sample (440 ± 180 nm). Fournier et al.42 obtained a very similar surface
morphology for ISG monoliths polished with 1μm diamond lapping disks and imaged by AFM. The RMS roughness of these monoliths was calculated to be 1.6 ± 0.3 nm; at this level of roughness, the difference between the surface area modified by the roughness value and the value calculated from gross sample geometry is <1%.
AFM images (1 × 1μm2) measured by Gong et al.12 are
presented in Fig.9c–e. Figure9c presents an ISG monolith that was cut from an ingot with a diamond saw, planarized with silicon carbide grinding pads, and then sequentially polished using a
Fig. 9 Polished International Simple Glass (ISG) surfaces.aOptical micrographs (×240 magnification) and 10 × 10μm2tapping-mode atomic
force microscopic (AFM) images of ISG polished with 1μm diamond lapping discs.31bLine profile corresponding to the red line ina.31c–e1 ×
1μm2tapping-mode AFM images of ISG polished with diamond suspension spray and Microcloth polishing pad (c), as-cut ISG surface heat
treated at 675 °C for 1 h (d), and as-cut ISG surface heat-treated at 725 °C for 1 h (e).12fSurface composition of ISG calculated from X-ray
photoelectron spectroscopic spectra. Spectra from surfaces polished with 0.25μm diamond paste (data from the Pacific Northwest National
Laboratory) and 1μm diamond lapping disk31 were quantified with standard relative sensitivity factors. Surface polished with 0.25μm
diamond paste was analyzed at normal emission and at glancing emission, which is more surface sensitive. Microcloth and 725 °C melt surface spectra were quantified with relative sensitivity factors determined from cleaved ISG.12aandbreprinted in part from ref.31with permission
[image:13.595.80.519.60.512.2]Buehler manual polisher, a Buehler Microcloth polishing pad, and 6μm to 0.05μm oil-based diamond suspension sprays. In Fig.9d, e, the surface topology of freshly cut ISG monoliths that were heat treated in a preheated oven at 675 and 725 °C, respectively, for 1 h are shown. These heat-treated samples were subsequently annealed at 570 °C for 3 h followed by cooling in the furnace overnight (∼12 h). Similar to the results of Hopf and Pierce31 (Fig.9a, b), the polished surfaces (see also ref.12) exhibit relatively
smooth surfaces with linear features/grooves. It is assumed that these linear features are scratches associated with the polishing of the surfaces.12The RMS roughness value of this surface is 1.10 ±
0.07 nm. Images of the melt surfaces are significantly different than the polished surface, as seen in Fig.9d, e. The melt surface processed at 675 °C consists of a smooth surface with randomly distributed positive relief features. However, a smooth featureless surface with no positive relief features is observed on the 725 °C melt surface. It is speculated that the presence of the positive relief features may be associated with the broad exothermic peak at 705 °C observed by DTA and thus are likely a result of surface crystallization.12The RMS roughness value of the surface melted at
675 °C is 1.21 ± 0.09 nm, while the 725 °C melt surface is considerably smoother, with an RMS roughness of 0.30 ± 0.01 nm. Polishing the surface of glasses such as ISG affects the near-surface composition. Figure9f plots the near-surface (~5–10 nm) composition of ISG after several different surface treatments, as measured by X-ray photoelectron spectroscopy (XPS). To quantify the composition, Gong et al.12derived relative sensitivity factors
(RSFs) from high-resolution XPS scans of fresh air-fractured pristine ISG glass surfaces, assuming that the ISG glass fracture surface was identical to the bulk ISG glass composition. Neither Hopf and Pierce31 nor this work determined independent RSFs, and thus
literature values were utilized. Owing to the variation in RSF values, the compositions in Fig. 9f cannot be compared quantitatively to those of Gong et al.12 or the bulk composition
of ISG. However, general trends can be identified. All surfaces preferentially lose Na and B, while the fractions of Al, Ca, and Zr remain nearly constant between the surface and bulk material. Polished surfaces lose Na and B due to preferential leaching by water during the polishing process. Measurement of the 0.25μm diamond paste-polished surface at glancing photoemission take-off angle, which is more surface sensitive (~ 5 nm probe depth), confirms that the loss of Na and B is highly localized at the top
surface of the glass. In contrast, melt surfaces lose Na and B via evaporation during heat treatment; from the XPS data in Fig.9f, this loss appears to be greater for B than for Na.
Dissolution behavior
Because different characteristics of glass alteration mechanisms are probed by different dissolution test methods, it is often difficult to relate glass composition to intrinsic properties of dissolution behavior. The dissolution rate in dilute conditions, often termed the initial or forward rate, is arguably the best experimental measure of intrinsic dissolution properties.43 The
initial dissolution rate of ISG has been reported by several groups.42,44,45Despite the intrinsic nature of the initial dissolution
rate, it becomes challenging to compare results from these reports because they were executed with different experimental protocols to achieve “dilute” dissolution conditions and at different temperature and solution pH; the initial dissolution rate is a strong function of temperature and pH.43 In addition, Fournier
et al.42discusses in detail how the presumed surface area of the
glass affects the calculation of the initial rate.
Differences in static dissolution test results are even more difficult than initial rate data to ascribe to intrinsic glass properties,
such as variations in glass composition. It can be difficult to compare static dissolution data from different research groups because each combination of solution conditions, temperature, and pH results in unique dissolution conditions. The test that is most amenable to these comparisons is the product consistency test (PCT) due to the well-prescribed standardization of the method. The PCT was developed to provide a standardized measure of whether the short-term static aqueous dissolution behavior is consistent among samples, batches, or production runs of the same glass (PCT-A) and as a framework to evaluate the chemical durability of waste glasses (PCT-B); it can be applied to both simulated and radioactive glass.46,47While PCT results may
not be intrinsic, they should be consistent among all of the ingots. The results of PCT tests from various laboratories are presented here so that future work can be compared for consistency. PCT results are also useful for estimates of residual rate, gel composition, ion exchange through difference in Na vs. B release, and other mass–balance calculations.
The PCT became an ASTM consensus standard in 1994 (ASTM Standard C1285).48 In brief, the PCT-A utilizes a powdered glass
sample sieved to−100/+200 mesh (0.074–0.149 mm) and washed
to removefines, placed in a stainless steel autoclave with ASTM Type I water (18 MΩ·cm) at a ratio of 10 mL water to 1 g glass
powder (for ISG with a nominal density of 2.51 g cm−3 and a
geometric surface area of 3.98 × 10⁻⁴cm2per particle assuming a
spherical particle of 0.1125 mm diameter, this results in a geometric surface area to volume ratio of 2100 m−1), and held
at 90 °C. The test parameter values can be varied in a PCT-B test. Two tests of ISG glass powder have been undertaken utilizing the PCT-B protocol. Savannah River National Laboratory49
performed the PCT in triplicate with 10 mL DI water to 1 g of
−100/+200 mesh glass powder. The test was run for 28 days in
stainless steel autoclaves. The pH of the leachate (measured at room temperature) remained lower for ISG (pH 9.47 after 7 days) than for the simulant glasses SON68 (pH 9.75) or Advanced Fuel Cycle Initiative (AFCI, pH 10.17), and the normalized release rates of B, Na, and Si for ISG were higher than those of the other glasses investigated over both the 0–7-day and 7–28-day intervals. The National Nuclear Laboratory also performed the PCT in triplicate, with 40 mL DI water to 4 g of−100/+200 mesh glass powder. The
[image:14.595.50.271.55.242.2]test was run for 182 days in stainless steel autoclaves; the pH of the leachate remained in the range of 9.45–9.55 (measured at room temperature) throughout the duration of the test. A detectable concentration of Zr was present in the leachate after 182 days. Figure10plots the average concentration of B, Na, and
Fig. 10 Normalized concentrations of B, Na, and Si in the leachate as a function of time for International Simple Glass altered with the PCT protocol. Error bars are ±1 standard deviation, evaluated from triplicate tests (for Si, error bars are smaller than the symbol size). Data are from the Savannah River National Laboratory49(SRNL,
filled symbols) and the National Nuclear Laboratory (NNL, open symbols)
Si for the triplicate tests from each laboratory, normalized to the respective mass fraction in ISG, as a function of time. The responses from each institution are nearly identical.
DISCUSSION
ISG, a six-component aluminoborosilicate glass designed as a simplified glass composition for glass corrosion studies, was generated in a single batch cast as 100 ingots by Mo-Sci Corporation. Ingots were then distributed to an international collaboration of glass scientists. A review of the physical and optical properties of ISG has been presented here. There is very good agreement on the values of the physical properties of ISG measured by different research groups using different methods. This reproducibility provides confidence that the glasses distrib-uted among different groups have consistent properties and, similarly, that direct comparisons of results from investigations of the corrosion behavior of ISG can be made. The physical and optical properties presented here can be used in future experimental analysis and modeling efforts.
METHODS
Synthesis of ISG ingots
A single lot of ISG was synthesized (Mo-Sci, Rolla, MO) for subsequent distribution to collaborators around the world. The glass was synthesized in three individual batches by blending powdered raw materials (zircon (SiZrO4), calcium carbonate (CaCO3), sodium carbonate (Na2CO3), alumi-num hydroxide (Al(OH)3), boric acid (H3BO3), and silica (SiO2)) in a V-blender, yielding approximately 25 kg of glass cullet per batch. Each batch was melted in high-purity fused silica crucibles in an electric furnace at 1300 °C and water quenched to produce glass frit. After drying in an electric oven, the three individual batches of frit were blended together in a V-blender to create a master lot. This frit was then re-melted in platinum–rhodium crucibles in an electric furnace at 1300 °C for approximately 4 h, stirred once with a quartz rod, and cast into a graphite mold to produce a total of 100 nominally 5 × 5 × 10 cm3, ~0.5 kg blocks. The blocks were annealed at 569 °C for 6 h in an electric oven, and cooled to room temperature at a rate of 50 °C h−1.
DATA AVAILABILITY
The datasets generated during and/or analyzed during the current study are available from the corresponding author on reasonable request.
ACKNOWLEDGEMENTS
T.C.K. and J.V.R. were jointly funded by the US Department of Energy (DOE) Office of Nuclear Energy (Materials Recovery and Waste Form Development) and the Office of Environmental Management (Tank Waste Management, EM-21). Pacific Northwest National Laboratory is a multi-program national laboratory operated for the U.S. Department of Energy by Battelle Memorial Institute under Contract DE-AC06-76RLO 1830. C.G.P., J.R., and C.T. were supported by the DOE Nuclear Energy University Program. N.C.H., C.L.C., C.M., R.J.H., and M.A.K. were supported by the UK Engineering and Physical Sciences Research Council under grants EP/N017617/1, EP/N017374/1, EP/N017870/1, EP/L015390/1, and EP/G037140/1 and the research utilized the MIDAS facility at The University of Sheffield established withfinancial support from the former Department of Energy & Climate Change. C.L.C and C.M.J. were supported by the DOE Office of Nuclear Energy (Material Recovery and Waste Form Development). J.D. and X.L. were supported by the National Science Foundation (NSF) Ceramic Program (project # 1508001) and DOE Offices of Nuclear Energy and Environmental Management through the Nuclear Energy University Program. M.T.H. was supported by the National Nuclear Laboratory’s Signature research program. C.C., M.R.L., and N.J. S. were supported by Corning, Incorporated.
AUTHOR CONTRIBUTIONS
T.C.K. and J.V.R. contributed TEM images of crushed ISG, thermal expansion, UV-visible SE, glass transition temperature, and XPS surface composition data. C.G.P., J.R., and C.T. contributed TEM images of ISGfiber. N.C.H., C.L.C., and C.M. contributed XRD and density data. R.J.H. and M.A.K. contributed nanoindentation data. C.L.C. and
C.M.J. contributed density and PCT data. J.D. and X.L. contributed glass transition temperature, density, and simulated XRD data. M.T.H. contributed PCT data. C.C. and M.R.L. contributed UV-visible SE data andfitting. N.J.S. contributed IR SE data. T.C.K. and J.V.R. wrote the manuscript.
ADDITIONAL INFORMATION
Competing interests:The authors declare no competing interests.
Publisher’s note:Springer Nature remains neutral with regard to jurisdictional claims in published maps and institutional affiliations.
REFERENCES
1. Environmental Protection Agency Rules. Hazardous waste: land disposal restric-tions- third third wastes, 8. Radioactive mixed waste.Fed. Regist.55, 22627 (1990). 2. Gin, S. et al. An international initiative on long-term behavior of high-level
nuclear waste glass.Mater. Today16, 243–248 (2013).
3. Vienna, J. D., Ryan, J. V., Gin, S. & Inagaki, Y. Current understanding and remaining challenges in modeling long-term degradation of borosilicate nuclear waste glasses.Int. J. Appl. Glass Sci.4, 283–294 (2013).
4. ASTM C1174-17, Standard Practice for Evaluation of the Long-Term Behavior of Materials Used in Engineered Barrier Systems (EBS) for Geological Disposal of High-Level Radioactive Waste. (2017).
5. Frugier, P. et al. SON68 nuclear glass dissolution kinetics: current state of knowledge and basis of the new GRAAL model.J. Nucl. Mater.380, 8–21 (2008). 6. Curti, E., Crovisier, J. L., Morvan, G. & Karpoff, A. M. Long-term corrosion of two nuclear waste reference glasses (MW and SON68): a kinetic and mineral alteration study.Appl. Geochem.21, 1152–1168 (2006).
7. Advocat, T., Jollivet, P., Crovisier, J. L. & del Nero, M. Long-term alteration mechanisms in water for SON68 radioactive borosilicate glass.J. Nucl. Mater.298, 55–62 (2001).
8. Chaou, A. A., Abdelouas, A., El Mendili, Y. & Martin, C. The role of pH in the vapor hydration at 175 degrees C of the French SON68 glass.Appl. Geochem.76, 22–35 (2017).
9. Neeway, J. J. et al. Ion-exchange interdiffusion model with potential application to long-term nuclear waste glass performance.J. Phys. Chem. C120, 9374–9384 (2016). 10. Gin, S., Beaudoux, X., Angeli, F., Jegou, C. & Godon, N. Effect of composition on the short-term and long-term dissolution rates of ten borosilicate glasses of increasing complexity from 3 to 30 oxides.J. Non-Cryst. Solids358, 2559–2570 (2012). 11. Marra, J. C., Crawford, C. L. & Peeler, D. K.Letter Report on Chemical and Physical
Property Measurements of“Common Simple”Glass. Report No. SRNL-L310002012-00092 and FCRD-SWF-2012-000162 (Savannah River National Laboratory, Aiken, CA, 2012).
12. Gong, Y. X., Wren, A. W. & Mellott, N. P. Quantitative morphological and com-positional evaluation of laboratory prepared aluminoborosilicate glass surfaces.
Appl. Surf. Sci.324, 594–604 (2015).
13. Jantzen, C. M. & Brown, K. G. inEnvironmental Issues and Waste Management Technologies in the Ceramic and Nuclear Industries, Vol. 107 Ceramic Transactions (ed. Chandler, G. T.) 289–300 (American Ceramic Society, Westerville, OH, 2000). 14. Taylor, P.A Review of Phase Separation in Borosilicate Glasses, with Reference to Nuclear Fuel Waste Immobilization(Whiteshell Nuclear Research Establishment, Atomic Energy of Canada, Pinawa, MB, 1990).
15. Alekseeva, Z. D., Mazurin, O. V., Aver’yanov, V. I. & Galakhov, F. Y. More accurate definition of liquation dome in Na2O-B2O3-SiO2 system.Fiz. Khim. Stekla 3,
114–122 (1977).
16. Peeler, D. K. & Hrma, P. R. inEmerging Technologies in Hazardous Waste Man-agement VI(eds Tedder, D. W. & Pohland, F. G.) 323–338 (American Academy of Environmental Engineers, Annapolis, MD, 1996).
17. Jantzen, C. M., Pickett, J. B., Brown, K. G., Edwards, T. B. & Beam, D. C.Process/ Product Models for the Defense Waste Processing Facility (DWPF): Part I. Predicting Glass Durability from Composition Using a Thermodynamic Hydration Energy
Reaction MOdel (THERMO). Report No. US DOE Report WSRC-TR-93-0672
(Wes-tinghouse Savannah River Company, Aiken, SC 1995).
18. Collin, M. et al. Structure of International Simple Glass and properties of passi-vating layer formed in circumneutral pH conditions.Mater. Degrad.2, 4 (2018). 19. Guerette, M. & Huang, L. P. In-situ Raman and Brillouin light scattering study of
the international simple glass in response to temperature and pressure.J. Non-Cryst. Solids411, 101–105 (2015).
20. Mansas, C. et al. Drivers of water transport in glass: chemical or topological effect of the glass network?J. Phys. Chem. C121, 16201–16215 (2017).
21. Ren, M. G., Deng, L. & Du, J. C. Bulk, surface structures and properties of sodium borosilicate and boroaluminosilicate nuclear waste glasses from molecular dynamics simulations.J. Non-Cryst. Solids476, 87–94 (2017).
22. Charpentier, T. et al. Self-healing capacity of nuclear glass observed by NMR spectroscopy.Sci. Rep.6, 25499 (2016).
23. Greaves, G. N., Fontaine, A., Lagarde, P., Raoux, D. & Gurman, S. J. Local-structure of silicate-glasses.Nature293, 611–616 (1981).
24. McKeown, D. A., Waychunas, G. A. & Brown, G. E. EXAFS study of the coordination environment of aluminum in a series of silica-rich glasses and selected minerals within the Na2O-Al2O3-SiO2system.J. Non-Cryst. Solids74, 349–371 (1985).
25. McKeown, D. A., Waychunas, G. A. & Brown, G. E. EXAFS and XANES study of the local coordination environment of sodium in a series of silica-rich glasses and selected minerals within the Na2O-Al2O3-SiO2system.J. Non-Cryst. Solids74,
325–348 (1985).
26. Bouty, O., Cammelli, S. & Solari, P. L. Structural insights for the International Simple Glass by combining X-ray absorption spectroscopic analysis and atomistic modelling.J. Non-Cryst. Solids499, 434–440 (2018).
27. Bouty, O., Delaye, J. M., Beuneu, B. & Charpentier, T. Modelling borosilicate glasses of nuclear interest with the help of RMC, WAXS, neutron diffraction and B-11 NMR.J. Non-Cryst. Solids401, 27–31 (2014).
28. Bouty, O., Ramond, L., Solari, P. L. & Cammelli, S. XANES analysis of a Cm-doped borosilicate glass under alpha-self-irradiation effects.J. Mater. Sci.51, 7918–7928 (2016).
29. Crawford, C. L. & Jantzen, C. M.Summary of DOE-EM Funded SRNL FY14 Activities Supporting the Joint EM-NE-SC International Study of Glass Behavior Over Geologic
Time Scales. Report No. SRNL-L3100-2014-00226 (Savannah River National
Laboratory, Aiken, SC, 2014).
30. Schumacher, R. F., Workman, R. J. & Edwards, T. B.Calibration and Measurement of
the Viscosity of DWPF Start-Up Glass. Report No. ORNL-TM-4333 (Westinghouse
Savannah River Company, Aiken, SC, 2000).
31. Hopf, J. & Pierce, E. M. Topography and mechanical property mapping of Inter-national Simple Glass surfaces with atomic force microscopy.Proc. Mat. Sci.7, 216–222 (2014).
32. Ngo, D. et al. Spectroscopic ellipsometry study of thickness and porosity of the alteration layer formed on international simple glass surface in aqueous corrosion conditions.npj Mater. Degrad.2, 20 (2018).
33. Kaspar, T. C., Reiser, J. T., Ryan, J. V. & Wall, N. A. Non-destructive characterization of corroded glass surfaces by spectroscopic ellipsometry.J. Non-Cryst. Solids481, 260–266 (2018).
34. Lu, X., Schreiber, D. K., Neeway, J. J., Ryan, J. V. & Du, J. Effects of optical dopants and laser wavelength on atom probe tomography analyses of borosilicate glas-ses.J. Am. Ceram. Soc.https://doi.org/10.1111/jace.14987(2017).
35. Abdelouas, A. et al. A preliminary investigation of the ISG glass vapor hydration.
Int. J. Appl. Glass Sci.4, 307–316 (2013).
36. McMillan, P. Structural studies of silicate-glasses and melts - applications and limitations of Raman-spectroscopy.Am. Miner.69, 622–644 (1984).
37. Luo, J. W., Smith, N. J., Pantano, C. G. & Kim, S. H. Complex refractive index of silica, silicate, borosilicate, and boroaluminosilicate glasses - Analysis of glass network vibration modes with specular-reflection IR spectroscopy.J. Non-Cryst. Solids494, 94–103 (2018).
38. Mysen, B. O., Virgo, D. & Scarfe, C. M. Relations between the anionic structure and viscosity of silicate melts - a Raman-spectroscopic study.Am. Miner.65, 690–710 (1980).
39. Deng, C. S. et al. Ageing of oilfield cement at high humidity: a combined FEG-ESEM and Raman microscopic investigation. J. Mater. Chem. 12, 3105–3112 (2002).
40. Osipov, A. A., Osipova, L. M. & Eremyashev, V. E. Structure of alkali borosilicate glasses and melts according to Raman spectroscopy data.Glass Phys. Chem.39, 105–112 (2013).
41. Gin, S. et al. The fate of silicon during glass corrosion under alkaline conditions: a mechanistic and kinetic study with the International Simple Glass. Geochim. Cosmochim. Acta151, 68–85 (2015).
42. Fournier, M. et al. Glass dissolution rate measurement and calculation revisited.J. Nucl. Mater.476, 140–154 (2016).
43. Vienna, J. D., Neeway, J., Ryan, J. V. & Kerisit, S. Impacts of glass composition, pH, and temperature on glass forward dissolution rate.npj Mater. Degrad.2, 22 (2018).
44. Inagaki, Y., Kikunaga, T., Idemitsu, K. & Arima, T. Initial dissolution rate of the International Simple Glass as a function of ph and temperature measured using microchannelflow-through test method.Int. J. Appl. Glass Sci.4, 317–327 (2013). 45. Neeway, J. J., Rieke, P. C., Parruzot, B. P., Ryan, J. V. & Asmussen, R. M. The dissolution behavior of borosilicate glasses in far-from equilibrium conditions.
Geochim. Cosmochim. Acta226, 132–148 (2018).
46. Jantzen, C. M. & Bibler, N. E. inEnvironmental Issues and Waste Management Technologies in the Materials and Nuclear Industries Xii, Vol. 207 Ceramic Trans-actions (eds Cozzi, A. & Ohji, T.) 155–167 (American Ceramic Society, Westerville, OH, 2009).
47. Jantzen, C. M. & Bibler, N. E.Product Consistency Test (PCT) for DWPF Glass: Part I.
Test Development and Protocol. Report No. DPST-87-575 (Savannah River
Laboratory, E. I du Pont de Nemours & Co., Aiken, CA, 1987).
48. ASTM C1285-14, Standard Test Methods for Determining Chemical Durability of Nuclear, Hazardous, and Mixed Waste Glasses and Multiphase Glass Ceramics: The Product Consistency Test (PCT) (2014).
49. Crawford, C. L.Letter Report on Completion of Single Pass Flow Through Tests. Report No. SRNL-L3100-2013_00176 (Savannah River National Laboratory, Aiken, CA, 2013).
Open AccessThis article is licensed under a Creative Commons Attribution 4.0 International License, which permits use, sharing, adaptation, distribution and reproduction in any medium or format, as long as you give appropriate credit to the original author(s) and the source, provide a link to the Creative Commons license, and indicate if changes were made. The images or other third party material in this article are included in the article’s Creative Commons license, unless indicated otherwise in a credit line to the material. If material is not included in the article’s Creative Commons license and your intended use is not permitted by statutory regulation or exceeds the permitted use, you will need to obtain permission directly from the copyright holder. To view a copy of this license, visithttp://creativecommons. org/licenses/by/4.0/.
This is a U.S. government work and not under copyright protection in the U.S.; foreign copyright protection may apply 2019