This is a repository copy of
Mammographic breast density classification using a deep
neural network: assessment based on inter-observer variability
.
White Rose Research Online URL for this paper:
http://eprints.whiterose.ac.uk/149273/
Version: Accepted Version
Proceedings Paper:
Kaiser, N, Fieselmann, A, Vesal, S et al. (4 more authors) (2019) Mammographic breast
density classification using a deep neural network: assessment based on inter-observer
variability. In: Nishikawa, RM and Samuelson, FW, (eds.) Proceedings of SPIE: Progress
in Biomedical Optics and Imaging. SPIE Medical Imaging 2019, 16-21 Feb 2019, San
Diego, CA, United States. SPIE . ISBN 9781510625518
https://doi.org/10.1117/12.2513420
© 2019, Society of Photo-Optical Instrumentation Engineers (SPIE). This is an author
produced version of a paper published in Proceedings of SPIE: Progress in Biomedical
Optics and Imaging. Uploaded in accordance with the publisher's self-archiving policy.
eprints@whiterose.ac.uk https://eprints.whiterose.ac.uk/ Reuse
Items deposited in White Rose Research Online are protected by copyright, with all rights reserved unless indicated otherwise. They may be downloaded and/or printed for private study, or other acts as permitted by national copyright laws. The publisher or other rights holders may allow further reproduction and re-use of the full text version. This is indicated by the licence information on the White Rose Research Online record for the item.
Takedown
If you consider content in White Rose Research Online to be in breach of UK law, please notify us by
Mammographic breast density classification using a deep
neural network: Assessment based on inter-observer
variability
N. Kaiser
1,2, A. Fieselmann
1, S. Vesal
2, N. Ravikumar
2, L. Ritschl
1, S. Kappler
1, A. Maier
2 1Siemens Healthcare GmbH, Forchheim, Germany
2
Pattern Recognition Lab, Friedrich-Alexander University Erlangen-N¨
urnberg (FAU)
ABSTRACT
Mammographic breast density is an important risk marker in breast cancer screening. The ACR BI-RADS guidelines (5th ed.) define four breast density categories that can be dichotomized by the two super-classes “dense” and “not dense”. Due to the qualitative description of the categories, density assessment by radiologists is characterized by a high inter-observer variability.
To quantify this variability, we compute the overall percentage agreement (OPA) and Cohen’s kappa of 32 radiologists to the panel majority vote based on the two super-classes. Further, we analyze the OPA between individual radiologists and compare the performances to an automated assessment via a convolutional neural network (CNN). The data used for evaluation contains 600 breast cancer screening examinations with four views each. The CNN was designed to take all views of an examination as input and trained on a dataset with 7186 cases to output one of the two super-classes.
The highest agreement to the panel majority vote (PMV) achieved by a single radiologist is 99%, the lowest score is 71% with a mean of 89%. The OPA of two individual radiologists ranges from a maximum of 97.5% to a minimum of 50.5% with a mean of 83%. Cohen’s kappa values of radiologists to the PMV range from 0.97 to 0.47 with a mean of 0.77. The presented algorithm reaches an OPA to all 32 radiologists of 88% and a kappa of 0.75.
Our results show that inter-observer variability for breast density assessment is high even if the problem is reduced to two categories and that our convolutional neural network can provide labeling comparable to an average radiologist. We also discuss how to deal with automated classification methods for subjective tasks.
Keywords: Mammography, breast density, deep learning, inter-observer variability
1. INTRODUCTION
Current clinical protocol for breast cancer screening and assessing patient risk, is based on evaluating breast density in mammograms.1
Breast density is most commonly assessed via the ACR BI-RADS guidelines (5th. ed.),2
which define four density categories from “a” to “d” via qualitative description on a scale from “almost entirely fatty” to “extremely dense”. In the USA, many states already require woman to be informed in case they have dense breasts (category “c” or “d”) to schedule supplemental imaging (e.g. breast ultrasound) if needed.3
However, the qualitative descriptions allow for subjective interpretations and therefore result in strong inter-observer variability among radiologists4
.5
Many automated methods for breast density assessment compute a quantitative measure like area-based or volumetric percentage density. Area-based methods provide a two-dimensional percentage density value that is computed solely on the mammographic image impression. The required segmentation of dense tissue can be obtained semi-automatically via the popular Cumulus software or with any kind of segmentation algorithm such as global or dynamic thresholding, clustering algorithms like K-means or Fuzzy C-means, statistical models, texture descriptors (overview in6
) and also deep learning segmentation techniques.7
VGG16
Concatenated Feature Vector
VGG16
VGG16
VGG16
1024
L-CC
L-MLO
R-CC
R-MLO
2048
feature vector 1
feature vector 2
feature vector 3
feature vector 4
0
[image:3.612.159.451.77.231.2]1 Dense Layers
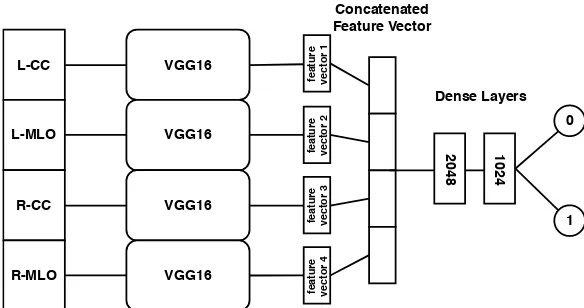
Figure 1. CNN Model that combines the separately extracted image features of all mammographic views and is trained on the binary classification task “dense” or “not dense”.
Volumetric breast density analysis methods measure the proportion of dense tissue in the total breast vol-ume. Approaches can be divided into “self-calibration”8
(also called “image-based calibration”) and “system calibration”.9
Both compute an exact fraction of dense tissue by taking empirical values and the x-ray imaging physics into account. An advantage of the volumetric percentage density is that it can predict the risk for cancer development because it represents the amount of fibroglandular tissue, which is more susceptible to cancer.
Despite the number and variety of quantitative methods, the qualitative BI-RADS measure is accepted for clinical practice. Since fixed percentage density values as criteria have been removed from the guidelines in the 5th edition, it has become harder to convert quantitative measurements to BI-RADS categories. Therefore we do a direct qualitative classification via deep neural networks to model the radiologists decision patterns.
Convolutional neural networks (CNNs) have already shown to be suitable for a classification of BI-RADS categories10 11
.12
We adopt Wu et al.’s method11
with modifications and want to provide a meaningful evaluation of the performance. When new computer aided diagnosis (CAD) tools are presented they are often compared to one or two radiologists. However, when dealing with highly inconsistent opinions among radiologists with no objective ground truth measure, as in the case of breast density, this evaluation is less meaningful. In this study, we provide a detailed comparison of the presented deep learning algorithm to a large group of radiologists.
2. MATERIAL AND METHODS
2.1 Data
All mammographic images used in this work were acquired for a clinical trial by the “Malm¨o Breast Screening Unit” from the Sk˚ane University Hospital in Sweden.13
The available dataset initially contained 8150 breast cancer screening examinations including left and right craniocaudal views (L-CC, R-CC) as well as left and right mediolateral oblique views (L-MLO, R-MLO) for each case. 600 of these examinations were selected for the multi-reader study with 32 US radiologists. The radiologists were divided into three groups, such that 9 radiologists saw the first 200 examinations, 10 radiologists saw the second 200 and 13 radiologists saw the last 200 cases. The results were used for the analysis of inter-observer variability and for the final validation of our deep learning algorithm. Note that the respective panel majority vote was taken as ground-truth for the evaluation, since the “real” truth cannot be known for breast density assessment.
1 2 3 0.6
0.8
1
reader group
O
P
A
algorithm
(a) Comparing radiologists to panel majority vote
1 2 3
0.6
0.8
1
reader group
O
P
A
[image:4.612.84.543.82.237.2](b) Comparing individual radiologists in a group Figure 2. Boxplots for OPA to panel majority vote and OPA of individual radiologists by group.
2.2 Mammographic breast density classification using a convolutional neural network
Motivated by prior work from Mohamed et al.12
and especially Wu et al.11
we designed a network that can take all four mammographic views (L-CC, L-MLO, R-CC, R-MLO) and output one of the two labels “dense” or “not dense” (see Figure 1). In contrast to Wu et al.11
we do not use a network architecture that is adapted to the high resolution of mammographic images. We argue that the features needed to assess breast density are rather simple and we can make use of existing models that are trained on the ImageNet database. To benefit from the information of all four views, we stack four pre-trained VGG16 networks in parallel. Feature vectors are extracted via global average pooling of the last layer in every stream and then concatenated. Finally, two dense layers are added to combine the features of every view before the output is computed in the classification layer. The input images where post-processed to “For Presentation” mode, resized to 224x224 pixels and copied to 3 channels to match the requirements of the VGG16 network. Training was done end-to-end via 5-fold cross validation and the best model according to test accuracy was saved to do the final evaluation.
2.3 Evaluation of inter-observer variability
We define the OPA to be the percentage of cases for which one reader assigns the same class as the panel majority or another reader.
OPA = #agreeing cases
#cases (1)
We also use the unweighted version of Cohen’s kappa κ, which is commonly used for evaluating inter-rater
agreement. It combines the overall agreement of two readerspowith the possibility of agreeing by chancepc.
κ=p
o−pc 1−pc
(2)
In a first approach we compare the OPA of every radiologist to the respective panel majority, based on two classes. Additionally, we analyze the agreement of individual radiologists to every other radiologist in the group and to the algorithm.
We also rank the radiologists based on the OPA and kappa and include our algorithm as an individual reader into the comparison. Both scores of the algorithm are computed based on the majority votes for all 600 examinations.
3. RESULTS
0 0.2 0.4 0.6 0.8 1 0 5 10 15 20 25 30 0.71 0.78 0.78 0.80 0.81 0.81 0.82 0.83 0.83 0.87 0.88 0.88 0.89 0.90 0.91 0.91 0.92 0.92 0.92 0.93 0.93 0.93 0.94 0.94 0.94 0.95 0.95 0.95 0.95 0.96 0.97 0.98 0.99 OPA re a d er
(a) Overall percentage agreement.
0 0.2 0.4 0.6 0.8 1
0 5 10 15 20 25 30 0.47 0.53 0.57 0.58 0.61 0.62 0.62 0.63 0.63 0.67 0.75 0.78 0.78 0.80 0.80 0.81 0.81 0.81 0.84 0.84 0.84 0.85 0.86 0.86 0.86 0.87 0.88 0.89 0.90 0.93 0.93 0.94 0.97 kappa re ad er
[image:5.612.127.487.81.437.2](b) Cohen’s kappa.
Figure 3. Ranking of all observers (including algorithm in red) by their achieved OPA and Cohen’s kappa to the panel majority.
high compared to the other two groups with 87% and 88% respectively. The variance increases for group two and three as a logical consequence of the increasing group size. The third group produces the highest and lowest score of all three groups with an OPA of 99% and 71%. The algorithm’s agreement to all 32 radiologists is 88% and cannot compete with group one except for one outlier radiologist. The algorithm achieves a performance on level with the mean OPAs of group two and three and slightly below the corresponding medians.
In Figure 2b we see that the degree to which individual radiologists agree with each other varies a lot more than the agreement to the majority vote. This plot shows that the results in Figure 2a do not only depend on the group size, but that group two and three are less homogenous than group one. The maximum agreement of two individual readers is 97.5%, the minimum is 50.5% with a total mean of 83%.
4. DISCUSSION
The performance of our algorithm is comparable to other proposed techniques. The OPA of 0.881 lies slightly below that of the Siemens Insight BD software with 0.885,14
which uses volumetric density assessment with a threshold for BI-RADS categories. Compared to Wu et al.,11
our algorithm yields a slightly higher OPA than their reported 0.865 for the two-class problem.
An interesting effect that has been observed in our experiments is that the classification accuracy on a test set which is monitored during training with the 7186 examinations is always approximately 0.02 below the score on the validation set with 600 examinations. The ground truth in Wu et al.’s paper, as well as that for our training data, was provided by multiple radiologists with one or two readers per case and our test set performance is very similar despite of different architectures. Combining this with our observation that many very different architectures we tried yielded similar results raises the suspicion that the subjectivity of the task imposes such high label inconsistencies that a test set performance above a certain threshold cannot be achieved. The labelling scheme of our validation data diminishes this inconsistencies which results in an improved OPA of our algorithm. This also means that a deep learning algorithm is able to learn correct decision patterns from noisy data but that it can only show its potential when it is compared in a fair way like we attempted.
Steidl et al.15
observed a similar issue for the classification of emotions via speech which is also a highly subjective task. The authors state that for a true perceptual task, an automatic system can only be as good as the average labels. We therefore hypothesize that the extraction of features for breast density assessment is rather simple and can be achieved by many different CNN architectures and that the major task is to properly account for the inconsistencies caused by the subjective interpretation of individual radiologists. The results of Mohamed et al.12
also support this hypothesis. They used AlexNet to perform an image-wise (not exam-wise) classification and initially achieved an area under the ROC curve (AUC) of 0.9256 which is below the AUC of 0.954 we achieve on the validation set. By defining a criteria to remove inconsistent labels in the training data, their AUC improved drastically to 0.9857.
From all aforementioned findings we conclude that it is highly desirable for breast density assessment and subjective classification tasks in general, to acquire a large data set for training where individual cases have been labelled by many different readers. This is probably the best way to boost the performance of a deep learning algorithm past that of the average reader.
5. CONCLUSION
Our results show that inter-observer variability for breast density assessment is high even if the problem is reduced to two categories and that our convolutional neural network can provide labeling comparable to an average radiologist. We therefore suggest that automated approaches for breast density assessment are essential for decision support and to reduce inconsistencies among radiologists. We show that it is important to compare a deep learning algorithm for a subjective classification task with caution and hypothesize that the best way to surpass the average reader’s performance is to have multiple readers label the same cases in the training data.
REFERENCES
[1] Boyd, N. F., Rommens, J. M., Vogt, K. N., Lee, V., Hopper, J. L., Yaffe, M. J., and Paterson, A. D., “Mammographic breast density as an intermediate phenotype for breast cancer.,” The Lancet. Oncology6 10, 798–808 (2005).
[2] Sickles, E. A., D’Orsi, C. J., and Bassett, L. W.,ACR BI-RADS Mammography. In: ACR BI-RADS Atlas, Breast Imaging Reporting and Data System. American College of Radiology, 5-th ed. (2013).
[3] www.areyoudenseadvocacy.org, “State density reporting efforts,” (2018). accessed 8th August 2018. [4] Redondo, A. C., Comas, M., Maci`a, F., Ferrer, F., Murta-Nascimento, C., Maristany, M. T., Molins, E.,
[6] He, W., Juette, A., Denton, E. R. E., Oliver, A., Marti, R. M., and Zwiggelaar, R., “A review on automatic mammographic density and parenchymal segmentation,” in [International journal of breast cancer], (2015). [7] Lee, J. and Nishikawa, R. M., “Automated mammographic breast density estimation using a fully
convolu-tional network.,”Medical physics45 3, 1178–1190 (2018).
[8] van Engeland, S., Snoeren, P. R., Huisman, H., Boetes, C., and Karssemeijer, N., “Volumetric breast density estimation from full-field digital mammograms,”IEEE transactions on medical imaging25(3), 273– 282 (2006).
[9] Heine, J. J. and Thomas, J. A., “Effective x-ray attenuation coefficient measurements from two full field digital mammography systems for data calibration applications,”Biomedical engineering online7, 13 (2008). [10] Fonseca, P., Mendoza, J., Wainer, J., Ferrer, J., Pinto, J., Guerrero, J., and Casta˜neda, B., “Automatic breast density classification using a convolutional neural network architecture search procedure,” in [Medical Imaging: Computer-Aided Diagnosis], 9414(2015).
[11] Wu, N., Geras, K., Shen, Y., Su, J., Kim, S. G., Kim, E. H., Wolfson, S., Moy, L., and Cho, K., “Breast density classification with deep convolutional neural networks,”CoRRabs/1711.03674(2017).
[12] Mohamed, A. A., Berg, W. A., Peng, H., Luo, Y., Jankowitz, R. C., and Wu, S., “A deep learning method for classifying mammographic breast density categories.,”Medical Physics 45(1), 314–321 (2018).
[13] Zackrisson, S., L˚ang, K., Rosso, A., Johnson, K., Dustler, M., F¨ornvik, D., F¨ornvik, H., Sartor, H., Timberg, P., Tingberg, A., and Andersson, I., “One-view breast tomosynthesis versus two-view mammography in the Malm¨o Breast Tomosynthesis Screening Trial (MBTST): a prospective, population-based, diagnostic accuracy study.,”The Lancet Oncology(2018).
[14] Fieselmann, A., Jerebko, A. K., and Mertelmeier, T., “Volumetric breast density combined with masking risk: Enhanced characterization of breast density from mammography images,” in [Breast Imaging IWDM], Tingberg, A., L˚ang, K., and Timberg, P., eds.,9699, Springer (2016).
[15] Steidl, S., Levit, M., Batliner, A., Noeth, E., and Niemann, H., “Of all things the measure is man: au-tomatic classification of emotions and inter-labeler consistency [speech-based emotion recognition],” IEEE International Conference on Acoustics, Speech, and Signal Processing1, 317–320 (2005).