rover traversability hazards. Planetary and Space Science, 153. pp. 39-53. ISSN
0032-0633
https://doi.org/10.1016/j.pss.2017.12.008
[email protected]
https://eprints.whiterose.ac.uk/
Reuse
This article is distributed under the terms of the Creative Commons Attribution (CC BY) licence. This licence
allows you to distribute, remix, tweak, and build upon the work, even commercially, as long as you credit the
authors for the original work. More information and the full terms of the licence here:
https://creativecommons.org/licenses/
Takedown
If you consider content in White Rose Research Online to be in breach of UK law, please notify us by
Surface-based 3D measurements of small aeolian bedforms on Mars and
implications for estimating ExoMars rover traversability hazards
Matt Balme
a,*, Ellen Robson
b, Rob Barnes
c, Frances Butcher
a, Peter Fawdon
a, Ben Huber
d,
Thomas Ortner
e, Gerhard Paar
d, Christoph Traxler
e, John Bridges
f, Sanjeev Gupta
c,
Jorge L. Vago
gaSchool of Physical Sciences, Open University, Walton Hall, Milton Keynes MK7 6AA, UK
bSchool of Geography, Earth and Environmental Sciences, University of Birmingham, Edgbaston, Birmingham B15 2TT, UK c
Department of Earth Sciences and Engineering, Imperial College London, London SW7 2AZ, UK
dJoanneum Research, Institute for Information and Communication Technologies, Steyrergasse 17, 8010 Graz, Austria evrVis Forschungs GmbH., Donau-City-Strasse 11, 1220 Vienna, Austria
fSpace Research Centre, University of Leicester, Leicester LE1 7RH, UK gEuropean Space Agency, Keplerlaan 1, 2200 AG Noordwijk, The Netherlands
A R T I C L E I N F O
Keywords:
Mars Aeolian Mars rover Megaripples Ripples
A B S T R A C T
Recent aeolian bedforms comprising loose sand are common on the martian surface and provide a mobility hazard to Mars rovers. The ExoMars rover will launch in 2020 to one of two candidate sites: Mawrth Vallis or Oxia Planum. Both sites contain numerous aeolian bedforms with simple ripple-like morphologies. The larger examples are‘Transverse Aeolian Ridges’(TARs), which stereo imaging analyses have shown to be a few metres high and up to a few tens of metres across. Where they occur, TARs therefore present a serious, but recognized and avoidable, rover mobility hazard. There also exists a population of smaller bedforms of similar morphology, but it is unknown whether these bedforms will be traversable by the ExoMars rover. We informally refer to these bedforms as“mini-TARs”, as they are about an order of magnitude smaller than most TARs observed to date. They are more abundant than TARs in the Oxia Planum site, and can be pervasive in areas. The aim of this paper is to estimate the heights of these features, which are too small to measured using High Resolution Imaging Science Experiment (HiRISE) Digital Elevation Models (DEMs), from orbital data alone. Thereby, we aim to increase our knowledge of the hazards in the proposed ExoMars landing sites. We propose a methodology to infer the height of these mini-TARs based on comparisons with similar features observed by previous Mars rovers. We use rover-based stereo imaging from the NASA Mars Exploration Rover (MER) Opportunity and PRo3D software, a 3D visualisation and analysis tool, to measure the size and height of mini-TARs in the Meridiani Planum region of Mars. These are good analogues for the smaller bedforms at the ExoMars rover candidate landing sites. We show that bedform height scales linearly with length (as measured across the bedform, perpendicular to the crest ridge) with a ratio of about 1:15. We also measured the lengths of many of the smaller aeolian bedforms in the ExoMars rover Oxia Planum candidate landing site, andfind that they are similar to those of the Meridiani Planum TARs. Assuming that the Oxia Planum bedforms have the same length/height ratio as the MER Opportunity mini-TARs, we combine these data to provide a probabilistic method of inferring the heights of bedforms at the Oxia Planum site. These data can then be used to explore the likely traversability of this site. For example, our method suggests that most of the bedforms studied in Oxia Planum have ridge crests higher than 15 cm, but lower than 25 cm. Hence, if the tallest bedforms the ExoMars rover will be able to safely cross are only 15 cm high, then the Oxia Planum sites studied here contain mostly impassable bedforms. However, if the rover can safely traverse 25 cm high bedforms, then most bedforms here will be smaller than this threshold. As an additional outcome, our results show that the mini-TARs have length/height ratios similar to TARs in general. Hence, these bedforms could probably be classified simply as“small TARs”, rather than forming a discrete population or sub-type of aeolian bedforms.
* Corresponding author.
E-mail address:[email protected](M. Balme).
Contents lists available atScienceDirect
Planetary and Space Science
journal homepage:www.elsevier.com/locate/pss
https://doi.org/10.1016/j.pss.2017.12.008
Received 10 July 2017; Received in revised form 27 October 2017; Accepted 13 December 2017 Available online 15 December 2017
Crater and the sedimentary Meridiani plains respectively, and the Mars Science Laboratory (MSL)“Curiosity”rover (Grotzinger et al., 2012) is studyingfluviolacustrine and other sediments within Gale Crater. Here-after, when we refer to aeolian bedforms and deposits, we refer to recent bedforms consisting of loose sediments (although we do not specify if they are currently active or not), rather than lithified or indurated bed-forms, or bedforms preserved in outcrop.
Aeolian deposits consisting of loose unconsolidated material can constitute hazards to surface mobility of rovers: sinkage into the aeolian material and enhanced slippage can hamper traction and hence prevent forward progress, forcing the rover to backtrack (e.g., MER Opportunity,
Arvidson et al., 2011) or, in the worst case, leading to permanent entrapment and end of mission (e.g., MER Spirit,Arvidson et al., 2010). Being able to estimate the depth of loose aeolian material (or the height of aeolian bedforms) before a rover drives over them is therefore clearly of great advantage. Although measurement of bedform heights can be performedin situ, this provides no scope for forward planning, nor for assessing the traversability of a candidate landing location prior tofinal site selection. What is needed is a way to estimate aeolian hazard severity
without risk. Hence, selecting scientifically interesting drilling sites, and being able to reach them, is vital for the mission; the ExoMars mission was conceived as a mobile platform to ensure that the drill can be deployed at the best possible locations.
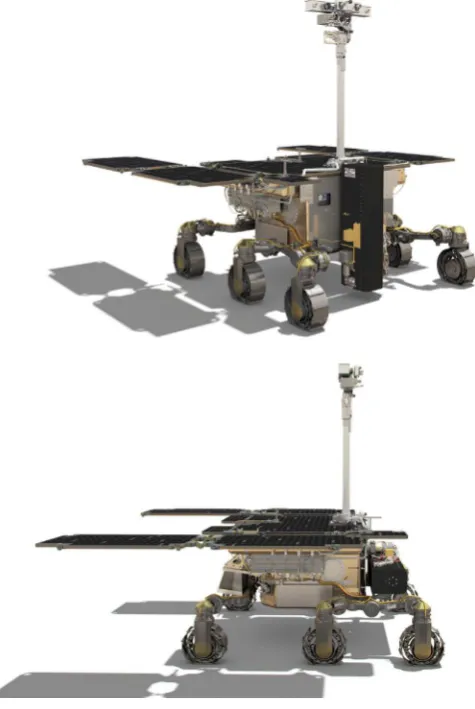
[image:3.595.40.554.403.658.2]The rover (Fig. 2) has a mass of 310 kg and is expected to travel a few km during its seven-month primary mission. The rover's locomotion system is based on a passive 3-bogie system with deformable wheels (Patel et al., 2010). Lander accommodation constraints have imposed the use of relatively small wheels (28.5 cm diameter without grousers, 12.0-cm width). In order to reduce the traction performance disadvan-tages of small wheels,flexible wheels have been adopted. However, the average wheel ground pressure is still ~10 kPa (higher than that of the NASA MER rovers, which is ~5.7 kPa;Heverly et al., 2013). This is a concern for traversing unconsolidated terrains. To mitigate this risk the ExoMars team is considering the use of‘wheel walking’, a coordinated roto-translational wheel gait in which the wheels are raised and lowered in sequence, that can improve dynamic stability and provide better traction for negotiating loose soils. The plan would be to engage wheel walking in case a certain predetermined wheel slip ratio limit is
exceeded. In other words, wheel walking would be considered an “emergency”means to negotiate a challenging situation, after which the rover would revert to“normal”rotational driving motion.
A key requirement of the locomotion system is the ability to traverse aeolian bedforms without becoming stuck, or, if bedforms are too large, steep, or high to traverse, to have theflexibility to plan a route around them. While larger bedforms such as TARs and dunes will simply be avoided as far as possible, smaller aeolian features such as meter-scale ripple-like bedforms identified in the MER Opportunity site in Mer-idiani Terra (and similar to the smaller bedforms called“plains ripples” bySullivan et al., 2005), provide a traversability hazard that is likely to be encountered, but the degree of severity of which is hard to assess from orbit.
These sub TAR-scale bedforms (TARs generally being defined as decametre-scale; e.g.,Balme et al., 2008) are similar in many ways to terrestrial“megaripples”(Bagnold, 1941): they are linear sandy deposits that are tens of cm to several metres across (Arvidson et al., 2011) and are often armoured with coarser granules or coarse sand-grade material in a monolayer on top of the sandy material that composes the greater volume of the bedform (Sullivan et al., 2005). While smaller examples were safely crossed by MER Opportunity, larger examples resulted in excessive wheel slippage, and could have led to a mission-ending situation (Arvidson et al., 2011). Even MSL, the most capable Mars rover currently operating, has found it hard to traverse aeolian features that appeared to be megaripples, sinking into one example at‘Moosilauke Valley’by about 30% of its 50 cm wheel diameter, and with slippage reaching ~77% (Arvidson et al., 2017). Hence, understanding whether the majority of
the aeolian bedforms are, or are not, traversable at a given landing site is essential, both in thefirst instance for landing site selection, and ulti-mately for efficient rover surface operations. Although a variety of ma-terial properties–including notably grain size and degree of armouring by coarse grains–alter the traversability characteristics of bedforms (Arvidson et al., 2017), a knowledge of the size and shape of aeolian bedforms is a primary question for any given rover site.
Considerable effort has been made in modelling the ability of rovers to traverse loose sand and aeolian bedforms (e.g.,Zhou et al., 2014), but it is difficult to assess what scale of bedforms will be a hazard without understanding the shape (i.e. how high they are and what are the slopes on theirflanks) of bedforms, which is hard to measure until the rover isin situ. Although remote sensing studies of Mars are able to detect and measure metre-scale landforms on the basis of 25 cm/pixel HiRISE data and, using stereo imaging-derived elevation models, to determine their heights to a precision of about 30 cm (Kirk et al., 2008), this is still not precise enough to understand the detailed shape of bedforms that, while small, might still form hazards to rovers. In addition, local areas as textureless as dunes or sand sheets, or which contain repeated, similar morphologies such as TARs, are challenging for the stereo matching process, so the quality of DEMs can be poor for such terrains. Any knowledge of the scale of features that are traversable is particularly important when attempting to cross bedforms that are longer (i.e., in the direction perpendicular to the ridge crest) than the rover wheel-base; that is, when all six of the rover wheels are on the bedform (Arvidson et al., 2011). If the bedforms are set on top of bedrock (as in the case for the MER Opportunity site in Meridiani;Sullivan et al., 2005), the height of the ridge crest provides a maximum depth to which the rover wheels can sink. In general, therefore, taller bedforms are a more serious concern.
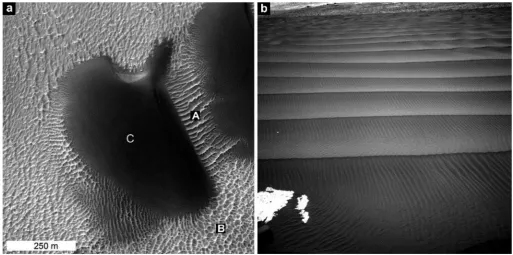
At time of writing, the landing site for ExoMars rover has yet to be determined. The mission's landing location will be chosen from twofinal candidates: Mawrth Vallis and Oxia Planum. Both sites contain aeolian bedforms such as TARs (Fig. 3), but preliminary studies by our team have found little evidence for discrete, large dunes, although some dark sand-sheets are present. What is clear, however, is that the Oxia Planum site in particular contains zones with a very high density of very small, aeolian bedforms, smaller than the size range generally defined for TARs, and morphologically similar to the plains ripples or smaller TARs seen in the MER Opportunity site (Fig. 4). These small features can only be seen in HiRISE images viewed at full resolution. We have not thoroughly searched for these meter-scale, TAR-like bedforms at the Mawrth Vallis site, but preliminary observations show that they are present here too.
Although the plan-view shape of meter-scale aeolian bedforms can be measured in HiRISE images, their height cannot: they are generally lower relief than the precision of HiRISE-produced digital elevation models, and are also too small for other methods used to estimate the height of aeolian bedforms on Mars (Bourke et al., 2006) to be applicable. Hence, it is not possible to determine the extent of the hazard (i.e.the depth of loose material they represent or the magnitude of the slopes on their
flanks) from orbital remote sensing directly. However, we can instead examine a different dataset of morphologically similar ripples from the MER Opportunity rover traverse and use measurements of heightvs. bedform length from these as an analogue dataset. This will not only help us to determine whether such features are likely to be hazardous to ExoMars, but could also provide information about their origin by comparison with similar terrestrial data. Note that in this study we refer to bedform length as the cross-bedform distance parallel to the bedform-forming wind (i.e.perpendicular to the crest of the bedform); for further explanation, see Fig. 3 inBalme et al. (2008).
[image:4.595.44.282.351.706.2]In this study, we present new observations of meter-scale, ripple-like, aeolian bedforms (which we informally refer to as mini-TARs) gathered during the Opportunity rover traverse (Fig. 4), and present data for their height and length. The key result of our study is that an approximation of the height of mini-TARs can be obtained by measuring their lengths in plan-view using high resolution remote sensing data. We also present example bedform length data from two of the proposed ExoMars landing
sites: Oxia Planum and Aram Dorsum. These data are included to provide an illustration of how the height-length data can be applied to the question of rover traversability. We do not aim to investigate every aspect of aeolian hazard to rover traversability (such as grain size, composition, or degree of induration) only the most generic measures that can perhaps be obtained from obit, namely bedform height and planimetric size.
Finally, having obtained height/length data for mini-TARs in the MER Opportunity site, we compare them to previous measurements of TARs. The results indicate that they are part of the same population of aeolian bedforms.
2. Method
2.1. The PRo3D measurement tool and application to MER opportunity data
At the time of writing, the Opportunity rover is still functioning on the surface of Mars, having travelled>45 km, and been active for more than 4850 sols. For much of thefirst 30 km of its voyage, Opportunity moved acrossflat plains with metre-scale ripple-like aeolian bedforms super-posed upon them (Fig. 4). Opportunity acquired numerous stereo imag-ing data of its surroundimag-ings usimag-ing both its scientific Pancam camera system and the navigational NavCam system. Using these data, and newly developed PRo3D™software (Barnes et al., 2017), we are able to produce 3D models of many areas of the surface at sufficiently high resolution to reliably establish heights and lengths of many aeolian bedforms. The data used span the period from sol 550 to 2658 (Fig. 4). The Planetary Robotics 3D viewer (PRo3D) was developed as part of the EU-FP7 PRoViDE project (Traxler et al., 2018) to visualise stereo-imagery collected by rovers on the martian surface. Mosaics taken from the left and right eye of the camera systems (MER Pancam and Navcam and MSL Mastcam) are reconstructed using a Semi-Global Matching (SGM) technique for the Pancam and Navcam, and a Hierar-chical Feature Vector Matching technique for the Mastcam data (HFVM–due to different focal lengths in each eye), using the PRoViP tool, developed by Joanneum Research. These are then globally oriented using SPICE (see: https://naif.jpl.nasa.gov/naif/index.html) kernels and
Planetary Data Systems (PDS) labels and converted to Ordered Point Clouds (OPCs) for visualisation and analysis in PRo3D, directly in the IAU Mars-centred coordinate frame. PRo3D allows for measurement and interpretation of the dimensions and geometries of features in the land-scape, using simple point, line, polyline, polygon, and best-fit plane features, from which relevant attributes can be extracted. For a detailed summary of the PRo3D software and its application to geological analysis of martian rover-derived stereo-imagery, refer toBarnes et al. (2017).
Whilst there are some inherent spatial measurement errors in the photogrammetric reconstructions, due to matching artefacts, camera calibration, and temperature variations, the current version of PRo3D does not incorporate these values specifically into the outputted mea-surements. There is however, a quantifiable error in pixel range deter-mination, the MER Pancam having 5.7 mm of range error at 5 m distance (~0.1%), 23 mm at 10 m distance (~0.2%) and 92.4 mm at 20 m dis-tance (~0.5%). The lateral (vertical and sideways) error is smaller, especially at longer range. These discrepancies can result in distortion of the 3D surface, but are overall rather small. We therefore do not include this error in our PRo3D measurements of aeolian bedform dimensions. Forthcoming versions of PRo3D are embedding the expected metrology error as known from image geometry and scene distance into the mea-surement tool directly, such that every meamea-surement will have an asso-ciated measurement error attached.
Physical calibration of PRo3D has not been done with the MER camera system, but is being performed for the ExoMars PanCam system (Coates et al., 2017). Nevertheless, some calibration can be done in-situ on Mars. To provide general calibration data for PRo3D, and to verify that the tool gives accurate measurements, we used PRo3D to measure the spacing between MER rover tracks and the diameters of holes drilled by the MER Rock Abrasion Tool (“RAT”;Gorevan et al., 2003). The RAT holes are 4.5 cm wide (Thomson et al., 2013), and the lateral spacing between the rover wheels is 1.06 m (Geissler et al., 2010).
[image:5.595.43.555.54.310.2]We made eight measurements offive RAT holes, on an outcrop with a slope of>20at a range of only a few meters from the rover. We obtained a mean RAT hole diameter of 4.8 cm, with a standard deviation of 0.03 cm. We measured rover wheel track separation at two sites, in each case using right-edge to right-edge (or left-edge to left-edge)
measurement of only very well defined tracks from the rear wheels. This was done to avoid uncertainty caused by estimating the centre of a track, or using tracks overprinted by the rear wheels. At thefirst site, where the tracks were very well defined, and in the 3–5 m range from the rover, ten measurements yielded a mean spacing of 1.061 m with a standard de-viation of 0.004 m. For the second site, where the tracks were slightly less well defined, and in the 2.5–7.5 m range from the rover, 15 measure-ments were made, giving a mean spacing of 1.066 m, with a standard deviation of 0.007 m.
We conclude that PRo3D measurements of metre-scale objects in the 2.5–7.5 m range are accurate to within 1% of their true value, suggesting that measurement error is more likely to derive from manual digitization error, rather than inherent errors in the measurement tool. Finally, the good agreement of the RAT hole PRo3D measurements with their true size, even on steep slopes, provides reassurance that the vertical scaling is correct.
2.2. Measurement of bedform height from MER opportunity observations
Our measurements were made with the aim of generating a dataset that could be compared with orbital plan-view HiRISE measurements of
bedform length. Hence, the approach was developed to generate a single representative value of height and length for individual bedforms such that they could be compared with orbital data.
To minimise possible errors inherited from the 3D-model, we measured only bedforms that were close to the rover when observed. Some bedforms could not be well-resolved by the stereo matching used to produce the PRo3D dataset, leading to gaps in the 3D mesh, and in some PRo3D scenes only part of a given bedform was imaged. This meant that there were sometimes no bedforms that could be sampled in a given scene. The sampling strategy was therefore to measure all bedforms within ~7.5 m of the rover that had near-continuous 3D model coverage in PRo3D, and for which reliable digitization seemed possible.
For each candidate bedform analysed with the PRo3D software, the bedform ridge crest was first identified. Then, using a plan-view (downward looking) viewing angle in PRo3D, line objects were con-structed extending perpendicularly from the centre of the ridge crest to the margin of the bedform. Each measurement line was refined using the full range of 3D viewing angles. We generally digitized to the edge of the sediment-covered area for isolated bedforms, using both contact with bedrock and visible breaks in slope to determine the edge of the bedform. For bedforms that coalesced with one another horizontally, we often used an oblique view to determine where the bedform slope ended by exam-ining the cross sectional shape, or the lowest point between bedforms.
Line construction was done for both sides of the bedform, starting at the same point on the ridge and ensuring that both lines were parallel to one another. The bedform length (l) was found by adding the horizontal length of these two lines, and the height (h) by averaging the difference in vertical heights along the lengths of each line–thus accounting for a gently sloping substrate. Five such measurements of h and l were made for each bedform and combined to give mean values for height (H) and length (L), as well as a sample standard deviation (ΔH andΔL). Each of thefive measurements was made slightly apart from the others (a few tens of centimetres along the ridge crest) to provide an estimate of variability:ΔH andΔL. This was done due to the difficulties in generating a representative measure of height and length of a bedform from a single measurement, and the inherent possibility of a single measurement having a higher possibility of digitization or 3D model error, and the converse problem: trying to generate representative a simple height and length measurement from a complex 3D model in a timely fashion.
Thefive measurement method was used as a compromise between the two. Hence, we were able to identify bedforms that had consistently measureable heights and lengths by their small relativeΔH andΔL, as well as potentially poorly digitized bedforms, or those poorly resolved in PRo3D, which had larger values ofΔH andΔL.
From these data,flank slope and plan-view asymmetry (the ratio of the length from the crest to the edge of the bedform measured in one direction, compared to the other) can also be extracted. An example of these construction lines is shown inFig. 5.
In addition, each bedform was classified into one of three classes (i) Type 1: sharp-crested, ripple-like features that show clear zones of sub-strate or bedrock between the bedforms (cf.“closely spaced”bedforms in
Balme et al., 2008,Fig. 5), (ii) Type 2: sharp-crested, ripple-like features that are coalesced, such that no substrate or bedrock can be seen between them (cf.“saturated”bedforms inBalme et al., 2008,Fig. 5), and (iii) Type 3: uncommon, ripple-like bedforms with a more rounded crest shape. Examples of these classes are shown inFig. 6.
[image:6.595.49.277.51.434.2]As a further check of the accuracy of the PRo3D measurements, and to test whether digitizing these features in HiRISE images would provide plausible data for bedform length, we plotted length of each bedform as measured in PRo3D against length for the same bedform measured in HiRISE images. To do this we created a Geographic Information System (GIS) project including a shapefile describing the MER Opportunity rover path from theOpportunity Rover Analyst's Notebook(http://an.rsl.wustl. edu) and the HiRISE images that covered the path. We then used this GIS to identify individual bedforms in the HiRISE images that matched those measured using PRo3D. Finally, we digitized each bedform in the
GIS to obtain an equivalent length measurement to that made in PRo3D.
2.3. Remote sensing measurement of bedform lengths at a candidate ExoMars landing site
To illustrate the frequency distribution of bedform lengths, and the possible effects this may have on rover traversability, we also constructed
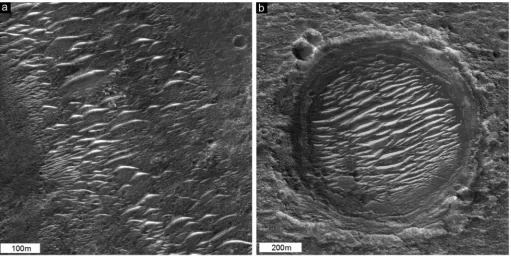
five circular (100 m radius) study areas in the Oxia Planum candidate ExoMars landing site. The aeolian bedforms present in these study areas are shown inFig. 7at a scale of about 1:2500–which is about a factor of 2–3 lower than full-resolution HiRISE images.Fig. 7a–d shows individual study areas andFig. 7f shows the local context for this region. Nearly all the impact craters inFig. 7e contain TARs, so one study area (Oxia1) was specifically chosen to illustrate the distribution of TAR length in these areas, whereas the others focus on the smaller mini-TAR bedforms. The eastern part of the candidate landing site contains many such bedforms, over a much wider region than the topographically confined areas where TARs are found, so we chose four other sites in areas with varying den-sities of these mini-TARs to investigate the distribution and variability in the length of this type of bedform.
Bedforms were digitized in ArcGIS®
software using a simple line drawn perpendicular to the bedform ridge crest across the longest part of the bedform–in a similar way to that done for the comparison with PRo3D described above. Most of the bedforms were digitized at full HiRISE resolution (a scale of about 1:900), but often we had to“zoom in” to a scale of ~1:500 to properly digitize the smaller features. Only one measurement was taken per bedform, but where bedforms appeared to comprise multiple, merged aeolian forms (for example, a very wide bedform with multiple curved‘en-echelon’sections), one measurement was taken for each arcuate component of the compound form.
3. Results
3.1. Aeolian bedform height and length measured from the MER opportunity traverse
119 bedforms were measured in the initial data set. Some of the bedforms analysed had significant variability in height, but variability in measured length was much smaller. The standard deviation (ΔL) of the
five length measurements that were taken for each bedform was less than 10% of the mean length, L, in more than 90% of the cases, but about 30% of the height measurements made had standard deviations (ΔH) of more than 50% of the mean height, H. We therefore provide two datasets: a raw dataset and a “filtered” dataset where measurements with large standard distributions were excluded.Fig. 8a shows mean height H of the
measured bedforms plotted as a function of their lengths L for all 119 measurements in the initial dataset. The vertical error bars show the standard deviation on the height, based onfive measurements, but hor-izontal error bars are not shown, being very small. A simple, unweighted linear regression is provided, together with 95% prediction limits for the data, based on that regression. InFig. 8b, the same plot is provided for the
filtered dataset, in which only those bedforms for whichΔH/H was less than 0.5 were used.Fig. 9shows both initial andfiltered datasets split by bedform class. Other than class 2 (saturated) bedforms appearing to be slightly larger and taller, the data for the three classes plot on the same trend, and thus seem to represent the same population of features.
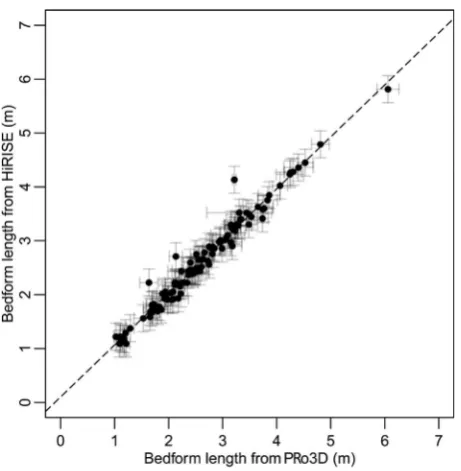
[image:7.595.41.286.55.198.2]The lengths of bedforms measured in PRo3D were compared with the same measurements obtained using HiRISE remote sensing data (see “Approach”section, above). Error on PRo3D length was taken to be equivalent to the standard deviation of thefive measurements used to obtain length, L, for each bedform and was estimated to be equal to 1
[image:7.595.314.548.56.472.2]Fig. 5.Aeolian bedforms in Meridiani Planum as seen in PRo3D software. This image shows a mosaic of MER Opportunity Pancam images overlain on a 3D model constructed from stereo images. PRo3D allows the viewpoint to be chosen to best show the surface features, it does not have to be afixed perspective from the point of view of the sensor. The different coloured lines show examples of ripple-length measurements. We tried to digitize features in the centre of the scene, and in the near-field to avoid distortion.
pixel in the GIS-based measurement (i.e.,25 cm). These data plot on a straight line of gradient 1 with little deviation (Fig. 10). This provides confidence both that the PRo3D measurements are accurate (at least in terms of horizontal scale) and, because there is no noticeable change in how well the data fit the trend line for the smallest features, that measuring bedform length in HiRISE images is an acceptable sampling method, at least for bedforms>1 m length. If this were not the case, and the HiRISE data had substantial measurement errors for smaller bedforms compared to the more precise PRo3D measurements, it might be ex-pected that there would be considerable scatter in the shorter bedform-length region of the plot, but this is not observed.
Two additional parameters were extracted from this dataset: flank slope and asymmetry. Flank slope is defined simply as tan 1[H/2L], calculated in degrees and shown inTable 1. This measure obviously does not constrain the full range of slopes seen at individual bedforms (for example, the slopes near the crest lines may be steeper, or more rounded), but instead provides a gross estimate of the types of slope a rover might encounter if trying to traverse across and through the loose material.
Asymmetry was measured by making use of the fact that the length of each bedform was constructed from two lines, each measured from the same point on the bedform crest, but in opposite directions. Hence, these two measurements are“half-lengths”, such that the asymmetry value is simply defined as the magnitude of the ratio of the longer half-length to the shorter. Symmetrical bedforms will have an asymmetry of 1, with larger values showing increased asymmetry. An asymmetry value of 2 indicates a bedform that has one side twice as long as the other. If the bedforms are generally symmetrical, the asymmetry values will be strongly clustered around a value of 1. A population of asymmetrical bedforms will show a broader distribution with many higher values. As it is, the data are indeed strongly clustered around 1, with more than 50% of all bedforms having an asymmetry value of<1.15 (using either the
filtered or unfiltered dataset). Asymmetrical bedforms are, in fact, rare, with less than 5% of the bedforms having an asymmetry of more than 1.5. This result remains true even when considering the smaller morphology-specific subsets (classes 1–3) of the data on their own (Table 1).
Flank slopes (Table 1) for classes 1 and 2 are generally 6–7, with the class 3 (rounded crest) bedforms being slightly shallower at 5.2
. How-ever, only seven measurements were made of class 3 bedforms, and the mean slope is little more than one standard deviation away from that of the whole population, so we do not consider this to be a significant result.
3.2. Length distributions mini-TAR type aeolian bedforms at two ExoMars rover candidate landing sites
Five study areas in the Oxia Planum candidate ExoMars rover landing site were examined. The size frequency distributions and a comparative summary plot for these data are shown inFig. 11. As the distributions of the measured length data are not normal, the mean and standard dis-tribution are not used to summarise the populations. Instead, the data in
Fig. 11f are shown as comparative box plots. A summary of the collected data is shown inTable 2.
As can be seen inFig. 11, there is a clear difference between the length distribution of the TAR-like bedforms (Oxia1) and the mini-TARs (other areas). Although there are many small bedforms in area Oxia1, there are also a few tens of bedforms with lengths greater than 10 m. Bedforms of this scale are not found in the other areas; most of the bedforms found in those areas are less than 5 m in length.
4. Discussion
4.1. Comparison with previous data of similar aeolian bedforms
4.1.1. TARs
The data shown inFig. 8provides an approximation for the expected height of a martian mini-TAR style bedform as a function of its length: the
mini-TARs are generally about 15 times longer than they are high. Interestingly, the length/height trend of our data match the length-height relationships for larger TARs (e.g.,Hugenholtz et al., 2017). For example, when the data fromFig. 8b are plotted against the TAR data fromHugenholtz et al. (2017)the linear regression line passes through the approximate centre of the distribution of the TAR trend (Fig. 12). This observation is consistent with the interpretation that mini-TARs are simply small TARs as there is no evidence that they plot on a different trends.
Another line of evidence to support the interpretation that mini-TARs are simply small TARs is that the mini-TARs generally have high plan-view symmetry (i.e. the ridge crest is situated at the midpoint across the bedform when viewed from above). This is consistent with obser-vations of TARs, which also have highly symmetric profiles (Shockey and Zimbelman, 2013), although it should be noted that these two datasets were acquired in slightly different ways:Shockey and Zimbelman (2013)
relying on topographic profiles obtained from photoclinometry, rather than on the combination of photogrammetric 3D models and overlain imagery as we did here. Finally, the conclusions that the bedforms studies here are simply small TARS is reinforced by their morphology, the mini-TARs being almost identical in form to“simple”TARs as described byBalme et al. (2008), but two to three times smaller.
Some TAR studies yield slightly divergent comparisons: for example,
Shockey and Zimbelman (2013) also measured heights and lengths (although they refer to the lengths as‘widths’) of many TARs using more than 60 topographic profiles. They found TAR length/height ratios of 3.4–125 with a mean of 8.3, compared to our study result of ~15. Similarly, although our length/height trend is visually a good match for theHugenholtz et al. (2017)dataset (Fig. 12), theyfind that, on average TARs in their study are slightly steeper: ~13 times longer than they are tall, compared to ~15 times in our study. This could be due to the effects of slightly larger TARs, which appear to be steeper in their dataset (i.e. more points are above the best-fit line than below as length increases in
Fig. 12), decreasing the mean. Hence, while our data appear to be consistent with an interpretation of mini-TARs being TARs, there is a possibility that TAR length/height ration is not scale independent, and so smaller bedforms might represent a slightly different population. It has been postulated, for example, that TARs of different scale may form in different ways: smaller ones as megaripples, larger examples as small reversing dunes (Zimbelman et al., 2012; Zimbelman and Williams, 2007), althoughHugenholtz et al. (2017)find little evidence for this in the population they studied.
It should be noted that the TARs measured byShockey and Zimbel-man (2013)andHugenholtz et al. (2017)have mean lengths and heights that are nearly an order of magnitude larger than the mini-TAR bedforms examined in this study, and that relative measurement error in vertical height will always be fairly large when using from-orbit photoclinometry or photogrammetry to try to determine the height of bedforms that are only 5–10 times higher than the pixel size of the imaging data from which the topographic data are generated.
4.1.2. Megaripples
In addition to comparisons with orbital data, the mini-TAR style bedforms can also be compared to other surface-based observations of similar features. For example, the ripples analysed by Lapotre et al. (2016)have mean wavelengths of 2.1–3.6 m, similar to those analysed here, but occur in a different setting (they are found on the backs of large dunes, rather than existing as individual ripples). Unfortunately, height information is not available, so these are less useful for direct comparison with our data.
Bedforms described as “megaripples” were traversed by the MSL rover (Arvidson et al., 2017). One particular example is a large bedform located at the mouth of a shallow valley. The valley was referred to as “Moon Light Valley”and the bedform as the“Dingo Gap megaripple” (Arvidson et al., 2017). The Dingo Gap megaripple is described as being
~1 m high and having a wavelength (presumably equivalent to length) of ~7 m (Arvidson et al., 2017), although the rover elevation plot of the traverse across the bedform seems to suggest that the length of the feature is more like 12 m and its height about 0.6 m. Also, these elevation data neglect sinkage into the dune by the rover, which would tend to reduce the measured height. The length/height ratio from these two estimates of height and length give a range of 7–20, comparable to our mini-TAR data. Again, though, it should be noted that the setting of the Dingo Gap megaripple is dissimilar to that of theflatter,‘plains’setting of the MER Opportunity traverse–it appears perched on a saddle-like area at the mouth of the valley (see, for example, Figs. 5 and 6 inArvidson et al., 2017).
[image:10.595.102.496.53.256.2]The megaripples that MSL encountered within Moon Light Valley,
[image:10.595.101.499.295.494.2]Fig. 8.MER Opportunity ripple-like bedform data, as measured in PRo3D. a) Initial dataset. b) Filtered dataset, removing data with large fractional standard deviation in measured ripple height. See text for explanation of lines and error bars. P-values of R-squared are<0.01 for both regressions.
Fig. 9.MER Opportunity ripple-like bedform data, as measured in PRo3D and split by morphological classification. a) Initial dataset. b) Filtered dataset, removing data with large variations in measured ripple height. Class 1 data represent bedforms with surface material or bedrock between them, class 2 data represent“saturated”bedforms that are laterally coalesced, and class 3 data represent bedforms with less crisp, rounded ridge morphology. Error bars as inFig. 8, but omitted for clarity. Dashed line is a simple linear regression. P-values of R-squared are<0.01 for both regressions.
slightly farther along the rover traverse than Dingo Gap, are arguably more similar to the MER Opportunity examples. Although they are confined within a valley, they are within a locallyflat-lying area. These are described as having heights of 0.1–0.15 m with wavelengths of 2–3 m (Arvidson et al., 2017). Assuming that the wavelength is equivalent to the length for these ripplee (which appears reasonable given that imaging data suggests that the ripples are nearly“saturated”with little bedrock between them), the length/height ratios are ~ 20 (probably smaller as true length is<wavelength) so plot within the bounds of our dataset in
Fig. 8. Megaripplefields reported in two other parts of the MSL traverse (Moosilauke Valley and Hidden Valley) are described byArvidson et al. (2017). One ripple at Moosilauke Valley is described as being ~0.4 m high, with a wavelength (presumably, equivalent to length) of ~6 m. This is equivalent to a length/height ratio of 15–very close to the data we have collected from the MER Opportunity traverse.
Other ripples in these two areas are described as having heights of 0.15–0.2 m with wavelengths of 2–10 m (Moosilauke) and heights of 0.15–0.2 m with wavelengths of 2–3 m (Hidden Valley). Images of the Hidden Valley megaripples (Figs. 17 and 18;Arvidson et al., 2017) show these ripples are ‘saturated’; i.e., the length measurement is approxi-mately equivalent to the wavelength. The length/height data for these are also consistent with our data. The Moosilauke examples appear to be
find good agreement between the heights and lengths of the bedforms we measured at the MER Opportunity traverse, and published data for ripple heights and lengths seen at the MSL Curiosity site. An important task for future work would be to use PRo3D to measure similar features at the MSL site to test whether small aeolian bedforms here really do have similar shapes to those measured here.
4.2. Traversability of ripple-like bedforms by a hypothetical rover
As discussed above, aeolian bedforms can constitute a formidable hazard or barrier to rover locomotion. The measured height of an aeolian bedform can provide an estimate of its traversability: low bedforms with shallow slopes being less dangerous to traverse than taller, steeper ones. From the comparison with terrestrial and other martian megaripples above, and knowing the approximate height of similar aeolian bedforms predicted to be a hazard for a rover's safe operation, we could use such data to infer whatlengthsof aeolian bedforms–as measured in high-resolution plan-view remote-sensing images–are likely to correspond to heights of bedforms that pose a significant risk to a rover. Conversely, we could also use these data to infer what maximum lengths of bedforms in a given area are likely not to pose a risk to a rover–which can then be used strategically to help select landing sites in thefirst place, or to aid in long term planning for rover operations. Although measurement of bedform heights can be more easily and accurately performed usingin situstereo observations, as demonstrated here, such a technique provides no forward planning capability. The measurements we have made, though, can be used to infer the heights of features seen on the surface from orbital data, and hence can help provide information for landing site selection, or for strategic mission operations.
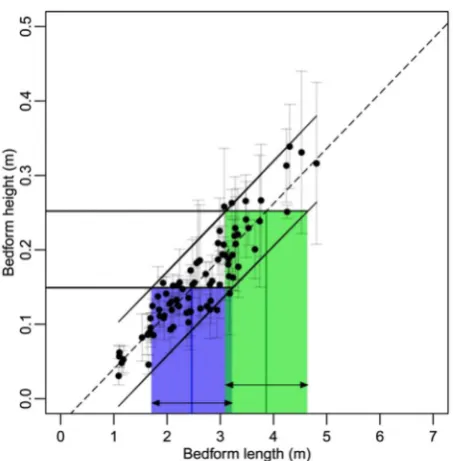
For example, inFig. 13, two hypothetical bedform heights are shown: 15 cm and 25 cm, along with the bedform length that they are equivalent to in measurements from MER Opportunity data. Here, we can see that if the threshold for a bedform being“too high”to cross by a rover is 25 cm, then the average length that matches this height is just under 4 m (green line centred on the green box inFig. 13). This means that, assuming the bedforms at a given site are of a similar shape population to those seen in the MER Opportunity traverse (which appears to be a reasonable assumption as shown in the comparisons above), a bedform recorded from orbit as having this length has a 50% chance of being higher than the traversability threshold. The green shaded area inFig. 13provides the 95% prediction limits of the data. Thus, again assuming the bedforms are similar to those seen in the MER Opportunity traverse, this means that bedforms longer than about 4.75 m have a 95% chance of being too high for the rover to cross, while bedforms with lengths less than about 3 m have a 95% chance of being successfully negotiated.
[image:11.595.49.280.51.287.2]However, if the rover were only capable of crossing bedforms of 15 cm height (blue shaded regions inFig. 13), then ripples with lengths of just ~2.5 m would have a 50% chance of being uncrossable, and those longer than about 3 m would have a 95% chance of being too high to traverse safely. Bedforms recorded from orbit as having a length of ~1.75 m, however, would only have a 5% chance of being too high for the rover to traverse. Hence, based on our study, we can suggest that the “95% traversability bedform length”is ~1.75 m for a rover that can cross
Fig. 10.MER Opportunity ripple-like bedform length data, as measured in PRo3D and in ArcGIS®
[image:11.595.37.289.380.490.2]using HiRISE images. Error bars as described in text. Dashed line is a simple linear regression. P-value of R-squared is<0.01.
Table 1
Median asymmetry and mean slope values for MER Opportunity ripple-like bedforms as measured in PRo3D. The scatter of the distribution is represented by the 95 percentile value for asymmetry (which does not have a normal distribution) and by standard deviation for the slope (which approximately does).
Data subset Number of data points
Median Asymmetry [95th percentile]
Meanflank slope () [Standard Deviation]
Initial data (all classes)
119 1.15 [1.50] 6.5 [1.5]
Filtered data (all classes)
83 1.14 [1.43] 6.8 [1.3]
Class 1 (initial data)
86 1.15 [1.58] 6.6 [1.6]
Class 2 (initial data)
26 1.18 [1.37] 6.8 [1.3]
Class 3 (initial data)
bedforms up to 15 cm in height, but improves to ~3 m for a rover that can cross 25-cm-high bedforms. In practice we note that the material prop-erties of the bedform (e.g. grain size, armouring by larger particles), will also be of importance, and adds an element of uncertainty to this pre-diction. However, if laboratory-based simulations can mimic the grain size, material properties and morphology of martian aeolian bedforms, then the results of experiments used to determine the height of bedform a rover can cross will be directly applicable to this approach.
4.3. Application of traversability thresholds to candidate ExoMars landing sites
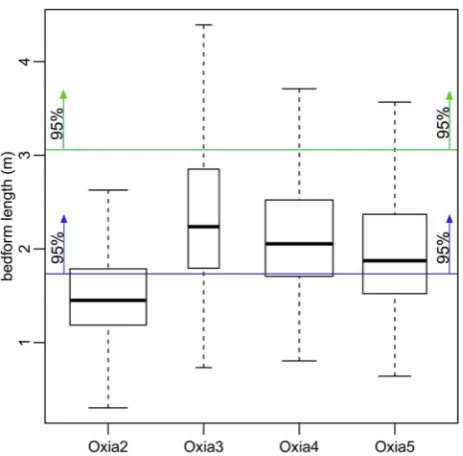
The small aeolian bedforms in Oxia Planum that we measured are similar in morphology and size to the plains-ripples/mini-TARs observed by MER Opportunity. The variations in length of these bedforms (Fig. 11) are similar to those seen in Meridiani Planum, with the exception of the TARs in area Oxia1. These data allow us to test the traversability of the various study areas in Oxia Planum, based upon hypothetical rover bedform traversability and the assumption that the Meridiani Planum bedforms are similar in shape to those at Oxia Planum. If we again assess the same two idealized cases–a rover capable of traversing 15 cm high bedforms and a rover capable of traversing 25 cm high bedforms–we can use the data presented inFig. 13to assess the likelihood that a rover has, for example, a 95% chance of traversing the bedforms in a given region. This is illustrated inFig. 14which compares the length data fromFig. 11
with the equivalent traversable length criteria from Fig. 13. Fig. 14
Shows that if the rover can traverse 25 cm high bedforms safely, then almost all the bedforms in the Oxia2, Oxia 3 and Oxia 4 are smaller than the“95% traversability bedform length”(the green line in Fig. 14is above most of the length-frequency distribution of the four areas stud-ied). This suggests that this would be a relatively safe place for the rover to manoeuver. On the other hand, if the rover could only traverse 15 cm high bedforms safely, then the majority of the bedforms that it would encounter in these regions (with the exception of area Oxia 2) would be longer than the“95% traversability bedform length”, and so this would be a region where the rover would encounter many un-crossable aeolian bedforms.
This study provides a framework for a method to determine the de-gree of hazard posed by aeolian bedforms for regions of Mars using only remote sensing data. Of course, there are some assumptions inherent to the method, including:
(i) that the reference population of bedforms (in this case, in Mer-idiani Planum) is representative of bedforms of this size and morphology (i.e. simple plan-view crestlines) on Mars in general. The similarity in shape and scale of the Meridiani bedforms to other 1–5 m long aeolian bedforms seen on Earth and Mars sug-gests this may not be a bad assumption, but clearly more mea-surements are needed. This could be done for bedforms at the MSL and MER Spirit sites and can perhaps be augmented in the future from ExoMars rover measurements. Such measurements could be used to test whether differences in bedform morphology and local bedrock geology between study areas affect the height-length relationship of aeolian bedforms.
(ii) that there is a quantifiable scatter in the height-length distribution that allows the probability of a bedform having a certain height to be predicted from its length. Such a relationship is shown inFig. 8, but the reliability of this relationship could be improved by adding more data. As for point (i), this could be done by adding in ob-servations from other martian rover and lander sites.
[image:13.595.320.549.51.282.2](iii) that there is a well-constrained set of laboratory orfield investi-gation data that describes how successfully a given rover can cross aeolian bedforms, and that this can be simplified into a single
Fig. 13.Hypothetical bedform heights crossable by a rover, and their matching lengths. Two heights (25 cm - green, and 15 cm - blue) are shown, together with the 5%, 50% and 95% probability match for their lengths. See text for explanation. (For interpretation of the references to colour in thisfigure legend, the reader is referred to the Web version of this article.)
[image:13.595.41.286.88.390.2]“crossable height”. Such experiments should be performed to mimic the grain sizes, slopes and heights of martian bedforms as closely as possible.
(iv) material properties such as grain size and armouring by coarse grained deposits on the upper surfaces or interdune areas are also likely to effect traversability, and the results of ongoing rover trials will help reduce uncertainty created by this. Hence, bedform height/slope alone cannot be the sole focus of traversability studies.
The illustrative remote sensing data we collected provides some predictions about the probable size distribution of aeolian bedforms in the Oxia Planum region, but requires the results of rover testing to be able to constrain the likely traversability of a given area. Alternatively, this same method could be used to present rover builders or testers with data that could feed into the design of their vehicles, or the implementation of driving techniques. As with all population studies, the approach can be improved with a larger dataset, and these should be collected from more diverse landing sites, or from diverse locations within a rover traverse.
4.4. Preliminary results of ExoMars rover locomotion tests
The veryfirst measurements conducted by the ExoMars team at a dedicated rover locomotion test facility in RUAG (Switzerland) show that, on the type of soils a vehicle may expect to encounter when traversing aeolian bedforms on Mars, the ExoMars rover is likely to experience excessive wheel slippage (90%), leading to significant sinkage (half a wheel diameter) and slow locomotion progress on 8 slopes. However, when engaging the wheel walking gait on the same terrain, the rover can safely negotiate 23slopes in steady state—that is, irrespective of the slope length—with no appreciable wheel sinkage. These test results confirm that wheel walking can be an important asset for improving slope traversability and mission safety in general. How-ever, as discussed before, wheel walking—if implemented—would be an “emergency”mode to be commanded from the ground, since progress is slower than with“normal”locomotion under moderate slip rate.
The method described here provides a useful means to estimate under
what circumstances and how often a vehicle can expect to experience locomotion difficulties based on the presence of aeolian bedforms that could be risky, or mission-resource expensive to negotiate (e.g. in terms of time or electrical energy). This would be the case when dealing with an extensivefield of such bedforms, where the ripples would have to be navigated one after the other over considerable distances; for example, if the mission landed in the middle of a region of TARs.
5. Conclusions
Small, meter-scale aeolian bedforms observed by the MER Opportu-nity rover in the Meridiani Planum region of Mars have lengths parallel to the bedform-forming winds that are ~15 times their crest-ridge heights. They are generally symmetrical in terms offlank lengths and have gross
flank slopes of approximately 6–7
. These measurements are generally similar to those made for megaripples on Earth, and are within the dis-tributions of the same measurements made for TARs on Mars. The data are in agreement with the hypothesis that these martian bedforms formed by the same processes as terrestrial megaripples. We conclude that these smaller bedforms are therefore likely to be small TARs, and part of the same continuum of aeolian bedforms. The measurement of bedform length, made either from the surface or in remote sensing data, can therefore be used as a proxy for bedform height. Assuming that all morphologically similar bedforms of similar size on Mars follow this distribution, our results provide a means of assessing the height of small (~10 m length or smaller) aeolian bedforms on Mars from plan-view orbital data alone.
As the traversability of aeolian bedforms depends partly upon their crest ridge heights (taller bedforms containing deeper sand and dust being more likely to provide a barrier or hazard to a rover) the mea-surement of bedform length can provide afirst order approximation of the traversability of aeolian bedforms. Further, the distribution of measured bedform heights for a given measured bedform length can be used to constrain the likely range of bedform heights at a given site. Thus, if the maximum height of aeolian bedforms that a rover can traverse is known, this can be converted into an equivalent length of bedform, and hence be used to derive the probability that a rover can cross the bed-forms seen from orbit at a given location.
Aeolian bedforms similar in scale and form to those seen in Meridiani Planum occur in abundance on the plains regions of ExoMars Oxia Pla-num candidate landing site. Slightly larger aeolian bedforms, TARs, are also present at this site, but are mainly confined to topographic de-pressions such as impact craters. The TARs here have lengths of up to 15 m, whereas the bedforms measured in the other sites generally have lengths less than 4 m. The other candidate site, Mawrth Vallis, also contains extensive aeolian bedforms of similar size.
Combining these measurements with the length-height distribution measured from Meridiani Planum, and assuming that this also applies to other regions of Mars, allows a prediction of whether the bedforms in Oxia Planum will be traversable by the ExoMars rover. If the ExoMars rover can safely traverse aeolian bedforms with 25 cm high crest-ridges, then our measurements suggest that most of the bedforms found on the
flat plains of Oxia Planum will be lower than this threshold height. Conversely, if the ExoMars rover will only be able to cross aeolian bed-forms with 15 cm high ridge crests, then most of the bedbed-forms will have ridge crests higher than this.
If wheel walking is implemented in the ExoMars rover design, this technique will boost considerably the rover's capacity for negotiating unconsolidated terrains and challenging slopes, but at a cost in time and energy. Our method could be adapted to provide an indication of under what circumstances, and how often, it would be likely that wheel walking would need to be engaged at a given candidate site.
[image:14.595.48.280.52.280.2]Although this study involved relatively few bedforms (~100), the approach provides a template for how one aspect of rover traversability of aeolian bedforms could be assessed from orbital data. This could be important both for assessing future landing sites, and for strategic
N50421X/1). We thank Jim Zimbelman and an anonymous reviewer for their insightful reviews.
References
Arvidson, R.E., Ashley, J.W., Bell, J.F., Chojnacki, M., Cohen, J., Economou, T.E., Farrand, W.H., Fergason, R., Fleischer, I., Geissler, P., Gellert, R., Golombek, M.P., Grotzinger, J.P., Guinness, E.A., Haberle, R.M., Herkenhoff, K.E., Herman, J.A., Iagnemma, K.D., Jolliff, B.L., Johnson, J.R., Klingelh€ofer, G., Knoll, A.H., Knudson, A.T., Li, R., McLennan, S.M., Mittlefehldt, D.W., Morris, R.V., Parker, T.J., Rice, M.S., Schr€oder, C., Soderblom, L.A., Squyres, S.W., Sullivan, R.J., Wolff, M.J., 2011. Opportunity Mars Rover mission: overview and selected results from Purgatory ripple to traverses to Endeavour crater. J. Geophys. Res. 116https://doi.org/ 10.1029/2010JE003746.
Arvidson, R.E., Bell, J.F., Bellutta, P., Cabrol, N.A., Catalano, J.G., Cohen, J., Crumpler, L.S., Des Marais, D.J., Estlin, T.A., Farrand, W.H., Gellert, R., Grant, J.A., Greenberger, R.N., Guinness, E.A., Herkenhoff, K.E., Herman, J.A., Iagnemma, K.D., Johnson, J.R., Klingelh€ofer, G., Li, R., Lichtenberg, K.A., Maxwell, S.A., Ming, D.W., Morris, R.V., Rice, M.S., Ruff, S.W., Shaw, A., Siebach, K.L., de Souza, P.A., Stroupe, A.W., Squyres, S.W., Sullivan, R.J., Talley, K.P., Townsend, J.A., Wang, A., Wright, J.R., Yen, A.S., 2010. Spirit Mars rover mission: overview and selected results from the northern home plate Winter haven to the side of Scamander crater. J. Geophys. Res. 115https://doi.org/10.1029/2010JE003633.
Arvidson, R.E., Iagnemma, K.D., Maimone, M., Fraeman, A.A., Zhou, F., Heverly, M.C., Bellutta, P., Rubin, D., Stein, N.T., Grotzinger, J.P., Vasavada, A.R., 2017. Mars science laboratory curiosity rover megaripple crossings up to sol 710 in Gale Crater: curiosity rover megaripple crossings. J. Field Robot. 495–518.https://doi.org/ 10.1002/rob.21647.
Bagnold, R.A., 1941. The Physics of Windblown Sand and Desert Dunes. Methuen, London.
Balme, M.R., Berman, D.C., Bourke, M.C., Zimbelman, J., 2008. Transverse aeolian ridges (TARs) on Mars. Geomorphology 101, 703–720.
Barnes, R., Gupta, S., Traxler, C., Hesina, G., Ortner, T., Huber, B., Juhart, K., Fritz, L., Nauschnegg, B., Muller, J.-P., Tao, Y., 2017. Geological analysis of martian rover-derived digital outcrop models using the 3D visualisation tool, Pro3D. Earth Space Sci. in prep.
Berman, D.C., Balme, M.R., Rafkin, S.C.R., Zimbelman, J.R., 2011. Transverse aeolian ridges (TARs) on Mars ii: distributions, orientations, and ages. Icarus 213, 116–130.
Bourke, M.C., Balme, M.R., Beyer, R.A., Williams, K.K., Zimbelman, J., 2006. A comparison of methods used to estimate the height of sand dunes on Mars. Geomorphology 81, 440–452.
Bourke, M.C., Wilson, S., Zimbelman, J.R., 2003. The variability of TARs in troughs on Mars. In: Lunar Plan Sci XXXIV CDROM Abstr. # 2090.
Bridges, N.T., Geissler, P.E., McEwen, A.S., Thomson, B.J., Chuang, F.C., Herkenhoff, K.E., Keszthelyi, L.P., Martínez-Alonso, S., 2007. Windy Mars: a dynamic planet as seen by the HiRISE camera. Geophys. Res. Lett. 34, L23205https://doi.org/10.1029/ 2007GL031445.
Coates, A.J., Jaumann, R., Griffiths, A.D., Leff, C.E., Schmitz, N., Josset, J.-L., Paar, G., Gunn, M., Hauber, E., Cousins, C.R., Cross, R.E., Grindrod, P., Bridges, J.C., Balme, M., Gupta, S., Crawford, I.A., Irwin, P., Stabbins, R., Tirsch, D., Vago, J.L., Theodorou, T., Caballo-Perucha, M., Osinski, G.R., the PanCam Team, 2017. The PanCam instrument for the ExoMars rover. Astrobiology 17, 511–541.https:// doi.org/10.1089/ast.2016.1548.
Cutts, J.A., Smith, R.S.U., 1973. Aeolian deposits and dunes on Mars. J. Geophys. Res. 78, 4139–4154.
Geissler, P.E., Sullivan, R., Golombek, M., Johnson, J.R., Herkenhoff, K., Bridges, N., Vaughan, A., Maki, J., Parker, T., Bell, J., 2010. Gone with the wind: Eolian erasure of the Mars rover tracks. J. Geophys. Res. E Planets 115.
Gorevan, S.P., Myrick, T., Davis, K., Chau, J.J., Bartlett, P., Mukherjee, S., Anderson, R., Squyres, S.W., Arvidson, R.E., Madsen, M.B., Bertelsen, P., Goetz, W., Binau, C.S., Richter, L., 2003. Rock abrasion tool: Mars exploration rover mission. J. Geophys. Res. Planets 108.https://doi.org/10.1029/2003JE002061.
Grotzinger, J.P., Crisp, J., Vasavada, A.R., Anderson, R.C., Baker, C.J., Barry, R., Blake, D.F., Conrad, P., Edgett, K.S., Ferdowski, B., Gellert, R., Gilbert, J.B., Golombek, M., Gomez-Elvira, J., Hassler, D.M., Jandura, L., Litvak, M., Mahaffy, P., Maki, J., Meyer, M., Malin, M.C., Mitrofanov, I., Simmonds, J.J., Vaniman, D., Welch, R.V., Wiens, R.C., 2012. Mars science laboratory mission and science
mapping of Mars with MRO HiRISE stereo images: meter-scale slopes of candidate Phoenix landing sites. J. Geophy. Res. 113https://doi.org/10.1029/2007JE003000. Lapotre, M.G.A., Ewing, R.C., Lamb, M.P., Fischer, W.W., Grotzinger, J.P., Rubin, D.M.,
Lewis, K.W., Ballard, M.J., Day, M., Gupta, S., Banham, S.G., Bridges, N.T., Des Marais, D.J., Fraeman, A.A., Grant, J.A., Herkenhoff, K.E., Ming, D.W.,
Mischna, M.A., Rice, M.S., Sumner, D.A., Vasavada, A.R., Yingst, R.A., 2016. Large wind ripples on Mars: a record of atmospheric evolution. Science 353, 55–58.
https://doi.org/10.1126/science.aaf3206.
Malin, M.C., Bell, J.F., Cantor, B.A., Caplinger, M.A., Calvin, W.M., Clancy, R.T., Edgett, K.S., Edwards, L., Haberle, R.M., James, P.B., Lee, S.W., Ravine, M.A., Thomas, P.C., Wolff, M.J., 2007. Context camera investigation on board the Mars reconnaissance orbiter. J. Geophy. Res. 112https://doi.org/10.1029/ 2006JE002808.
McEwen, A.S., Eliason, E.M., Bergstrom, J.W., Bridges, N.T., Hansen, C.J., Delamere, W.A., Grant, J.A., Gulick, V.C., Herkenhoff, K.E., Keszthelyi, L.P., Kirk, R.L., Mellon, M.T., Squyres, S.W., Thomas, N., Weitz, C.M., 2007. Mars reconnaissance Orbiter's high resolution imaging science experiment (HiRISE). J. Geophys. Res. 112https://doi.org/10.1029/2005JE002605.
Patel, N., Slade, R., Clemmet, J., 2010. The ExoMars rover locomotion subsystem. J. Terramechanics 47, 227–242.https://doi.org/10.1016/j.jterra.2010.02.004.
Rover Team, 1997. Characterization of the martian surface deposits by the Mars pathfinder rover. Sojourner. Sci. 278, 1765–1767.
Sharp, R.P., Malin, M.C., 1984. Surface geology from Viking landers on Mars: a second look. Geol. Soc. Am. Bull. 95, 1398–1412. https://doi.org/10.1130/0016-7606(1984)95<1398:SGFVLO>2.0.CO;2.
Shockey, K.M., Zimbelman, J.R., 2013. Analysis of transverse aeolian ridge profiles derived from HiRISE images of Mars. Earth Surf. Process. Landf. 38, 179–182.
https://doi.org/10.1002/esp.3316.
Squyres, S., Arvidson, R.E., Bell, J.F., Brückner, J., Cabrol, N.A., Calvin, W., Carr, M.H., Christensen, P.R., Clark, B.C., Crumpler, L., Des Marais, D.J., d'Uston, C., Economou, T., Farmer, J., Farrand, W., Folkner, W., Golombek, M., Gorevan, S., Grant, J.A., Greeley, R., Grotzinger, J., Haskin, L., Herkenhoff, K.E., Hviid, S., Johnson, J., Klingelh€ofer, G., H. Knoll, A., Landis, G., Lemmon, M., Li, R., Madsen, M.B., Malin, M.C., McLennan, S.M., McSween, H.Y., Ming, D.W., Moersch, J., Morris, R.V., Parker, T., Rice, J.W., Richter, L., Rieder, R., Sims, M., Smith, M., Smith, P., Soderblom, L.A., Sullivan, R., W€anke, H., Wdowiak, T., Wolff, M., Yen, A., 2004. The opportunity Rover's athena science investigation at Meridiani Planum, Mars. Science 306, 1698–1703.
Sullivan, R., Banfield, D., Bell, J.F., Calvin, W., Fike, D., Golombek, M.P., Greeley, R., Grotzinger, J., Herkenhoff, K.E., Jerolmack, D., Malin, M.C., Ming, D., Soderblom, L.A., Squyres, S., Thompson, S.D., Watters, T.R., Weitz, C.M., Yen, A., 2005. Aeolian processes at the Mars exploration rover Meridiani Planum landing site. Nature 436, 58–61.
Thomson, B.J., Bridges, N.T., Cohen, J., Hurowitz, J.A., Lennon, A., Paulsen, G., Zacny, K., 2013. Estimating rock compressive strength from Rock Abrasion Tool (RAT) grinds. J. Geophys. Res. Planets 118, 1233–1244.https://doi.org/10.1002/jgre.20061.
Traxler, C., Ortner, T., Hesina, R., Barnes, R., Gupta, S., Paar, G., Muller, J.-P., Tao, Y., 2018. The PRoViDE Framework: Accurate 3D Geological Models for Virtual Exploration of the Martian Surface from Rover and Orbital Imagery, in: 3D Digital Geological Models: from Terrestrial Outcrops to Planetary Surfaces. John Wiley and Sons (in press).
Vago, J., Witasse, O., Svedhem, H., Baglioni, P., Haldemann, A., Gianfiglio, G., Blancquaert, T., McCoy, D., Groot de, R., 2015. ESA ExoMars program: the next step in exploring Mars. Sol. Syst. Res. 49, 518–528.https://doi.org/10.1134/ S0038094615070199.
Mars and the search for biosignatures with the ExoMars rover. Astrobiology 17, 471–510.https://doi.org/10.1089/ast.2016.1533.
Zhou, F., Arvidson, R.E., Bennett, K., Trease, B., Lindemann, R., Bellutta, P.,
Iagnemma, K., Senatore, C., 2014. Simulations of Mars rover traverses: simulations of Mars rover traverses. J. Field Robot. 31, 141–160.https://doi.org/10.1002/ rob.21483.
Zimbelman, J.R., Williams, S.H., 2007. Dunes versus Ripples: Topographic Profiling across Terrestrial Examples, with Application to the Interpretation of Features on Mars. AGU Spring Meet. Abstr. 34, P34A–07.