Int. J. Electrochem. Sci., 7 (2012) 3513 - 3526
International Journal of
ELECTROCHEMICAL
SCIENCE
www.electrochemsci.orgEnhancing the Performance of a Batch Electrocoagulation
Reactor for Chromium Reduction Using Gas Sparging
M.A. Daous*, A.H. El-Shazly
Chemical and Materials Engineering Department, Faculty of Engineering, King Abdulaziz University, Jeddah, Saudi Arabia.
*
E-mail: [email protected]
Received: 26 December 2011 / Accepted: 23 February 2012 / Published: 1 April 2012
This work investigates improving the performance of an electrocoagulation reactor for a hexavalent chromium reduction process by introducing gas sparging as a simple, cheap, and efficient method to improve the rate of mass transfer within the reactor. The effect of several variables on the reactor performance were investigated, such as the gas flow rate, initial Cr(VI) concentrations, the concentration of sodium chloride as an electrolyte solution, and the current density. Results show that, depending on current density employed, gas sparging can produce a 40 to 50 % improvement in Cr(VI) reduction and up to 90 % reduction in cell potential. Moreover, SEM and EDX analysis reveal that increasing gas flow rate leads to a decrease in the percentage of chromium adsorbed on the iron surface, which in turn decreases the possibility of anode surface passivation and enhances dissolution rate of iron anode and improves the unit performance.
Keywords: Electrocoagulation, hexavalent chromium, wastewater, gas sparging, electrochemical reactor
1. INTRODUCTION
Hexavalent chromium is well known for its toxicity. The element can potentially be released into aquatic environment by many different industries, such as those using Cr(VI) in organic synthesis or as an oxidizing agent, in metal finishing industries, chromate production, electroplating, tannery, fertilizer industries, and in industries employing Cr(VI) compounds as corrosion inhibitors, such as in cooling towers [1–3]. Reduction of Cr(VI) to Cr(III) by different reducing agents, such as NaHSO3,
FeS, FeSO4, and SO2, followed by chemical precipitation of Cr(III) by lime as Cr(OH)3 has received a
dictated by stoichiometry [7, 8]. More recently, electrochemical reduction methods using iron electrodes has received much attention owing to their operational simplicity, and the lesser amounts and cost of chemicals consumed in such a process than in direct chemical reduction methods [9, 10].
In such an electrolysis process, iron anodes dissolve in the electrolyte solution producing Fe2+. Generated Fe2+ directly reduce present Cr(VI) to Cr(III) leading to the precipitation of Cr(OH)3 and
Fe(OH)3. A sedimentation or flotation process is usually necessary to separate the sludge from the
treated water. In such electrochemical process, no addition of chemicals is necessarily needed. Therefore, the maintenance and operation of the system is simple [11].
Previous investigations in the reduction of Cr(VI) to Cr(III) on iron ion surfaces in dilute solutions proved that the reduction reaction is diffusion controlled [12, 13]. It is therefore envisaged that the rate of reaction can be further increased by techniques that enhance the liquid-solid mass transfer by convection through induced solution circulation by mechanical agitation or gas sparging [14, 15, 16].
The aim of the present work is to investigate gas sparging as a mean to enhance the effectiveness of electrolytic removal of hexavalent-chromium from wastewater in a parallel plate electrochemical reactor. Gas sparging is widely used in many industrial applications employing gas– liquid contacting reactors. Typical examples can be found in oxidation, hydrogenation, and chlorination processes, wastewater treatments, and bioprocesses. Gas sparging columns or bubble columns have the advantages of being geometrically simple, free of moving parts and easy to manufacture. They provide superior gas–liquid interfacial mass and heat transfer, easy operation and cost effectiveness [14]. In 1975, Ibl et.al.[15] tested the effect of gas sparging on the rate of mass transfer in a parallel plate electrochemical reactor and concluded that gas sparging is an effective mean of liquid stirring that is cheaper than mechanical stirring. Gas sparging has been used since then to enhance the rate of liquid solid mass transfer at vertical plate electrodes [17], fixed bed electrodes [18], vertical fixed beds [19,20], and horizontal and vertical screens [21].
2. EXPERIMENTAL
2.1. Chemicals used
The following analytical grade reagents and chemicals were used in this study:
Potassium dichromate (K2Cr2O7) at different concentrations ranging from 0.01 to 0.02 M. Sulphuric acid and sodium hydroxide were used for solution pH adjustment.
Sodium chloride (NaCl) solutions at different concentrations, ranging from 1.5 to 7.5 (w/w)%, were used for depassivation of iron electrodes, and increasing solution conductivity.
Carbon tetrachloride was used for degreasing the electrodes.
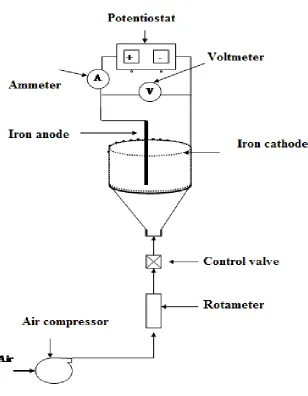
2.2 Setup and procedure
sintered glass attached to its bottom to maintain a uniform gas flow into the cell. A 0.5 hp air compressor was used to supply needed air to the bottom of the cell through the sintered glass. Gas flow rate was measured by a rotameter and was controlled by a one way check valve that also prevented solution from flowing downward. Two monopolar iron electrodes were placed vertically inside the glass cell. These were consisting of a 2-cm diameter anode placed at the center of the cell with 4.5 cm of its height submerged in solution, and a hollow 0.1 cm thick iron cylinder lining the inner wall of the cell as a cathode. Before each experimental run, these electrodes were first immersed in a dilute carbon tetrachloride solution for few minutes to remove any residual grease or surface oxides, and washed with distilled water, and finally placed in their proper place in the cell and connected to a Potentiostat (AUTOLAB PGSTAT 30). In each run, 200 ml of acidified potassium dichromate solution at various initial concentration ranging from 0.01 to 0.02 M were first placed in the cell along with sodium chloride at different concentrations ranging from 1.5 wt.% to 7.5 wt.%. Air at different flow rate ranging from 2.5 to 10 liter/ min was sparged into the solution, while a constant current was applied to the cell for a total period of 30 minutes. A current density ranging from 3.0 to 10 mA/cm2 was employed in these experiments. Cr(VI) concentration at the end of each experiment was determined by titrating a measured solution sample with a standard 0.1 N ferrous ammonium sulphate using diphenylamine barium salt as an indicator [22]. The percentage of Cr(VI) removed at the end of each experiment was then calculated as follows
% Cr(VI) removed = 100(Co-C)/Co
Where Co is the initial Cr(VI) concentration and C is the Cr(VI) concentration at the end of
electrolysis procedure. Cell and electrode potentials, and cell power consumption was monitored in each experiment to allow for evaluating cell performance and its economic viability at the different investigated operating conditions.
2.3 Scanning electronic microscope (SEM) and energy dispersive analysis EDX
Anodes subjected to tests conducted at different gas flow rates and different initial dichromate concentrations were further studied by SEM (JSM-6360LA, JEOL, Tokyo, Japan, using 20 kV accelerating voltage), and an energy dispersive analysis, EDX, (EX-23000BU attached unit).
3. RESULTS AND DISCUSSION
The main reactions taking place in the electrochemical cell are as follows [9, 10]: Anodic dissolution of iron takes place at the iron anode according to the reactions
Fe = Fe2+ + 2e− (1)
Cr6+ + 3Fe2+ = Cr3+ + 3Fe3+ (2)
At the cathode two simultaneous reactions take place, namely
2H2O + 2e− = H2 + 2OH− (3)
Cr6+ + 3e = Cr3+ (4)
Cr3+ + 3OH− = Cr(OH)3 (5)
The anodically formed Fe3+ combines with the cathodically formed OH- to produce insoluble Fe(OH)3
[image:4.596.152.460.341.737.2]Fe3+ + 3OH− = Fe(OH)3 (6)
It is also possible that some of the anodically formed Fe2+ ions are oxidized to Fe(OH)3 by the
sparged air. Since Fe(OH)3is known to be a strong adsorbent [10], it adsorbs Cr(VI) as well as Cr(III)
ions. Thus in such a gas sparged electrochemical reactor cell, hexavalent chromium is removed via (i) cathodic reduction (ii) reduction by the anodically formed Fe2+ and (iii) electrocoagulation where Cr(VI) and Cr(III) are adsorbed on Fe(OH)3 followed by air bubble flotation to the solution surface.
3.1. Effect of gas flow rate and current density on Cr(VI)removal
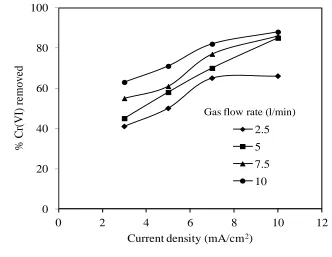
[image:5.596.133.465.323.580.2]Figure 2 shows the effect of current density on the percentage removal of Cr(VI) at different air superficial velocities. Data of figure 2 reveal that removal of Cr(VI) increases with increasing current density and air velocity, which is consistent with Faraday’s law according to which the rate of cathodic reduction of Cr(VI) as well as the rate of reduction by the anodically formed Fe2+ should increase with increasing current density.
Figure 2. % Cr(VI) removed vs. current density at different gas flow rate. Initial potassium dichromate solution concentration = 0.01 M, and NaCl concentration = 3.5 wt. %
The increase in Cr(VI) removal with increasing air superficial velocity is attributed to the fact that rising gas bubbles improve the mixing efficiency in the solution bulk by virtue of their ability to introduce micro and macro convection in the axial and radial direction [18]. The resulting good mixing conditions enhance the aforementioned reactions, thus leading to a faster Cr(VI) removal. Moreover, turbulence generated by the rising gas bubbles enhances the rate of mass transfer at the anode and cathode with a consequent decrease in concentration polarization which tends to slow down the rate of cathodic and anodic reactions and may lead to anode passivation especially at high current densities.
0 20 40 60 80 100
0 2 4 6 8 10 12
% Cr(V
I) re
m
ove
d
Current density (mA/cm2)
2.5
5
7.5
10
However it is observed that the beneficial effect of increasing air velocity diminishes at higher velocities; probably because vigorous stirring resulting at high air flow rate re-disperses the coagulated Fe(OH)3 with its adsorbed Cr(VI), Cr(III)ions. A similar effect was observed by other investigators
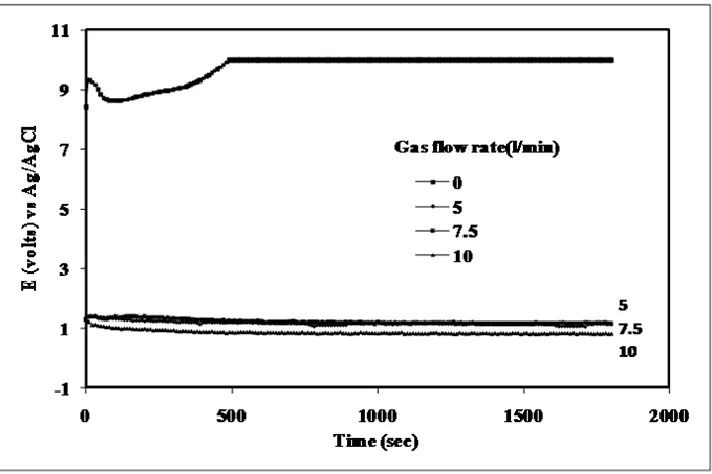
[image:6.596.122.478.235.472.2]who tested the effect of mechanical stirring on the rate of electrocoagulation [23]. The effect of gas sparging on the anodic potential at different gas flow rates is shown in figure 3. Results show that, depending on gas flow rate used, up to 90% reduction in the anodic potential can be achieved, which indicates that gas sparging can decreases the anodic over potential to a good extent, which in turn improves the electrochemical reactor performance.
Figure 3. Change of anodic potential with time at different gas flow rate. Initial potassium dichromate solution concentration = 0.01 M, and NaCl concentration = 3.5 wt. %
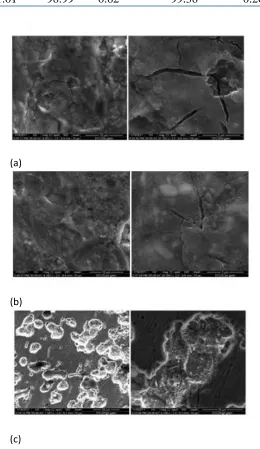
3.1.1. Effect of gas sparging on the anode surface morphology and composition
Table 1. Anode surface composition after subjected to different gas flow rate at 0.01 M initial concentration of potassium dichromate solution and 1.5 wt.% NaCl solution.
Surface location No gas flow Gas flow rate=5 l/min Gas flow rate=10 l/min
%Cr %Fe %Cr %Fe %Cr %Fe
Overall 2.63 97.37 1.68 98.32 1.48 98.52
001 6.96 93.04 3.91 96.09 0.35 99.65
[image:7.596.46.549.110.195.2]003 1.01 98.99 0.62 99.38 0.26 99.74
Figure 4. SEM images of anode surface at different gas flow rate (a) no gas flow, (b) gas flow rate = 5 l/min, and (c) gas flow rate= 10 l/min.
3.2. Effect of sodium chloride concentration
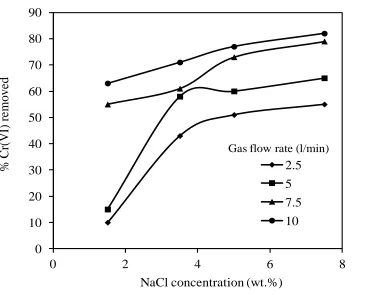
Figure 5 shows the effect of the NaCl electrolyte solution concentration on the removal of Cr(VI). Results shown in figure 5 reveal that at relatively low NaCl concentrations, removal of Cr(VI)
(a)
(b)
[image:7.596.164.424.187.636.2]
increases with increasing NaCl concentration. This increase, however, diminishes beyond a certain NaCl concentration.
Figure 5. % Cr(VI) removed vs.NaCl concentration at different gas flow rates, current density = 5 mA/cm2, and initial potassium dichromate solution concentration = 0.02M.
The beneficial effect of an initial increase of NaCl concentration on the Cr(VI)removal can be attributed to the role of Cl- ions in overcoming anode passivation that may take place at high current densities by virtue of the ability of Cl- to destroy the iron oxide film formed on the anode. A passive Fe anode would evolve oxygen instead of producing Fe2+ ions. On the other hand, the diminishing effect of NaCl concentration at higher concentrations may be explained by (i) a further increase in NaCl concentration results in an increase in the interionic attraction between Cl-1 and Fe2+. This would reduce the diffusivity of Fe2+ ions with a consequent decrease in their transfer from the anode surface to the solution bulk.
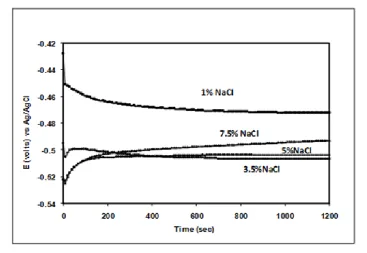
This in turn would increase ionic polarization and slow down anodic dissolution. This explanation is further supported by the data of figure 6, which shows that the anodic potential does increase by increasing NaCl concentration above 3.5%. (ii) Higher NaCl concentrations tend to increase the solubility of Fe(OH)3, which absorbs Cr(VI) and Cr(III) ions.
0 10 20 30 40 50 60 70 80 90
0 2 4 6 8
%
Cr(V
I) re
m
ove
d
NaCl concentration (wt.%) 2.5 5 7.5 10
[image:8.596.120.500.133.428.2]
Figure 6. Change of cell potential with time at different NaCl concentrations, current density = 5 mA/cm2, and initial potassium dichromate solution concentration= 0.02M.
3.3. Effect of initial Cr(VI)concentration
Figure 7 shows that the percent of Cr(VI) removed decreases with increasing the initial chromate concentration.
Figure 7. % Cr(VI) removed vs. initial potassium dichromate solution concentration at different gas flow rates, current density = 10 mA/cm2, and NaCl concentration = 1.5 wt.%.
20 30 40 50 60 70 80
0.005 0.01 0.015 0.02 0.025
2.5 5 7.5 10
Cr(VI)initial concentration (M)
Gas flow rate (l/min)
%
Cr(V
I) re
m
ove
[image:9.596.116.483.69.322.2] [image:9.596.116.467.468.710.2]
This is due to two factors: (i) under the present experimental conditions, available Fe(OH)3
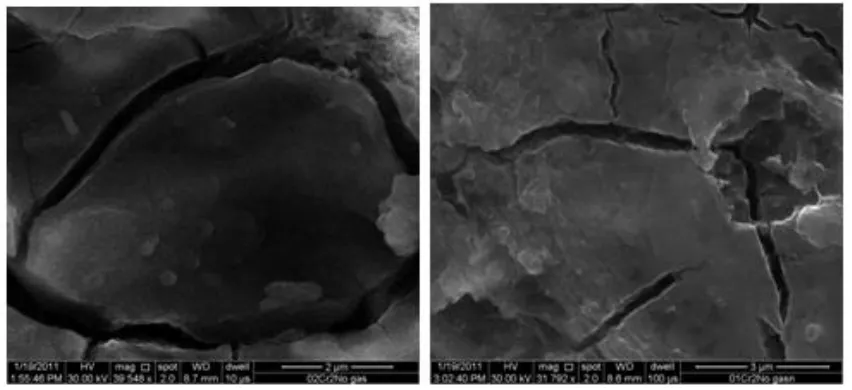
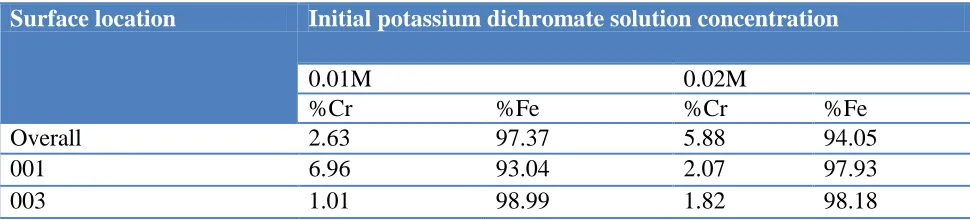
[image:10.596.207.425.245.441.2]coagulant is limited and their active surface area can become fully saturated with Cr(VI) and Cr(III) ions with no more active surface left to adsorb further chromium ions. (ii) It is also possible that higher Cr(VI) concentration tends to passivate the anode chemically. SEM and EDX analysis were used to verify this point. Figure 8 shows a sample SEM image and table 2 presents such EDX data, which reveal that increasing the initial Cr(VI) concentration lead to an increase in the concentration of chromium adsorbed on the anode iron surface. This is also reflected in the SEM image of figure 9, which shows a thicker deposited layer of chromium formed on the anode surface when using higher initial chromate solution concentration.
Figure 8. A sample of SEM image of anode surface at no gas flow rate, 0.01 M initial concentration of potassium dichromate solution, 5 mA/cm2 current density, and 1.5 wt. % NaCl solution.
[image:10.596.87.513.513.708.2]
Table 2. Anode surface composition after subjected to different initial concentration of potassium dichromate solution at 1.5 wt. % NaCl solution, and no gas flow.
Surface location Initial potassium dichromate solution concentration
0.01M 0.02M
%Cr %Fe %Cr %Fe
Overall 2.63 97.37 5.88 94.05
001 6.96 93.04 2.07 97.93
003 1.01 98.99 1.82 98.18
3.3. Electric power consumption
In order to asses the economic viability of the present technique, unit energy consumption per unit volume of waste solution, (Φ) in kW.h/m3
, was calculated under different conditions using the following equation [24]:
Φ = EIt/1000 V
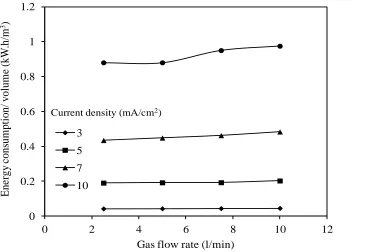
Where, E is the cell voltage in volt, I is the cell current in ampere, t is the time of electrocoagulation in hour, and V is the solution volume in m3. Figure 10 shows the effect of current density on the unit energy consumption at different air flow rate. Energy consumed per unit volume increases with current density owing to the increase in the cell voltage E which is given by
E= Eeq + ηc + ηa +IR
Where Eeq is the equilibrium cell voltage, ηc and ηa are polarization at the cathode and anode
respectively, and IR is the voltage drop due to the cell resistance R. The cell voltage increases with current density as a result of increasing activation polarization at the cathode and anode according to Tafel’s equation [25] and the increase in voltage drop due to cell resistance (IR). Figure 10 shows that gas sparging has a much lesser effect on cell energy consumption than current density.
Figure 11 shows the effect of gas sparging on both cell energy consumption and its percentage removal efficiency.
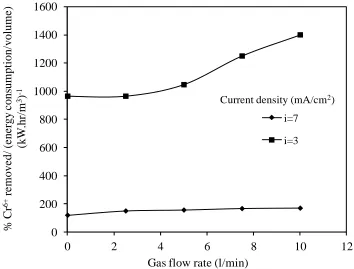
Results show that by changing the gas flow rate from zero to 10 l/min, an approximately 62% increase in Cr(VI) removal can be achieved for only a 12 % increase in cell enrgy consumption. An overall economic evaluation of the reactor performance measured by the ratio of percent of Cr(VI) removed to cell energy consumption versus sparging gas flow rate at different current densities is shown in figure 12.
[image:11.596.45.530.111.221.2]
improves the electrochemical cell productivity per unit energy consumed owing to the decrease in concentration polarization at the anode as a result of the turbulence induced by the gas bubbles.
Figure 10. Energy consumption vs. gas flow rate at different current densities, 0.01 M initial potassium dichromate solution concentration, and 1.5 wt.%. NaCl concentration
Figure 11. % Cr(VI) removed and energy consumed vs. gas flow rate at 0.01 M initial potassium dichromate solution concentration, and 1.5 wt.%. NaCl concentration
0 0.2 0.4 0.6 0.8 1 1.2
0 2 4 6 8 10 12
E ne rg y con sum pt ion / vo lum e (k W .h /m 3 )
Gas flow rate (l/min) 3
5
7
10
Current density (mA/cm2)
0 0.1 0.2 0.3 0.4 0.5 0.6 20 30 40 50 60 70 80 90 100
0 2.5 5 7.5 10 12.5
E ne rgy c ons um pt ion/ vol um e (K W .h/ m 3) % Cr(V I) re m ove d
Gas flow rate (l/min)
%removal
[image:12.596.119.487.135.387.2] [image:12.596.111.483.469.729.2]
Figure 12. % Cr(VI) removed per energy consumed vs. gas flow rate at two different current densities, .01 M initial potassium dichromate solution concentration, and 1.5 wt.%. NaCl concentration
4. CONCLUSIONS
Gas sparging was used in this study to improve the performance of a batch electrocoagulation reactor employing monopolar iron electrodes for Cr(VI) removal. The effect of several variables on the unit performance was investigated. Depending on gas flow rate used, gas sparging was found to improve the productivity of the unit by 40 to 50%. Moreover, Cr(VI) removal increases by increasing both current density and NaCl concentration, while it decreases by increasing the initial Cr(VI) concentrations. The electrode potential, on the other hand, is found to decrease by increasing gas flow rate, while the overall cell voltage increases. An economic analysis on the unit, based on percent of chromium removed per energy consumed, show that, at lower current densities, increasing the gas flow rate profoundly improves the percent of chromium removal per unit energy consumed. However, this effect diminishes at higher current densities at which the reactor economic performance, regardless of the sparging conditions, is drastically decreased. These results clearly show that gas sparging provides a simple, cheap, and practical method to greatly improve the performance of a batch electrocoagulation reactor and its economic viability.
ACKNOWLEDGMENT
This work was funded by the Deanship of Scientific Research of King Abdulaziz University, Jeddah, Saudi Arabia under grant No. (5-135-D1432).
0 200 400 600 800 1000 1200 1400 1600
0 2 4 6 8 10 12
% Cr 6 +re m ove d/ (e ne rgy cons um pt ion/ vol um e) (kW .hr/ m 3) -1
Gas flow rate (l/min)
i=7
i=3
[image:13.596.112.466.81.350.2]
References
1. V.K. Gupta, M. Gupta, S. Sharma, Water Res. 35 (5) (2001) 1125-1134. 2. M. Ajmal, R.A.K. Rao, B.A. Siddiqui, Water Res. 30 (6) (1996) 1478-1482. 3. C. Namasivayam, R.T. Yamuna, Chemosphere 30(1995)561-578.
4. K. Muthukumaran, N. Balasubramanian and T.V. Ramakrishna, Met Finish, 93 (1995) 11-21 5. Control and Treatment Technology for the Metal Finishing Industry, US, EPA, (1980). 6. Y. Hisamatsu and Y. Kitajima, J. Metal Finish. Soc. Japan, 19 (1968) 466-477.
7. F. Sevim and D. Demir, Chem. Eng. J.143 (2008) 161–166.
8. D.W. Blowes, C.J. Ptacek, S.G. Benner, C.W.T. McRae, T.A. Bennett, R.W. Puls, J. Contam. Hydrol. 45 (2000) 123–137.
9. N.Kongsricharoern,C.Polprasert, Water Sci. Technol. 34(9)(1996)109. 10. I. Heidmann and W. Calmanoa, Sep. and Purif. Tech., 61(2008)15-21
11. F. Shen, X. Chen, P. Gao and G. Chen, Chem. Eng. Sci., 58(3-6) (2003)987-993. 12. A.H. El-Shazly, A.A. Mubarak and A.H. Konsowa, Desalination 85(2005)307 -316. 13. A.H. El-Shazly, Bulg. Chem. Comm.,42(1)(2010)55-61.
14. L. Guang, Y. Xiaogang and D. Gance, Chem. Eng. Sci. 64(2009) 5104 – 5116. 15. N. Ibl, R. Kind and E. Adam, An Quim, 71(1975)1008-1016.
16. Daous, M., S. Nosier, and K. AlGhamdi, Chem Eng Res Des (2011), doi: 10.1016/j.cherd.2011.09.006
17. L. Sigrist, O. Dessenbach and N. Ibl, J. Appl. Electrochem. 22(1979) 1393-1403.
18. G.H. Sedahmed, M.S. Abdo, M.A. Kamal, O.A. Fadaly, and H.M. Osman, Chem. Eng. Proc., 40(3)(2001)195-200.
19. S.A. Nosier, A. El-Kayar, H.A. Farag and G.H. Sedahmed, Int. commun. Heat Mass Transfer, 24(5) (1997)733-740.
20. M.A. Zarraa, M.Z. El-Abd, Y.A. Eltawil, H.A. Farag and G.H. Sedahmed, Chem. Eng. J. and Biochem. Eng. J. 54(1) (1994)51-56.
21. M.M. Zaki, I. Nirdosh and G.H. Sedahmed, Chem. Eng. Comm. 186(1) (2001)43-56.
22. A.L. Vogel, A Text-Book of Quantitative Inorganic Analysis, 3rd edition , Longman, London, 1975. 23. M.M Emamjomeh and M. Sivakumar, J. Environ. Manag. 90(2009) 1663–1679
24. P. Gao, X. Chen, F. Shen and G. Chen, Sep. Purif. Tech. 43(2005)117–123. 25. M.G. Fontana, Corrosion Engineering, 3rd ed., McGraw Hill,1986.