Int. J. Electrochem. Sci., 11 (2016) 7031 – 7047, doi: 10.20964/2016.08.37
International Journal of
ELECTROCHEMICAL
SCIENCE
www.electrochemsci.org
Corrosion Process of Ductile Iron with Cement Mortar Linings
as Coatings in Reclaimed Water
Yarong Song1, Yimei Tian1,2, Xin Zhao1,2,*, Hao Guo1, Haiya Zhang2 1
School of Environmental Science and Engineering, Tianjin University, Tianjin 300350, China 2
Tianjin Engineering Center of Urban River Eco-Purification Technology, Tianjin 300350, China *
E-mail: xinzhao@tju.edu.cn
Received: 7 May 2016 / Accepted: 4 June 2016 / Published: 7 July 2016
Corrosion of ductile iron with cement mortar linings (CML) exposed to reclaimed water within one year was monitored by electrochemical impedance spectroscopy (EIS), potentio-dynamic polarization (PDP), scanning electron microscopy (SEM) and energy dispersive spectroscopy (EDS). The results differentiated two corrosion phases: (a) passivation and (b) initiation and propagation of corrosion. Based on the CML and CML/iron interface behavior with measured electrical properties, the study highlighted the capacitance features of CML and the growth of passive film at the interface. The CML durability was evaluated which performed well during passivation and corrosion initiation, but degraded as exposure time increased. Also, the electrochemical methods were demonstrated qualified for corrosion monitoring of lined iron pipes by non-destructive techniques.
Keywords: Corrosion; Ductile iron; Cement mortar linings; Reclaimed water; EIS
1. INTRODUCTION
The reclamation of wastewater has been economically and environmentally justified to alleviate the crisis of water resource [1-3]. The reclaimed water consumption has multiplied worldwide, accompanied with the substantial increase in reclaimed water pipelines [4]. In these distribution systems, ductile iron pipes with cement mortar linings (CML) are most commonly used [5]. The CML used as coatings can protect iron pipes against corrosion for several years, mainly owing to the alkaline environment provided by the CML hydration, the limited oxygen diffusion due to this protective layer and the resistance property to inhibit corrosion current [6,7].
quality [8,9]. Compared to potable water, one problem facing reclaimed water is its complexity [2]. On the other hand, cement mortar is a unique composite material that is porous and highly heterogeneous. Corrosive agents, like chloride and sulfate in aqueous solutions, may penetrate through pore spaces in cement mortars, leading to the formation of crystal compounds [10-12]. The growth of compounds enhances the pressure of the pores, thus creating micro-cracking of the matrix. This drawback also affects the quality of the CML/iron interface, inducing the damage of the passive film and corrosion of the ductile iron. Furthermore, the accumulation of corrosion products near the iron can also build up stresses and result in cracking of the CML, which in turn facilitates the ingress of corrosive agents and accelerates the corrosion of iron.
Under this circumstance, the protective efficiency of CML and durability of iron pipes are difficult to evaluate [13-15]. Traditional diagnosis of the sustainability of water pipelines is inconvenient which involves destructive tests to extract pipe samples for laboratory analysis [16]. Besides, most of these tests focused on corrosion in old iron pipes of which the CML barely existed [17-19], but overlooked the corrosion behavior of newly-established iron pipes coated with CML which are widely on service. So in this study, we intend to introduce the non-destructive corrosion testing methods, i.e. electrochemical techniques, for corrosion monitoring of lined iron pipes.
At present, electrochemical methods including potentio-dynamic polarization (PDP) and electrochemical impedance spectroscopy (EIS) have been widely applied to characterize properties and even corrosion rates of mortar-metal systems, such as reinforced concrete structures [20-24]. Keddam et al. [25] proposed one of the first relevant theories to study the degradation behavior of the cement paste by EIS measurements, which validated the possibility of using EIS to analyze cementitious materials. Ford et al. [26] investigated the corrosion behavior of cement-paste/steel system in simulated solution, dividing the impedance spectra into three regions related to different frequencies. The concrete resistance, the passive oxide film present on the steel surface and the corrosion products were analyzed respectively [10,27]. Serdar et al. [28] characterized the resistance properties of the mortar, the bar-mortar interface related to the passive film and the charge transfer resistance. In these studies, the resistance property of cementitious materials was most commonly illustrated, but their capacitance due to interfacial microstructures in the matrix was usually neglected. Moreover, the growth and degradation processes of the passive film formed on the mortar-metal interface were not fully understood in previous investigations.
Despite the broad use of electrochemical methods for characterizing the properties of cementitious materials and steel corrosion, little research has been conducted regarding to EIS application to the corrosion behavior of ductile iron with CML, which in structure are analogous to reinforced concrete but still different to some extent. Compared with reinforced concrete, the CML-iron pipes consist of ductile CML-iron rather than stainless steel, and the cement mortar layer is much thinner than the concrete matrix which also contains more aggregates [24].
CML and introducing the electrochemical techniques for non-destructive corrosion monitoring of lined iron pipes.
2. MATERIALS AND METHODS
2.1. Preparation of specimens
To simulate ductile iron pipes lined with CML, the specimens were set up using the standard ductile iron sheets [29] covered with CML on one sides. These linings were manually coated according to the coating standard [24], and in the same manner that assured the reproducibility. In addition, the tested samples were selected before experiments to guarantee the equally dense and flat CML layers with identical thickness and without crevices. The other side of each specimen was sealed with epoxy resin during the submergence period. Prior to the experiments, this side without CML was rid of the epoxy resin and abraded sequentially using a series of waterproof abrasive papers of 500, 800, 1000, and 1200 grit. The dimensions for each specimen were length × width × thickness = (50.0±0.1) mm × (25.0±0.1) mm × (2.0±0.1) mm [29]. The composition of ductile iron was 2.7% C, 2.0% Si, 0.4% Mn, <0.06%S, <0.08% P and Fe balance.
Mortar was prepared using Ordinary Portland Cement (OPC, 42.5 N) without aggregates or mineral admixture. The chemical composition (wt%) of the OPC is as follows: CaO 63.9 %; SiO2 20.6 %; Al2O3 5.01 %; Fe2O3 3.25 %; SO3 2.68 %; K2O 0.65 %; Na2O 0.3 %. To accelerate the corrosion process during a reasonable time, the high water/cement ratio and the limited thickness were designed to produce low quality CML [28,30]. The water/cement ratio of the mortar was 0.6, while it has been stated that a good quality cementitious material can obtain a water/cement ratio of about 0.4 [10]. The samples used here are nearly 2 times higher in capillarity porosity volume fraction than that of good quality material after the curing period [10]. The thickness of the CML was 2mm, which was the minimum value of linings thickness (2-12mm) in ductile iron pipes [24]. According to the coating standard [24], the mentioned experiment scheme not only reproduced one of the practical conditions: light, porous, thin coatings for small diameter pipes or pipe fittings, but also ensured that corrosion would naturally occur during a reasonable time of exposure. All samples were cured in a humidity chamber (humidity 95% RH, temperature 20±2℃) for 28 days.
2.2. Submerged experiments
[image:4.596.157.437.569.726.2]
The reclaimed water sample was obtained from a water reclamation plant in northern China (Table 1). The main technological processes of the plant were coagulation and sedimentation, CMF (continuous micro-filtration) and RO (reverse osmosis). No significant changes occurred in the reclaimed water quality during the entire experiment, and the corrosive agents including chloride and sulfate were all in normal level [11]. All of the submerged experiments were carried in the same steady room temperature 20 ℃.
Table 1. Characteristics of the reclaimed water sample.
Parameters Value Parameters Value
pH 6.8 Total hardness
(mgCaCO3/L) 241.5
Turbidity (NTU) 0.24 Total dissolve solids (mg/L) 866 Total alkalinity
(mgCaCO3/L) 77.1 Chloride (mg/L) 211.4
NH3-N (mg/L) 5.00 Sulfate (mg/L) 135.2
2.3. Electrochemical measurements
Electrochemical measurements were performed using a CS350 electrochemical working station (KeSiTe, China) as previously utilized [2,8]. Specimens after a reasonable time of exposure were rid of the epoxy resin and connected to the advanced three-electrode glass corrosion cell shown in Fig.1. The cell had a working hole on the surface, of which the circular surface was 1cm in diameter. Then the center area of CML in each specimen was targeted at the working hole, so a fixed area of 0.785 cm2 was exposed to water as the working area. Meanwhile, the iron side was connected to the conductive metal bar to complete the current path. These procedures were innovatively established in the laboratory and have been granted a patent [31], conferring credibility and representativeness to the results obtained.
Prior to each measurement, the working electrode was immersed in the reclaimed water for 50 min to reach a steady open circuit potential (Eoc). All potential values were referred to the saturated calomel reference electrode (SCE) in this study. In this experiment, EIS measurements were performed in the frequency range between 0.01Hz and 100 kHz. Zview2.0 was used to collect the EIS data. The scan of the polarization was over a range of -150 to 150 mV versus the Eoc at the scan rate of 1 mV/s. Cview2.0 was utilized to analyze the potentio-dynamic polarization curve data, and the Tafel region data were analyzed with extrapolation method. Each experiment was repeated several times under the same conditions to guarantee the reproducibility.
2.4. Surface analysis
The surface morphology of specimens in micro-level was examined by the S4800 field emission scanning electron microscopy (Hitachi Company, Japan), which was equipped with the Genesis XM2 Electron Energy Disperse Spectroscopy (EDAX Company, USA). Visual analysis was also confirmed by photographs to depict the macro-level corrosion morphology.
3. RESULTS AND DISCUSSION
3.1. Electrochemical impedance spectroscopy
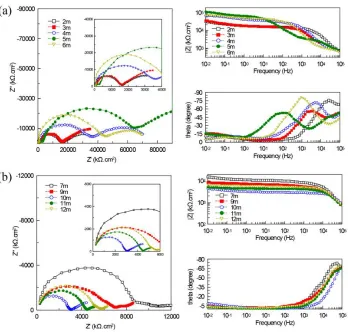
To characterize the corrosion behavior of ductile iron coated with CML, EIS measurements were conducted after different times of exposure to the reclaimed water. Six representative sets of EIS spectra are presented in Fig.2-3, and the data for parallel samples that are not showed here behaved similarly.
Previous studies demonstrated that evaluations of certain domains from EIS spectra could be correlated to electrochemical properties of different physical structures [26-28]. In this study, the correspondence in high frequencies (higher than 102 Hz) described the electrical behavior of the CML, while plots in low frequencies (between 10-2Hz and 102 Hz) represented the capacitive behavior at the CML/iron interface and its resistance to the charge-transfer process. According to the EIS spectra in Fig.2-3, electrochemical behavior of the ductile iron with CML could be differentiated into two phases
:(a) passivation phase characterized by the transformation of the passive film and the enhancement of interfacial resistances, and (b) initiation of localized corrosion and corrosion propagation distinguished by the increase of interfacial capacitance and decrease of interfacial resistances. This was in agreement with the conclusion that corrosion of steels embedded in mortar during the two-year exposure was divided into the passive phase and the pitting initiation phase [28].
3.1.1. Analysis of EIS spectra during passivation process
this oxide layer is not analyzed in detail, since its structure is very complex and its status can change with the applied circumstances. Immersion time also exerts influence on its evolution [10].
Fig.2 shows EIS spectra obtained for specimens during the exposure of nearly one month. Fig.2a shows the initial exposure period characterized by the simultaneous appearance of two time constants. In Nyquist plots, the first capacitive loop in high frequencies was related to the CML, which were heterogeneous with air voids and macro pores dispersed inside. Once submerged, the air voids would be occupied by water, consequently leading to the formation of electrical double layers (EDL) and the appearance of capacitive loops [6]. However, most previous studies just focused on the resistance properties of the cementitious materials, but neglected their capacitance features [28]. In low frequencies, bigger capacitive loops illustrated that water penetrated directly through the CML and formed another EDL on the iron surface. The impedance diagrams obtained in the spectra were not perfect semicircles due to the inhomogeneities of the interfacial structures. Thus the constant-phase element (CPE) was introduced instead of a pure capacitance (C) to enable a more accurate fit [33]. The impedance of CPE could be calculated using the Eq.(1) [28]. The exponent n was intended to discriminate the deviation of CPE from pure capacitance. With an increase in capacitance dispersion, n decreased.
= (1)
After several days of exposure, the EIS spectra changed from two capacitive loops to three, due to the division of the second loops which represented the capacitive parameters of the CML/iron interface (Fig.2b). The new phenomenon of passivation at the interface generated the new time constant. Previous EIS studies have verified that the spectra of passive stainless steels is formed by two, very overlapped, time constants [10,28]. However, the existence of two overlapped time constants in low frequencies was not always evident, and the thin passive film made it hard to distinguish between the properties of the interface and the passive film itself. In addition, the elevation of Bode plots in low frequencies showed that the impedance of the interface increased evidently, probably ascribed to the formation of the passive film that enhanced the surface roughness and the resistance to corrosion [32]. As the film developed intensely covering most of the iron surface, the capacitive loops in the middle started to coalesce with the third loops to form larger ones (Fig.2c) which expanded immensely. This change indicated the increasing corrosion resistance of the iron surface controlled by the properties of the passive film. In high frequencies, the peak of the 15-day specimen in Bode plot stared to transfer to lower frequencies, which was possibly due to the hydration process that induced the changes in CML structure.
[image:7.596.130.460.76.701.2]
3.1.2. Analysis of EIS spectra during the initiation and propagation of corrosion
Compared to the diagrams during the passivation phase, the spectra obtained since the corrosion initiation were relatively compendious. In Fig.3, the diagrams are distinguished by the decreased number of capacitive loops and the appearance of the diffusion impedance. Although Nyquist plots in Fig.3a are still composed of two capacitive loops, the loops in low frequencies were no longer much larger than those in high frequencies, and the corresponding phase angles in Bode plots gradually decreased towards 0°. These responses may be an indicator of the decreasing resistance and the inhomogeneity of the CML/iron interface, possibly due to the initiated defects on the passive film. In this period, the protective properties of the passive film probably became weaker and the localized corrosion began. This was in agreement with the inference that the passive film cannot be considered as a homogeneous layer but rather as a defective layer with exposure time increasing [32]. In high frequencies, diameters of capacitive loops increased rapidly and culminated in the 5th month, indicating high resistance of the CML. The correlated time constants gradually transferred to lower frequencies and showed obvious oscillation, probably due to the unsteady state of CML. In this period, ductile iron sheets were still under efficient protection by CML although the localized corrosion appeared.
[image:8.596.122.470.378.710.2]
The impedance responses for specimens exposed to reclaimed water for seven to twelve months are characterized by one set of capacitive loops and the following short diffusional tails (Fig.3b). The shrinking capacitive loops, typical for active corrosion state, indicated the decreased resistance of the cement bulk [25]. This sudden change for the mortars could be possibly denoted to the subsequent crack initiation and propagation [15]. It has been assumed that the accumulation of the hydration and corrosion products in the pore spaces can result in cracking or spalling of the concrete, which in turn facilitates the ingress of corrosive agents and accelerates the iron corrosion [10-12]. In low frequencies, the diffusional tails indicated that the charge diffusion process had dominated on the iron surface, probably caused by the denser and thicker layer of corrosion products accumulated there. This speculation will be further confirmed by the visual analysis later. In this period, the CML failed to protect the underlying iron gradually.
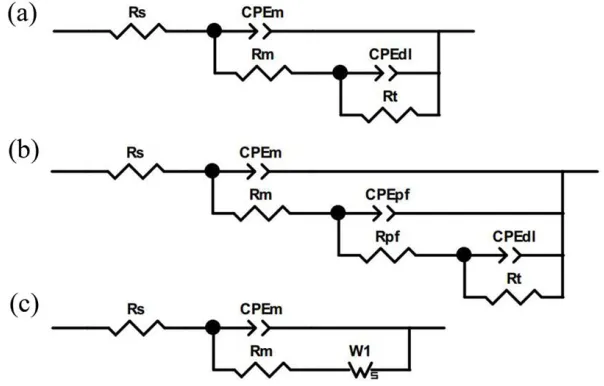
3.2. Analysis of equivalent electrical circuits
To characterize the electrochemical parameters of different physical structures in the CML-iron system, an adequate fitting is achieved using three equivalent electrical circuits (Fig.4). Fig.4a was used for the spectra in Fig.2a,d and Fig.3a when two capacitive loops appeared in the Nyquist plots. This two-time constant circuit has been demonstrated valid to simulate the electrochemical behavior of passive and active iron materials in solution and in mortar [10,11,34,35]. Fig.4b presented a three-time constant model to characterize the growth of the passive film, which is innovative and complementary to the previous investigation [6]. Fig.4c was correlated to the spectra in Fig.3b which contained the Warburg impedance. The representative fitting results are presented in Table 2, and the fitting accuracy is illustrated with experimental values in symbols and fitted values in lines in Fig.1-2 (fitting error was under 10% for all obtained parameters).
[image:9.596.144.446.503.696.2]
During the analysis, Rs is regarded as the solution resistance between the WE and the SCE. The resistive behavior obtained at high frequencies in the EIS spectra corresponds to the mortar resistance Rm. The related CPEm represents the non-ideal capacitance of double layers in the cement bulk including interfacial zones of the pore networks [6]. Rpf and CPEpf are identified with electrochemical characteristics of the passive film on the CML/iron interface, as other EIS studies of stainless steel in alkaline solutions [16] and in mortar [10] have previously done. In low frequencies, Rt and CPEdl are used to evaluate the resistance of the charge transfer process and the interfacial capacitance of the CML/iron respectively. The diffusion impedance is generally introduced as W1。
[image:10.596.27.572.482.687.2]Rm is a significant parameter that could influence the corrosion rate of iron materials, as the cementitious mortars are electrolytes with moderate conductivity. As shown in Table 2, the Rm values increased slowly from the beginning of the exposure, possibly attributable to the chemical process of the cement that was not completely hydrated after the curing period [10]. Since the first month of exposure, the Rm values increased evidently and culminated in the 5th month due to the continuously reduced porosity in the CML. However, it decreased since then, possibly due to the invasion of chloride ions or other corrosive agents in the reclaimed water. Similar trends have been observed in low-quality mortars, that Rm increases due to the curing during the first 3 months, and then decreases due to the chloride penetration [28]. After 7 months of exposure, the mortar resistance decreased sharply indicating the crack initiation of the CML. Since then, crevices appeared (Fig.7 e-j), illustrating the poor condition of the CML. In conclusion, it was supposed that the protection efficiency of the CML was favorable during the passivation phase, but continuously became weaker after the corrosion propagated.
Table 2. Electrochemical impedance parameters for specimens after different exposure times.
Exposure time
Rm (kΩ cm2
)
CPEm-T (μFcm-2sn-1)
CPEm-P Rt
(kΩ cm2 )
CPEdl-T (μFcm-2
sn-1)
CPEdl-P Rpf (kΩ cm2
)
CPEpf-T (μFcm-2
sn-1)
CPEpf-P
1d 2.588 0.00499 0.93793 3.554 91.10 0.69772
3d 3.035 0.00675 0.91576 5.875 99.48 0.73261
5d 4.549 0.00980 0.89062 8.688 115.83 0.79636 15.558 34.12 0.87271
10d 6.275 0.01280 0.86812 30.214 170.00 0.80366 14.871 29.38 0.88479
13d 7.572 0.11862 0.90189 60.249 219.54 0.63702 19.123 25.12 0.80668
15d 9.209 0.13805 0.86664 179.620 190.12 0.88829 20.287 17.98 0.85299
17d 11.321 0.07901 0.79541 153.820 176.54 0.79123
20d 11.814 0.04434 0.71234 140.530 147.94 0.83234
25d 12.700 0.01937 0.82881 142.710 130.00 0.90125
1m 14.347 0.01407 0.91174 142.930 111.65 0.88378
3m 30.232 0.00663 0.89486 110.827 90.27 0.89398
5m 60.996 0.00722 0.86904 130.880 75.74 0.62162
6m 50.107 0.01074 0.88796 71.306 105.47 0.54641
7m 35.907 0.01048 0.89486
9m 10.099 0.01248 0.94251
12m 2.847 0.01345 0.94435
been widely applied to the cementitious materials [10], it makes the analysis of the CPEm inevitable. In this study, CPEm increased from the beginning of the exposure, indicating that water penetrated into the porous structure of the CML, and the accumulation of charges through water made it exhibit electrochemical properties. Nevertheless, the CPEm values were significantly smaller than the CPEdl values, possibly due to the insulating traits of the material caused by its restricted storage of charges [6]. During the corrosion initiation phase, the CPEm decreased a little probably owing to the intense hydration and the creation of less porous cement matrix during aging. However, it increased from the 6th month together with the decline of the CML resistance, probably indicating that the protective efficiency of CML started to fail.
During the passivation phase, the evolution of Rt showed higher values with the immersion time
increased, revealing an enhancement of the resistance on the CML/iron interface controlled by the growth of the passive film. This trend has already been demonstrated in previous tests [10]. In this study, the parameters of the passive film were specially analyzed when three capacitive loops were present in the EIS spectra. After that, the chemical composition and structure of this thin film could reach an equilibrium, which made it hard to distinguish between the properties of the interface and the passive film itself. In comparison, the Rt values were significantly higher than Rm and Rpl in this study, which was consistent with the research for passive stainless steels in mortar [28]. That is to say, the charge transfer is the rate-limiting step for the passive ductile iron. In addition, the interfacial capacitance of the CML/iron in this period also increased to some extent, probably due to the growth of the passive film that instigated an enhancement of the surface area at which the double layer formed. Since the 6th month, a significant decrease of the Rt values accompanied with the increase of
CPEdl values were observed, which might be an indicator of the corrosion propagation [10]. It was supposed that a great sum of corrosion products accumulate on the iron surface (Fig.7 g,i,j), inducing difficulty in the charge transfer process during this period. Consequently, the Warburg impedance defined as W1was introduced to depict the diffusion impedance, but it was not analyzed in detail.
3.3. Polarization curves
As shown in Fig.5, the potentiodynamic polarization behavior of each specimen was tested after the EIS measurements to avoid being polarized in advance. To obtain the electrochemical kinetics parameters, the cathodic and anodic current–potential curves were extrapolated to their intersection points where we could acquire the corrosion potential (Ecorr) and corrosion current density (icorr). In addition, the anodic and cathodic Tafel slopes (ba, bc) are also presented in Table 3.
and corrosion initiation phases. From the 6th month, Ecorr changed towards more negative values. A review study of reinforcing concrete structures has supposed that the potential values less than -426 mVSCE are typical of a severe corrosion attack [36]. This active corrosion state was also demonstrated by the relatively high values of icorr in Fig.6. From the 8th month, the rather negative values of Ecorr (-0.7 mVSCE) together with the increasing icorr values indicated the propagation of corrosion process.
Regarding Tafel slopes, it showed that the change of anodic (ba) and cathodic (bc) slopes correlated well with the analysis above. The anodic slopes were generally bigger than the cathodic slopes, which demonstrated that the anodic reactions confronted relatively more resistance. In addition, most of ba and bc values decreased as the exposure time prolonged, possibly indicating the declined corrosion resistance of both anodic and cathodic reactions. Also, the potentiodynamic polarization behaviors were further checked by the visual analysis shown later.
[image:12.596.137.463.287.538.2]Figure 5. Polarization curves for specimens after different times of exposure to reclaimed water (experimental values given in dots, fitted in lines).
Table 3.Tafel slopes obtained from the polarisation curves of different exposure times. Exposure time
(months) 1 3 5 7 9 12
ba (mV dec−1)
720.45 536.35 633.62 480.74 413.08 391.74
bc (mV dec−1)
[image:12.596.41.554.635.732.2]
Figure 6. A change of the corrosion potential (Ecorr) and corrosion current density (icorr) for specimens after different times of exposure to reclaimed water.
3.4. Surface analysis
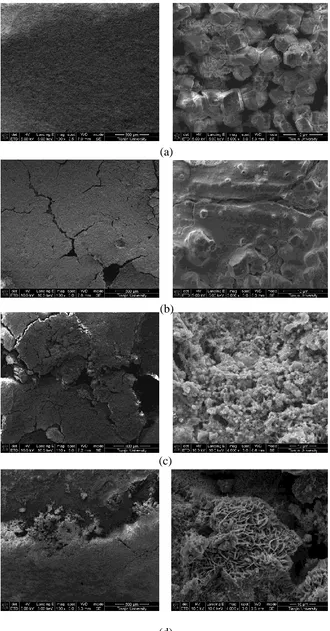
[image:13.596.110.486.390.673.2]
Figure 8. SEM images of specimens after different times of exposure to reclaimed water. (a): 1month; (b): 5months; (c): 10months; (d): 12months.
(a)
(b)
(c)
[image:15.596.73.523.226.352.2]
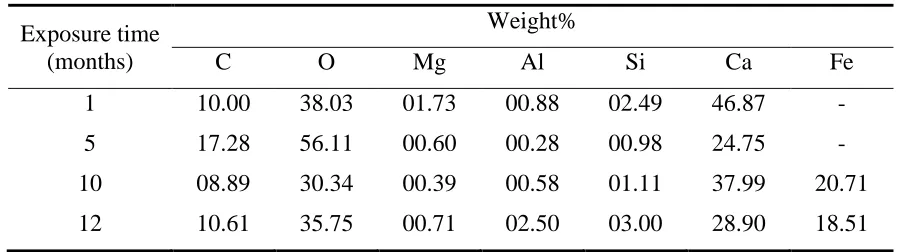
Results obtained by electrochemical techniques were confirmed by the analysis of surface morphology in both of macro- and micro-level. Photographs were taken as soon as the samples were picked out from water (Fig.7), and the corresponding SEM images are shown in Fig.8. Also, EDS was used to obtain the elemental composition of the specimen surfaces (Table 4) which were covered by the complete or broken CML. Equal experimental procedures were used for all specimens and investigated locations.
Table 4. Elemental composition ratio of specimen surfaces after different exposure times.
Exposure time (months)
Weight%
C O Mg Al Si Ca Fe
1 10.00 38.03 01.73 00.88 02.49 46.87 -
5 17.28 56.11 00.60 00.28 00.98 24.75 -
10 08.89 30.34 00.39 00.58 01.11 37.99 20.71
12 10.61 35.75 00.71 02.50 03.00 28.90 18.51
During passivation, most of the CML surfaces were flat and dense (Fig.7a, Fig.8a), probably indicating the intact state and protective efficiency of the layer. Images at lager magnification (Fig.8e) showed that calcium carbonate characterized by the regular cubic figure [14] was probably the main composite of CML during the passivation period, which was also validated by the EDS results. After the first month of exposure, the relative calcium content amounting to 46.87 wt%, oxygen content to 38 wt% and carbon content to 10 wt% are major constituents of the CML. This relative calcium content was nearly equal to the original calcium ratio of 45.64 wt% in the OPC, which confirmed the relatively complete condition of the CML. However, since the fifth month, visible holes started to exist on the CML surface (Fig.7c, Fig.8b), consistent with the electrochemical analysis that the CML started to degrade since then. The CML degradation induced the losing of calcium, resulting as the decline of calcium content to 24.75 wt%. After 6 months, some of the iron corroded initially with corrosion pits formed and grouped beneath the localized CML (Fig7d), which demonstrated that the corrosion initiated as the exposure time increased.
continuous decrease of the calcium content demonstrated the failure process of the cement layers. During this period, the CML failed completely to prevent the iron from corrosion.
4. CONCLUSIONS
This study analyzed the corrosion process of ductile iron with CML that had been exposed to reclaimed water during a period of one year. A combination of techniques, i.e. electrochemical impedance spectroscopy (EIS), potentio-dynamic polarisation (PDP), scanning electron microscopy (SEM) and energy dispersive spectroscopy (EDS) was performed to diagnose the sustainability of the CML-iron system. The results presented in this study allow us to draw the following conclusions:
1. EIS and PDP results enabled the differentiation of two corrosion phases of the CML-iron system: (a) passivation (within 1 month) characterized by the transformation of passive film and enhancement of interfacial resistances, and (b) initiation and propagation of corrosion (2-12 months) distinguished by the increase of interfacial capacitance and decrease of interfacial resistance.
2. Three suitable equivalent electrical circuits to model different corrosion behavior were systematically established, and the three-time constant circuit was specially intended for the passive film growth. The evolution of impedance spectra within the first month elucidated the development of the passive film: before passivation, growth of passive-film and steady passive phase. As the exposure time increased, the decreasing resistance of the CML/iron interface demonstrated the defects appearance on the passive film.
3. The CML exhibited not only resistance properties but also capacitance properties. These coatings performed well during passivation and even after the corrosion initiation within 5 months of exposure, but failed in corrosion protection as exposure time increased. The CML failure process and the aggravating corrosion state were also demonstrated by the morphology analysis and the elemental composition results.
4. The non-destructive electrochemical methods were validated efficient for corrosion monitoring of iron pipes coated with CML, which provided theoretical supports for assessing the protective efficiency of CML and deciding the certain state of ductile iron pipes. However, further studies should be accomplished on real ductile iron reclaimed water pipes with actual CML to supplement the theory.
ACKNOWLEDGEMENT
This research was supported by National Natural Science Foundation of China (No. 51478307) and Specialized Research Fund for the Doctoral Program of Higher Education of China (No. 20130032110032).
References
1. L. L. Yi, W. T. Jiao, X. N. Chen and W. P. Chen, J Environ Sci-China, 23 (2011) 1585. 2. H. Y. Zhang, Y. M. Tian, J. M Wan and P. Zhao, Appl Surf Sci, 357(2015) 236.
3. M. J. Wiener, C. T. Jafvert and L. F. Nies, Sci Total Environ, 539(2016) 70.
4. F. Pedrero, I. Kalavrouziotis, J. J. Alarcón, P. Koukoulakis and T. Asano, Agr Water Manage, 97 (2010) 1233.
6. D. A. Koleva, K. van Breugel, J. H. W. de Wit, E. van Westing, O. Copuroglu, L. P. Veleva and A.L.A. Fraaij, Mater Charact, 59(2008) 290.
7. J. Z. Gong, M. L. Stephens, N. S. Arbon, A. C. Zecchin, M. F. Lambert and A. R. Simpson, Struct Health Monit, 14 (2015) 426.
8. W. N. Su, Y. M. Tian and S. Peng, Appl Surf Sci, 315(2014) 95.
9. G. H. Yue, L. M. Shang, L. P. Wang and L. L. Feng, Adv Mater Res, 393-395(2012) 1554. 10. A. Bautista, E. C. Paredes, F. Velasco and S. M. Alvarez, Constr Build Mater, 93(2015) 350. 11. M. O. G. P. Bragança, K. F. Portella, M. M. Bonato and C. E. B. Marino, Constr Build Mater, 68
(2014)650.
12. P. Feng, E. J. Garboczi, C. W. Miao, J. W. Bullard, Constr Build Mater, 96(2015) 391. 13. I. Arribas, I. Vegas, J. T. San-José and J. M. Manso, Mater Design, 63(2014) 168. 14. C. J. Tsai, R. Huang, W. T. Lin and H. N. Wang, Mater Design, 60(2014) 267. 15. X. M. Shi, N. Xie, K. Fortune and J. Gong, Constr Build Mater, 30(2012) 125.
16. M. C. Garcia-Alonso, M. L. Escudero, J. M. Miranda, M. I. Vega, F. Capilla, M. J. Correia, M. Salta,
A. Bennani and J. A. Gonza ´lez, Cem Concr Res, 37 (2007)146.
17. C. Y. Peng, G. V. Korshin, R. L. Valentine, A. S. Hill, M. J. Friedman and S. H Reiber, Water Res, 44 (2010)4570.
18. J. Nawrocki, U. Raczyk-Stanisławiak, J. Świetlik, A. Olejnik and M. J. Sroka, Water Res, 44(2010) 1863.
19. F. Yang, B. Y. Shi, J. N. Gu, D. S. Wang and M. Yang, Water Res, 46 (2012)5423. 20. D. A. Koleva, A. G. Denkova, N. Boshkov and K. Breugel, J Mater Sci 48(2013) 2490. 21. M. Ismail and M. Ohtsu, Constr Build Mater, 20 (2006) 458.
22. S, Feliu, J. A. González, J. M. Miranda and V. Feliu, Corros Sci, 47(2005) 217. 23. K. Hornbostel, C. K. Larsen and M. R. Geiker, Cem Concr Comp, 39 (2013)60.
24. GB/T 17457-2009 Ductile Iron Pipes and Fittings-Cement Mortar Linings. China's General Administration of Quality Supervision, Inspection and Quarantine, China Standard Press, Beijing. 25. M. Keddam, H. Takenouti, X. R. Nóvoa, C. Andrade and C. Alonso, Cem Concr Res, 27(1997)
1191.
26. S. J. Ford, J. D. Shane and T. O. Mason, Cem Concr Res, 28(1998) 1737.
27. M. Cabeza, P. Merino, A. Miranda, X. R. Nóvoa and I. Sanchez, Cem Concr Res, 32(2002) 881. 28. M. Serdar, L. V. Žulj and D. Bjegović, Corros Sci, 69(2013) 149.
29. HG/T 3523-2008 Technical Conditions of Standard Corrosion Spool of Chemical Treatment in Cooling Water. Chemical Industry Standard of the People's Republic of China, Chemical Industry Press, Beijing.
30. D. A. Koleva, J. H. W. de Wit, K. van Breugel, L. P. Veleva, E. van Westing, O. Copuroglu, and A. L. A. Fraaij, Mater Charact, 59(2008) 801.
31 Y. M. Tian, X. F. Liu, H. Guo, Y. Chen and X. Wang (2015) The electrochemical device to monitor metal corrosion in corrosive media. China Patent: 104568733.
32. H. Luo, H. Z. Su, C. F. Dong, K. Xiao and X. G. Li, Constr Build Mater, 96(2015) 502. 33. J. M. Deus, B. Díaz, L. Freire and X. R. Nóvoa, Electrochim Acta, 131 (2014)106. 34. L. Valek, S. Martinez, D. Mikulic and I. Brnardic, Corros Sci, 50 (2008) 2705. 35. L. Li, C. F. Dong, K. Xiao, J. Z. Yao and X. G. Li, Constr Build Mater, 68(2014)709. 36. H. W. Song and V. Saraswathy, Int J Electrochem Sci, 2(2007) 1.