RESEARCH NOTE
The transcriptome response of the ruminal
methanogen
Methanobrevibacter ruminantium
strain M1 to the inhibitor lauric acid
Xuan Zhou
1, Marc J. A. Stevens
2,3, Stefan Neuenschwander
4, Angela Schwarm
1, Michael Kreuzer
1,
Anna Bratus‑Neuenschwander
4,5†and Johanna O. Zeitz
1,6*†Abstract
Objective: Lauric acid (C12) is a medium‑chain fatty acid that inhibits growth and production of the greenhouse gas methane by rumen methanogens such as Methanobrevibacter ruminantium. To understand the inhibitory mechanism of C12, a transcriptome analysis was performed in M. ruminantium strain M1 (DSM 1093) using RNA‑Seq.
Results: Pure cell cultures in the exponential growth phase were treated with 0.4 mg/ml C12, dissolved in dimethyl sulfoxide (DMSO), for 1 h and transcriptomic changes were compared to DMSO‑only treated cells (final DMSO con‑ centration 0.2%). Exposure to C12 resulted in differential expression of 163 of the 2280 genes in the M1 genome (maxi‑ mum log2‑fold change 6.6). Remarkably, C12 hardly affected the expression of genes involved in methanogenesis. Instead, most affected genes encode cell‑surface associated proteins (adhesion‑like proteins, membrane‑associated transporters and hydrogenases), and proteins involved in detoxification or DNA‑repair processes. Enrichment analy‑ sis on the genes regulated in the C12‑treated group showed a significant enrichment for categories ‘cell surface’ and ‘mobile elements’ (activated by C12), and for the categories ‘regulation’ and ‘protein fate’ (represssed). These results are useful to generate and test specific hypotheses on the mechanism how C12 affects rumen methanogens.
Keywords: Methanobrevibacter ruminantium, Methanogenesis, Fatty acid, Rumen, Gene expression, Lauric acid
© The Author(s) 2018. This article is distributed under the terms of the Creative Commons Attribution 4.0 International License (http://creat iveco mmons .org/licen ses/by/4.0/), which permits unrestricted use, distribution, and reproduction in any medium, provided you give appropriate credit to the original author(s) and the source, provide a link to the Creative Commons license, and indicate if changes were made. The Creative Commons Public Domain Dedication waiver (http://creat iveco mmons .org/ publi cdoma in/zero/1.0/) applies to the data made available in this article, unless otherwise stated.
Introduction
Ruminal methane-producing archaea acquire atten-tion because ruminant livestock is estimated as the most important source of anthropogenic emission of the greenhouse gas methane [1]. Among the most-prom-ising anti-methanogenic compounds are two medium chain fatty acids (MCFA), lauric acid (C12) and myristic
acid (C14), which were shown to inhibit methanogenesis
in vivo when supplemented to the diet of ruminants [2–
4], in vitro in rumen fluid [5] and in methanogenic cul-tures [6]. MCFA cause leakage of K+ ions and decrease survival of Methanobrevibacter ruminantium, a
dominant methanogen species in the rumen [6, 7]. Fur-ther, MCFA killed some, but not all methanogen cells, which implies that the cells may be capable to react to fatty acid-caused stress. In search of the mode of action, we investigated the transcriptional response of M. rumi-nantium to exposure of C12 in culture.
Main text Methods
Experimental design
Methanobrevibacter ruminantium (strain M1, DSM 1093; ‘Deutsche Sammlung von Mikroorganismen und Zellkulturen’ (DSMZ), Braunschweig, Germany) was cultivated anaerobically in 50 ml of modified Methano-bacterium medium (DSMZ No. 1523) in 116 ml bottles under a CO2/H2 (0.2:0.8) atmosphere at 150 kPa and at
39 °C in an incubation shaker as described previously [6]. Growth of the cultures was monitored by recording
Open Access
*Correspondence: [email protected]
†Anna Bratus‑Neuenschwander and Johanna O. Zeitz contributed equally
to this work
6 Institute of Animal Nutrition and Nutritional Physiology, Justus‑Liebig
University Giessen, 35392 Giessen, Germany
optical density at 600 nm and by methane (CH4)
forma-tion after 24, 48, 60 and 61 h. The culture was inocu-lated with 5 ml of an exponentially growing pre-culture (OD600 ~ 0.64) to 45 ml of medium. Cell survival was
detected with the LIVE/DEAD BacLight Bacterial Viabil-ity Kit for microscopy and quantitative assays (Kit L7012; Invitrogen GmbH, Darmstadt, Germany) [6]. Lauric acid (≥ 97% purity) was obtained from Sigma-Aldrich (Buchs, Switzerland), and a stock solution with 200 mg/ml was prepared by dissolving the C12 in sterile dimethyl
sulfox-ide (DMSO) (Sigma-Aldrich), a commonly used solvent for water-insoluble substances [8]. After 60 h of incu-bation, when cells reached the exponential phase, three bottles were supplemented with 0.1 ml of the C12 stock
solution to reach a final concentration of 0.4 mg C12/
ml (treatment group), three bottles were supplemented with 0.1 ml of DMSO (final concentration: 0.2%) (con-trol group), and three bottles received no supplement (blank group). The concentration of C12 and the
expo-sure time of 1 h chosen were in a range where most cells remained alive and where CH4 formation was clearly but
not completely inhibited. It was verified that, at 61 h of incubation, CH4 formation rates and proportion of
liv-ing cells did not differ between DMSO-exposed con-trol cultures (measured: 0.71 ± 0.03 µmol/ml × h and 97 ± 0.3%, respectively) and untreated blank cultures (0.74 ± 0.04 µmol/ml × h and 99 ± 1.2%). At 61 h, i.e. after 1 h of exposure to C12, CH4 formation rates in the
hour after exposure were suppressed by 40 ± 6% com-pared to the control cultures (P < 0.05), and cell viability was reduced down to 71 ± 1.8% when compared to the control cultures (P < 0.05). At this time point, three sam-ples per group (each 50 ml of culture) were anaerobically collected at 4 °C after centrifugation at 5000×g for 6 min. Cell pellets were immediately frozen in liquid nitrogen and stored at − 80 °C until RNA extraction.
RNA isolation
Total RNA was isolated from the frozen cell pellets by using TRIzol® Reagent (ThermoFisher, Waltham, MS, USA), according to the manufacturer’s protocol. In order to remove genomic DNA from total RNA samples, a DNA digestion was performed with the RNase-Free DNase Set (Qiagen, Hilden, Germany) following manu-facturer’s instructions. Quantity and quality of extracted RNA were determined by a Qubit® 1.0 fluorometer with a Qubit RNA BR (Broad Range) assay kit (Invitrogen, Carlsbad, CA, USA) and by an Agilent 2200 TapeStation with the Agilent RNA ScreenTape assay (Agilent Tech-nologies, Santa Clara, CA, USA), respectively. Nine puri-fied total RNA samples with a yield of at least 5 µg and RNA integrity numbers (RIN) in a range of 5.6–7.6 were used for sequencing. These included three replicates per
group: three DMSO-dissolved C12-treated samples (T1,
T2 and T3), three samples with DMSO supplementation alone (control samples C1, C2, C3) and three samples without supplement (blank samples B1, B2, B3).
Ribosomal RNA depletion
The Ribo-Zero™ rRNA removal kit (Bacteria) (http:// www.illum ina.com/produ cts/ribo-zero-rrna-remov al-bacte ria.html, Epicentre, San Diego, USA) was applied to deplete rRNA from the M. ruminantium total RNA sam-ples (5 µg) by following the Illumina user guide for the Ribo-Zero Magnetic kits (Part#15065382 Rev. A, Novem-ber 2014). The rRNA-depleted samples were purified with AMPure RNAClean XP Beads (Beckman-Coulter Genomics, Nyon, Switzerland) as recommended in the Illumina protocol mentioned above.
Next generation sequencing
Enriched RNA samples were used to produce library constructs by following the Illumina TruSeq® Stranded total RNA protocol (Part#15031048 Rev. C, September 2012) with the Illumina TruSeq Stranded total RNA Sam-ple Preparation Kit. Libraries were quantified and qual-ity checked using qPCR with Illumina adapter specific primers (Roche LightCycler® system, Roche Diagnos-tics, Basel, Switzerland) and by the Agilent Technologies 2100 Bioanalyzer with DNA-specific chips, respectively. Diluted indexed libraries (10 nM) were pooled, used for cluster generation (Illumina TruSeq SR Cluster Kit v4-cBot-HS reagents) and further sequenced (Illumina TruSeq SBS Kit v4-HS reagents) on the Illumina HiSeq 2500 instrument in the high output mode according to the manufacturer’s recommendations. Illumina single read approach (1 × 125 bp) was used to generate raw sequencing reads with a depth of approximately 20–30 million reads per sample.
RNA‑sequencing data analysis
Data analyses were performed as described by Tanner et al. [9]. Shortly, reads (125 bp) were mapped against the genome of M. ruminantium M1 using the CLC Genomics Workbench 6.5.1 (CLC, Aarhus, Denmark). Statistical analysis was performed using Bioconduc-tor EdgeR software package in R. A false discovery rate (FDR) value < 0.05 was used as cutoff for significance of differentially expressed genes and log2 fold change > 1
and < −1 was used as cutoff for differential transcrip-tion of genes higher (positive log2-fold change values)
or lower (negative log2-fold change values) expressed in
Results and discussion
The Ribo-Zero™ rRNA Removal Kit can be used to effi-ciently remove the rRNA fraction from total RNA sam-ples isolated from the archaeon M. ruminantium M1. The Epicentre probes (directed to bind rRNA from a broad spectrum of bacteria species) reduced the rRNAs in all samples tested, which resulted in 40–85% of non-rRNA sequencing reads in the samples (Fig. 1). More than 10 million mRNA sequencing reads per sample were mapped to the genome of M. ruminantium M1 (Fig. 1), which is a sufficient coverage for transcriptome analyses [11].
First, we compared the untreated cultures to the con-trol cultures treated with DMSO. DMSO affected the expression of 97 out of 2280 genes in the M1 genome (Additional file 1). DMSO induced changes in gene expression of cell surface-related proteins, cell mem-brane-associated transporters and intracellular proteins; the latter maybe related to the observation that DMSO penetrates cell membranes [8]. DMSO-regulated genes included genes encoding proteins related to the cell envelope, mainly adhesion-like proteins (six genes; four
Table 1 Number of genes significantly differential expressed within functional categories
a Significant functional enrichment in a Fisher exact test (p < 0.05)
b Significant functional underrepresentation in a Fisher exact test (p < 0.05)
c Non-conserved hypothetical genes and RNAs are omitted in the classification [11]. Treatment: with DMSO-dissolved C
12, control: with DMSO alone, blank: without C12 and DMSO
Category Gene count Treatment vs. control Control vs. blank Treatment vs. blank
Up Down Up Down Up Down
Amino acid metabolism 94 2b 3 0 4 1 2
Cell cycle 29 1 0 0 0 0 0
Cell envelope 189 28a 0b 2 4 2 3
Cellular processes 14 3 1 1 0 2a 0
Central carbon metabolism 61 2 1 0 1 2 0 Energy metabolism 141 9 9a 6 3 6 0
Lipid metabolism 21 0 0 1 0 0 3a
Mobile elements 87 37a 0 0 37a 0 0
Nitrogen metabolism 14 0 1 1 0 1 0 Nucleic acid metabolism 60 2 1 0 0 0 0 Protein fate 51 0b 2 1 0 1 0
Protein synthesis 169 7 1 0b 9 0b 0
Purines and pyrimidines 47 2 0 0 0 0 0 Regulation 68 0b 5a 5a 0 2 0
Secondary metabolites 12 4 0 0 0 0 0 Transcription 26 1 0 0 0 0 0 Transporters 97 11 1 7a 3 7a 1
Unknown function 183 10 8 4 2b 3 0
Vitamins and cofactors 142 8 3 2 4 5 1 Totalc 1505 127 36 30 67 32 10
Fig. 1 Ribosomal RNA depletion and reads enrichment in RNA extracted from M. ruminantium M1. B: blank (without C12 and
[image:3.595.62.540.100.386.2] [image:3.595.306.540.449.647.2]down-regulated, two up-regulated). Others were classi-fied as mobile genetic elements (38 genes including hypo-thetical genes; all down-regulated), and genes involved in energy metabolism, mainly hydrogen metabolism [nine genes, six up-regulated (frhA/B1/D/G, mtrA2, DsbD), three down-regulated (hypA/B, adh3)]. Genes involved in metabolism of vitamins and cofactors (six genes; four down-regulated, two up-regulated) as well as of amino acids (four genes, all down-regulated) were regulated. Moreover, cation transporters (five genes; four of five up-regulated), amino acid transporters (two genes; down-regulated), and other transporters (three genes, up-regulated) showed differential expression when untreated cultures were compared to DMSO-supple-mented cultures. Overall, the set of genes regulated in the DMSO control group compared to the blank group was enriched for genes assigned to categories: ‘Mobile elements’, ‘Transporters’, and ‘Regulation’, whereas genes assigned to ‘protein synthesis’ and genes of unknown function were significantly underrepresented (Table 1).
The comparison between the C12 + DMSO-treated and
the untreated cultures revealed 42 genes differentially regulated (Additional file 2), 26 of these also found in the DMSO-treated versus untreated comparison (Additional file 3).
Thereafter the transcriptome of the C12 +
DMSO-treated and DMSO-DMSO-treated cultures were compared to identify the mechanisms how MCFA affect methanogen-esis. A total of 147 genes, 6.4% of all 2280 genes, were dif-ferentially regulated (Table 2).
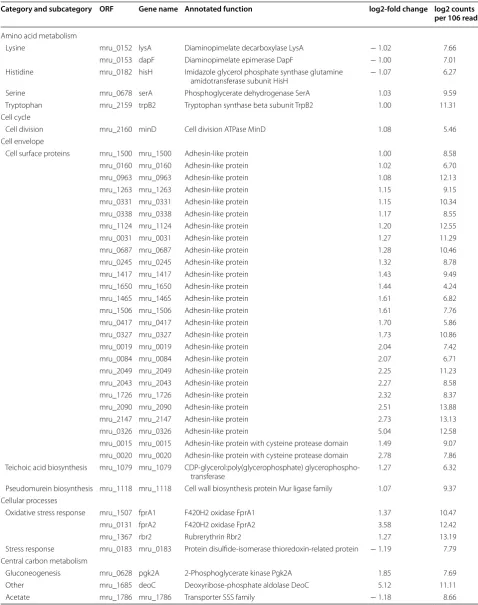
The subcellular localization of the encoded protein could be identified for 75% of the regulated genes. Pre-dominantly, genes associated with the cell envelope were affected, namely trans-membrane proteins or membrane-associated proteins. Enrichment analysis showed that, with C12 exposure, mainly adhesion-like proteins
(cat-egory ‘cell surface’) and phage-related proteins (‘mobile elements’) were significantly enriched in the regulated genes data set (Table 1). This supports earlier suggestions that MCFA primarily target the cell envelope and pro-cesses that occur at the cell membrane [12]. For example, upon exposure to C12 in the present study, the mRNA
abundance of 26 adhesion-like proteins (ALPs) (part of the cell envelope [13]), i.e. of 25% of all ALPs of M. rumi-nantium, and of two proteins involved in biosynthesis of teichoic acid and pseudomurein which are cell-wall related [14], were up-regulated compared to the DMSO control group (Table 2).
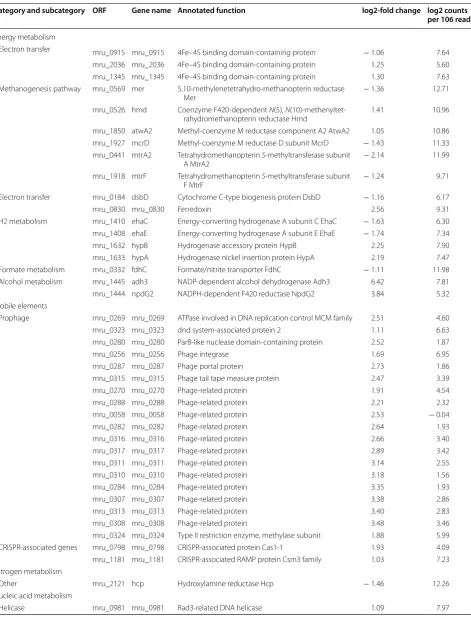
Two subunits of the membrane-bound energy-convert-ing hydrogenase (Eha), which is involved in hydrogeno-trophic methanogenesis [13, 15], were down-regulated by log21.6- and 1.7-fold in cultures exposed to C12, whereas
two cytoplasmic hydrogenases (Frh, Mvh) were not. A
gene encoding ferredoxin, a trans-membrane iron-sulfur protein involved in electron transfer from hydrogen, was up-regulated (log 2.6-fold upon C12 exposure).
Expres-sion of 3 genes encoding trans-membrane 4Fe-4S binding domain-containing proteins was affected by C12
expo-sure. Two subunits of the methyl-H4MPT:coenzyme M methyltransferase (Mtr), which is membrane-bound and plays a crucial role in the methanogenesis pathway [15,
16], were down-regulated by log2 2.1- and 1.2-fold upon
C12 exposure. In total 13 genes encoding mainly
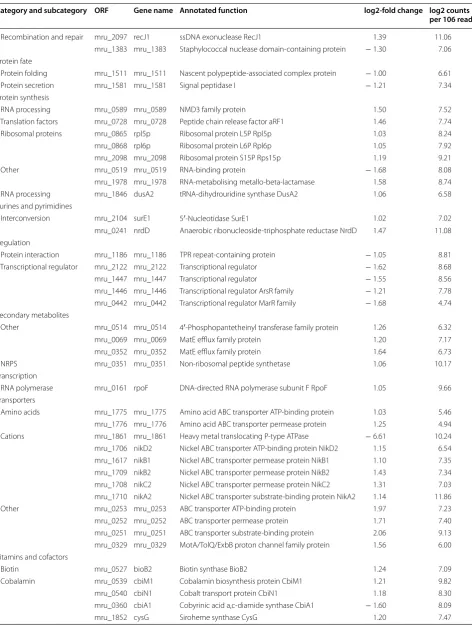
trans-porters of amino acids and cations displayed differences in transcript abundance after C12 exposure (Table 2).
For example, several genes encoding subunits of cations transporters, like the nickel ABC transporter permease proteins or nickel ABC transporter ATP-binding pro-teins, NikA2, NikB1, NikB2, NikC2 and NikD2, were dif-ferentially regulated. These cation transporters belong to a large family of ABC transporters (peptide/nickel transporter family) in ABC-type nickel transporter sys-tem, which is composed of a periplasmic binding pro-tein (NikA), two integral membrane propro-teins (NikB and NikC) and two ABC proteins (NikD and NikE) [17]. One P-type ATPase, which are membrane-bound efflux pumps involved in metal homeostasis of microorganisms [18], was down-regulated. In prokaryotes, ABC trans-porters and P-type ATPases have important functions in maintaining appropriate concentrations of transition metals such as Ni, Co, Fe, Cu, and Zn, which are essen-tial components of many prokaryotic enzymes [18]. Two transmembrane cobalt transport proteins (mru_0540; mru_0539), and two membrane-associated proteins involved in molybdate transport (mru_0200, mru_0201) [19], were up-regulated.
In addition, genes encoding intracellular proteins were affected by C12 exposure. These data support earlier
observations that exposure to C12 causes leakage of
intra-cellular K+ ions in M. ruminantium [6, 7], thus damages the cell envelope. Amongst the regulated genes, mostly genes encoding proteins involved in DNA repair, and genes controlling transcription/translation and redox homeostasis were affected. For example, thioredoxins and rubrerythrins showed an altered expression; they are considered to form a system protecting Archaea against oxidative stress [20, 21]. Thioredoxin-like proteins exhibit biochemical activities similar to thioredoxin and help methanogens maintain redox homeostasis [7]. Genes which were up-regulated by C12 included genes encoding
Table 2 Significant changes of gene expression in M. ruminantium M1 cultures exposed to C12
Category and subcategory ORF Gene name Annotated function log2-fold change log2 counts
per 106 reads
Amino acid metabolism
Lysine mru_0152 lysA Diaminopimelate decarboxylase LysA − 1.02 7.66 mru_0153 dapF Diaminopimelate epimerase DapF − 1.00 7.01 Histidine mru_0182 hisH Imidazole glycerol phosphate synthase glutamine
amidotransferase subunit HisH − 1.07 6.27 Serine mru_0678 serA Phosphoglycerate dehydrogenase SerA 1.03 9.59 Tryptophan mru_2159 trpB2 Tryptophan synthase beta subunit TrpB2 1.00 11.31 Cell cycle
Cell division mru_2160 minD Cell division ATPase MinD 1.08 5.46 Cell envelope
Cell surface proteins mru_1500 mru_1500 Adhesin‑like protein 1.00 8.58 mru_0160 mru_0160 Adhesin‑like protein 1.02 6.70 mru_0963 mru_0963 Adhesin‑like protein 1.08 12.13 mru_1263 mru_1263 Adhesin‑like protein 1.15 9.15 mru_0331 mru_0331 Adhesin‑like protein 1.15 10.34 mru_0338 mru_0338 Adhesin‑like protein 1.17 8.55 mru_1124 mru_1124 Adhesin‑like protein 1.20 12.55 mru_0031 mru_0031 Adhesin‑like protein 1.27 11.29 mru_0687 mru_0687 Adhesin‑like protein 1.28 10.46 mru_0245 mru_0245 Adhesin‑like protein 1.32 8.78 mru_1417 mru_1417 Adhesin‑like protein 1.43 9.49 mru_1650 mru_1650 Adhesin‑like protein 1.44 4.24 mru_1465 mru_1465 Adhesin‑like protein 1.61 6.82 mru_1506 mru_1506 Adhesin‑like protein 1.61 7.76 mru_0417 mru_0417 Adhesin‑like protein 1.70 5.86 mru_0327 mru_0327 Adhesin‑like protein 1.73 10.86 mru_0019 mru_0019 Adhesin‑like protein 2.04 7.42 mru_0084 mru_0084 Adhesin‑like protein 2.07 6.71 mru_2049 mru_2049 Adhesin‑like protein 2.25 11.23 mru_2043 mru_2043 Adhesin‑like protein 2.27 8.58 mru_1726 mru_1726 Adhesin‑like protein 2.32 8.37 mru_2090 mru_2090 Adhesin‑like protein 2.51 13.88 mru_2147 mru_2147 Adhesin‑like protein 2.73 13.13 mru_0326 mru_0326 Adhesin‑like protein 5.04 12.58 mru_0015 mru_0015 Adhesin‑like protein with cysteine protease domain 1.49 9.07 mru_0020 mru_0020 Adhesin‑like protein with cysteine protease domain 2.78 7.86 Teichoic acid biosynthesis mru_1079 mru_1079 CDP‑glycerol:poly(glycerophosphate) glycerophospho‑
transferase 1.27 6.32 Pseudomurein biosynthesis mru_1118 mru_1118 Cell wall biosynthesis protein Mur ligase family 1.07 9.37 Cellular processes
Oxidative stress response mru_1507 fprA1 F420H2 oxidase FprA1 1.37 10.47 mru_0131 fprA2 F420H2 oxidase FprA2 3.58 12.42 mru_1367 rbr2 Rubrerythrin Rbr2 1.27 13.19 Stress response mru_0183 mru_0183 Protein disulfide‑isomerase thioredoxin‑related protein − 1.19 7.79 Central carbon metabolism
[image:5.595.56.535.100.706.2]Table 2 (continued)
Category and subcategory ORF Gene name Annotated function log2-fold change log2 counts
per 106 reads
Energy metabolism
Electron transfer mru_0915 mru_0915 4Fe–4S binding domain‑containing protein − 1.06 7.64 mru_2036 mru_2036 4Fe–4S binding domain‑containing protein 1.25 5.60 mru_1345 mru_1345 4Fe–4S binding domain‑containing protein 1.30 7.63 Methanogenesis pathway mru_0569 mer 5,10‑methylenetetrahydro‑methanopterin reductase
Mer − 1.36 12.71 mru_0526 hmd Coenzyme F420‑dependent N(5), N(10)‑methenyltet‑
rahydromethanopterin reductase Hmd 1.41 10.96 mru_1850 atwA2 Methyl‑coenzyme M reductase component A2 AtwA2 1.05 10.86 mru_1927 mcrD Methyl‑coenzyme M reductase D subunit McrD − 1.43 11.33 mru_0441 mtrA2 Tetrahydromethanopterin S‑methyltransferase subunit
A MtrA2 − 2.14 11.99 mru_1918 mtrF Tetrahydromethanopterin S‑methyltransferase subunit
F MtrF − 1.24 9.71 Electron transfer mru_0184 dsbD Cytochrome C‑type biogenesis protein DsbD − 1.16 6.17 mru_0830 mru_0830 Ferredoxin 2.56 9.31 H2 metabolism mru_1410 ehaC Energy‑converting hydrogenase A subunit C EhaC − 1.63 6.30 mru_1408 ehaE Energy‑converting hydrogenase A subunit E EhaE − 1.74 7.34 mru_1632 hypB Hydrogenase accessory protein HypB 2.25 7.90 mru_1633 hypA Hydrogenase nickel insertion protein HypA 2.19 7.47 Formate metabolism mru_0332 fdhC Formate/nitrite transporter FdhC − 1.11 11.98 Alcohol metabolism mru_1445 adh3 NADP‑dependent alcohol dehydrogenase Adh3 6.42 7.81 mru_1444 npdG2 NADPH‑dependent F420 reductase NpdG2 3.84 5.32 Mobile elements
Prophage mru_0269 mru_0269 ATPase involved in DNA replication control MCM family 2.51 4.60 mru_0323 mru_0323 dnd system‑associated protein 2 1.11 6.63 mru_0280 mru_0280 ParB‑like nuclease domain‑containing protein 2.52 1.87 mru_0256 mru_0256 Phage integrase 1.69 6.95 mru_0287 mru_0287 Phage portal protein 2.73 1.86 mru_0315 mru_0315 Phage tail tape measure protein 2.47 3.39 mru_0270 mru_0270 Phage‑related protein 1.91 4.54 mru_0288 mru_0288 Phage‑related protein 2.21 2.32 mru_0058 mru_0058 Phage‑related protein 2.53 − 0.04 mru_0282 mru_0282 Phage‑related protein 2.64 1.93 mru_0316 mru_0316 Phage‑related protein 2.66 3.40 mru_0317 mru_0317 Phage‑related protein 2.89 3.42 mru_0311 mru_0311 Phage‑related protein 3.14 2.55 mru_0310 mru_0310 Phage‑related protein 3.18 1.56 mru_0284 mru_0284 Phage‑related protein 3.35 1.93 mru_0307 mru_0307 Phage‑related protein 3.38 2.86 mru_0313 mru_0313 Phage‑related protein 3.40 2.83 mru_0308 mru_0308 Phage‑related protein 3.48 3.46 mru_0324 mru_0324 Type II restriction enzyme, methylase subunit 1.88 5.99 CRISPR‑associated genes mru_0798 mru_0798 CRISPR‑associated protein Cas1‑1 1.93 4.09 mru_1181 mru_1181 CRISPR‑associated RAMP protein Csm3 family 1.03 7.23 Nitrogen metabolism
Other mru_2121 hcp Hydroxylamine reductase Hcp − 1.46 12.26 Nucleic acid metabolism
[image:6.595.63.535.98.716.2]Table 2 (continued)
Category and subcategory ORF Gene name Annotated function log2-fold change log2 counts
per 106 reads
Recombination and repair mru_2097 recJ1 ssDNA exonuclease RecJ1 1.39 11.06 mru_1383 mru_1383 Staphylococcal nuclease domain‑containing protein − 1.30 7.06 Protein fate
Protein folding mru_1511 mru_1511 Nascent polypeptide‑associated complex protein − 1.00 6.61 Protein secretion mru_1581 mru_1581 Signal peptidase I − 1.21 7.34 Protein synthesis
RNA processing mru_0589 mru_0589 NMD3 family protein 1.50 7.52 Translation factors mru_0728 mru_0728 Peptide chain release factor aRF1 1.46 7.74 Ribosomal proteins mru_0865 rpl5p Ribosomal protein L5P Rpl5p 1.03 8.24 mru_0868 rpl6p Ribosomal protein L6P Rpl6p 1.05 7.92 mru_2098 mru_2098 Ribosomal protein S15P Rps15p 1.19 9.21 Other mru_0519 mru_0519 RNA‑binding protein − 1.68 8.08 mru_1978 mru_1978 RNA‑metabolising metallo‑beta‑lactamase 1.58 8.74 RNA processing mru_1846 dusA2 tRNA‑dihydrouridine synthase DusA2 1.06 6.58 Purines and pyrimidines
Interconversion mru_2104 surE1 5′‑Nucleotidase SurE1 1.02 7.02 mru_0241 nrdD Anaerobic ribonucleoside‑triphosphate reductase NrdD 1.47 11.08 Regulation
Protein interaction mru_1186 mru_1186 TPR repeat‑containing protein − 1.05 8.81 Transcriptional regulator mru_2122 mru_2122 Transcriptional regulator − 1.62 8.68 mru_1447 mru_1447 Transcriptional regulator − 1.55 8.56 mru_1446 mru_1446 Transcriptional regulator ArsR family − 1.21 7.78 mru_0442 mru_0442 Transcriptional regulator MarR family − 1.68 4.74 Secondary metabolites
Other mru_0514 mru_0514 4′‑Phosphopantetheinyl transferase family protein 1.26 6.32 mru_0069 mru_0069 MatE efflux family protein 1.20 7.17 mru_0352 mru_0352 MatE efflux family protein 1.64 6.73 NRPS mru_0351 mru_0351 Non‑ribosomal peptide synthetase 1.06 10.17 Transcription
RNA polymerase mru_0161 rpoF DNA‑directed RNA polymerase subunit F RpoF 1.05 9.66 Transporters
Amino acids mru_1775 mru_1775 Amino acid ABC transporter ATP‑binding protein 1.03 5.46 mru_1776 mru_1776 Amino acid ABC transporter permease protein 1.25 4.94 Cations mru_1861 mru_1861 Heavy metal translocating P‑type ATPase − 6.61 10.24 mru_1706 nikD2 Nickel ABC transporter ATP‑binding protein NikD2 1.15 6.54 mru_1617 nikB1 Nickel ABC transporter permease protein NikB1 1.10 7.35 mru_1709 nikB2 Nickel ABC transporter permease protein NikB2 1.43 7.34 mru_1708 nikC2 Nickel ABC transporter permease protein NikC2 1.31 7.03 mru_1710 nikA2 Nickel ABC transporter substrate‑binding protein NikA2 1.14 11.86 Other mru_0253 mru_0253 ABC transporter ATP‑binding protein 1.97 7.23 mru_0252 mru_0252 ABC transporter permease protein 1.71 7.40 mru_0251 mru_0251 ABC transporter substrate‑binding protein 2.06 9.13 mru_0329 mru_0329 MotA/TolQ/ExbB proton channel family protein 1.56 6.00 Vitamins and cofactors
[image:7.595.61.534.98.727.2]involved in translation or post-translational modifica-tion were down-regulated, e.g. a staphylococcal nucle-ase domain-containing protein (mru_1383), a nascent polypeptide-associated complex protein (mru_1511), an RNA-binding protein (mru_0519) and a signal peptidase (mru_1581).
Conclusion
The transcriptional response of M. ruminantium to the fatty acid C12 does not involve repression of specific
pathway such as the methanogenesis pathway. Instead, it implies that C12 provokes broad transcriptional changes,
and targets primarily cell surface associated adhesion-like
proteins, phage-related proteins, and transmembrane proteins. How this response affects methanogens remains unclear. Future studies may investigate how different dos-ages of and prolonged exposure to C12 affect gene and
protein expression and survival of M. ruminantium.
Limitations
One limitation of our study is the low number of repli-cates per group. In addition, only one dosage of C12 was
tested and samples for RNA sequencing were collected only at one time point; this precludes generalization to Table 2 (continued)
Category and subcategory ORF Gene name Annotated function log2-fold change log2 counts
per 106 reads
Coenzyme B mru_0385 aksA Homocitrate synthase AksA − 1.15 10.22 Metal‑binding pterin mru_0200 modB Molybdate ABC transporter permease protein ModB 2.04 9.37
mru_0201 modA Molybdate ABC transporter substrate‑binding protein
ModA 2.83 10.54
Thiamine mru_0247 thiC1 Thiamine biosynthesis protein ThiC1 − 1.18 9.24 mru_0532 mru_0532 ThiF family protein 1.38 4.67 Others mru_1769 nifB Nitrogenase cofactor biosynthesis protein NifB 2.58 8.89 Unknown function
Enzyme mru_0455 mru_0455 Acetyltransferase − 1.16 9.80 mru_1758 mru_1758 Acetyltransferase − 1.10 6.05 mru_2170 mru_2170 Acetyltransferase 1.32 6.12 mru_0574 mru_0574 Acetyltransferase GNAT family − 1.92 1.81 mru_1707 mru_1707 Acetyltransferase GNAT family 1.48 5.54 mru_0560 mru_0560 ATPase 1.11 8.14 mru_1613 mru_1613 SAM‑dependent methyltransferase 1.58 4.18 Other mru_0231 mru_0231 CAAX amino terminal protease family protein − 1.09 8.53 mru_1993 mru_1993 CBS domain‑containing protein − 1.65 10.72 mru_1994 mru_1994 CBS domain‑containing protein − 1.31 11.57 mru_0474 mru_0474 HD domain‑containing protein 1.33 7.47 mru_1034 mru_1034 HEAT repeat‑containing protein 2.35 8.75 mru_2109 mru_2109 Methanogenesis marker protein 12 − 1.01 7.90 mru_0562 mru_0562 PP‑loop family protein 1.59 7.50 mru_1678 mru_1678 Redox‑active disulfide protein 1.51 7.12 mru_0561 mru_0561 Von Willebrand factor type A domain‑containing
protein 1.33 8.52 mru_1510 mru_1510 YhgE/Pip‑like protein − 1.31 8.45 mru_0627 mru_0627 ZPR1 zinc‑finger domain‑containing protein 2.04 6.70
[image:8.595.61.539.98.450.2]situations where C12 affects M. ruminantium stronger or
weaker.
Abbreviations
MCFA: medium‑chain fatty acids; C12: lauric acid; DMSO: dimethyl sulfoxide;
CH4: methane.
Authors’ contributions
XZ participated in designing the study, performed the data collection, and drafted the manuscript. MJAS performed the data analysis and contributed to data interpretation. SN participated in designing the study, data collection and data interpretation and revised the manuscript. AS participated in data collection and critically revised the manuscript. MK participated in designing the study and critically revised the manuscript. AB participated in designing the study, performed the sequencing experiment, wrote the methods section of the manuscript, contributed to interpretation of the data and revised the manuscript. JOZ designed the study and wrote introduction, results and dis‑ cussion of the manuscript. All authors read and approved the final manuscript.
Author details
1 Institute of Agricultural Sciences, ETH Zurich, Universitätstrasse 2,
8092 Zurich, Switzerland. 2 Laboratory of Food Biotechnology, Institute
of Food, Nutrition and Health, ETH Zurich, Schmelzbergstrasse 7, 8092 Zurich, Switzerland. 3 Institute for Food Hygiene and Safety, University of Zurich,
Winterthurerstrasse 272, 8057 Zurich, Switzerland. 4 Institute of Agricultural
Sciences, ETH Zurich, Tannenstrasse 1, 8092 Zurich, Switzerland. 5 Functional
Genomics Center Zurich, ETH Zurich and University of Zurich, Winter‑ thurerstrasse 190, 8057 Zurich, Switzerland. 6 Institute of Animal Nutrition
and Nutritional Physiology, Justus‑Liebig University Giessen, 35392 Giessen, Germany.
Acknowledgements
Not applicable.
Competing interests
The authors declare that they have no competing interests. Additional files
Additional file 1: Table S1. M. ruminantium M1 genes with significantly
changed expression of genes in the DMSO control as compared to the blank group (log2‑fold change < 1 and > 1, false discovery rate < 0.05).
The list does not include the 59 regulated hypothetical proteins. The M. ruminantium (mru) open reading frame (ORF) codes are adopted from the Kyoto Encyclopedia of Genes and Genomes.
Additional file 2: Table S2. M. ruminantium M1 genes with significantly
changed expression of genes in the cultures exposed to C12+ DMSO as
compared to the blank group (log2‑fold change < 1 and > 1, false discov‑
ery rate < 0.05). The list does not include the 15 regulated hypothetical proteins. The M. ruminantium (mru) open reading frame (ORF) codes are adopted from the Kyoto Encyclopedia of Genes and Genomes.
Additional file 3: Figure S1. Venn diagram indicates the number of
differentially expressed genes between the experimental groups and the common overlapping differentially expressed genes. TC: treat‑ ment (C12+ DMSO) vs. control (DMSO); TB: treatment (C12+ DMSO) vs.
untreated blank; CB: control (DMSO) vs. untreated blank. It should be kept in mind that it is not possible to distinguish between the DMSO and the C12 effect in the dataset comparing the treatment and the blank samples,
and that the C12 effect is much better studied in the TC comparison
(C12+ DMSO vs DMSO). The DMSO effect can be partial quenched by the
C12 effect, so genes regulated in CB and TC are not necessarily regulated
in the TB. The 26 common genes differentially expressed in M. ruminan-tium exposed to DMSO or DMSO + C12 compared to the untreated blank
control are outlined in the tables on the right side. The 35 overlapping differentially expressed genes of the TC and CB comparisons are outlined in the table on the left side. The diagram was generated using the online tool at bioinformatics.psb.ugent.be/webtools/Venn/.
Availability of data and materials
The raw data can be accessed in the NCBI Sequence Read Archive (SRA) under the series record GSE81199 at https ://www.ncbi.nlm.nih.gov/geo/query /acc. cgi?acc=GSE81 199.
Consent for publication
Not applicable.
Ethics approval and consent to participate
Not applicable.
Funding
This study was supported by the China Scholarship Council and the ETH Zurich Scholarship for Doctoral Students.
Publisher’s Note
Springer Nature remains neutral with regard to jurisdictional claims in pub‑ lished maps and institutional affiliations.
Received: 30 December 2017 Accepted: 9 February 2018
References
1. UNFCC 2016 (United Nations Framework Convention on Climate Change). Greenhouse Gas Data, unfcc c.int/ghg_data/ghg:data:unfcc c/ items /4146.php. Accessed 5 Sept 2016.
2. Jordan E, Lovett DK, Hawkins M, Callan JJ, O’Mara FP. The effect of varying levels of coconut oil on intake, digestibility and methane output from continental cross beef heifers. Anim Sci. 2006;82:859–65.
3. Machmüller A, Kreuzer M. Methane suppression by coconut oil and associated effects on nutrient and energy balance in sheep. Can J Anim Sci. 1999;79:65–72.
4. Machmüller A, Soliva CR, Kreuzer M. Methane‑suppressing effect of myristic acid in sheep as affected by dietary calcium and forage propor‑ tion. Br J Nutr. 2003;90:529–40.
5. Dohme F, Machmüller A, Wasserfallen A, Kreuzer M. Ruminal metha‑ nogenesis as influenced by individual fatty acids supplemented to complete ruminant diets. Lett Appl Microbiol. 2001;32:47–51.
6. Zhou X, Meile L, Kreuzer M, Zeitz JO. The effect of saturated fatty acids on methanogenesis and cell viability of Methanobrevibacter ruminantium. Archaea. 2013;2013:106916.
7. Zhou X, Zeitz JO, Meile L, Kreuzer M, Schwarm A. Influence of pH and the degree of protonation on the inhibitory effect of fatty acids in the ruminal methanogen Methanobrevibacter ruminantium strain M1. J Appl Microbiol. 2015;119:1482–93.
8. Santos NC, Figueira‑Coelho J, Martins‑Silva J, Saldanha C. Multidisciplinary utilization of dimethyl sulfoxide: pharmacological, cellular, and molecular aspects. Biochem Pharmacol. 2003;65:1035–41.
9. Tanner SA, Chassard C, Rigozzi E, Lacroix C, Stevens MJA. Bifidobacterium thermophilum RBL67 impacts on growth and virulence gene expression of Salmonella enterica subsp. enterica serovar Typhimurium. BMC Micro‑ biol. 2016;16:46–61.
10. Rosenthal AZ, Matson EG, Eldar A, Leadbetter JR. RNA‑seq reveals cooperative metabolic interactions between two termite‑gut spirochete species in co‑culture. ISME J. 2011;5:1133–42.
11. Haas BJ, Chin M, Nusbaum C, Birren BW, Livny J. How deep is deep enough for RNA‑Seq profiling of bacterial transcriptomes? BMC Genom. 2012;13:734–44.
12. Desbois AP, Smith VJ. Antibacterial free fatty acids: activities, mechanisms of action and biotechnological potential. Appl Microbiol Biotechnol. 2010;85:1629–42.
13. Leahy SC, Kelly WJ, Altermann E, Ronimus RS, Yeoman CJ, Pacheco DM, et al. The genome sequence of the ruminal methanogen Methanobre-vibacter ruminantium reveals new possibilities for controlling ruminant methane emissions. PLoS ONE. 2010;5:e8926.
• We accept pre-submission inquiries
• Our selector tool helps you to find the most relevant journal • We provide round the clock customer support
• Convenient online submission • Thorough peer review
• Inclusion in PubMed and all major indexing services • Maximum visibility for your research
Submit your manuscript at www.biomedcentral.com/submit
Submit your next manuscript to BioMed Central
and we will help you at every step:
15. Thauer RK, Kaster AK, Seedorf H, Buckel W, Hedderich R. Methanogenic archaea: ecologically relevant differences in energy conservation, Nature Rev. Microbiol. 2008;8:579–91.
16. Kaster AK, Goenrich M, Seedorf H, Liesegang H, Wollherr A, Gottschalk G, Thauer RK. More than 200 genes required for methane formation from H2
and CO2 and energy conservation are present in Methanothermobacter
marburgensis and Methanothermobacter thermautotrophicus. Archaea. 2011;2011:973848.
17. Rodionov DA, Hebbeln P, Gelfand MS, Eitinger T. Comparative and func‑ tional genomic analysis of prokaryotic nickel and cobalt uptake trans‑ porters: evidence for a novel group of ATP‑binding cassette transporters. J Bacteriol. 2006;188:317–27.
18. Lewinson O, Lee AT, Rees DC. A P‑type ATPase importer that discrimi‑ nates between essential and toxic transition metals. Proc Natl Acad Sci. 2009;106:4677–82.
19. Grunden AM, Shanmugam KT. Molybdate transport and regulation in bacteria. Arch Microbiol. 1997;168:345–54.
20. Pedone E, Bartolucci S, Fiorentino G. Sensing and adapting to environ‑ ment stress: the archaeal tactic. Front Biosci. 2004;9:2909–26. 21. Kato S, Kosaka T, Watanabe K. Comparative transcriptome analysis of