Heiko Claussen1,2, Justinian Rosca1, and Robert Damper2
1Siemens Corporate Research Inc.,
755 College Road East, Princeton, New Jersey 08540
{Heiko.Claussen,Justinian.Rosca}@siemens.com 2
University of Southampton, School of Electronics and Computer Science,
Southampton SO17 1BJ, UK
{hc05r,rid}@ecs.soton.ac.uk
Abstract. Functional Data Analysis (FDA) is used for datasets that are
more meaningfully represented in the functional form. Functional prin-cipal component analysis, for instance, is used to extract a set of func-tions of maximum variance that can represent the data. In this paper, a method of Mutual Interdependence Analysis (MIA) is proposed that can extract an equally correlated function with a set of inputs. Formally, the MIA criterion defines the function whose mean variance of correlations with all inputs is minimized. The meaningfulness of the MIA extraction is proven on real data. In a simple text independent speaker verification example, MIA is used to extract a signature function per each speaker, and results in an equal error rate of 2.9 % in the set of 168 speakers.
1
Introduction
Principal Component Analysis (PCA) , discussed in [1] for nonfunctional and [2] for functional data, is an essential feature extraction method. Principal com-ponent functions are such that they can approximate new data with minimum mean square error even if only a subset of all components is used. The prin-cipal component functions are given by the directions of maximum variance in the projections of the data. The directions of minimum variance, or minor com-ponents, have received much less attention in the literature. Minor components correspond to directions that are either orthogonal to the inputs or minimize the variance of their projections. Hence, they represent an invariant or ”common” direction of the inputs. Further information about PCA and MCA, including their probabilistic models, can be found in [3], [4], [5] and [6].
[7] acknowledged that minor components are important in some signal pro-cessing applications. Examples are spectral estimation, curve and hyper-surface fitting, cognitive perception and computer vision. This work coined the name Minor Component Analysis (MCA) to refer to neural network fitting methods that compute minor components. The authors also suggested that MCA solves the Total Least Square (TLS) problem [8].
Recently, a method called Extreme Component Analysis (XCA) was intro-duced that combines minor and principal components in order to represent a
M.E. Davies et al. (Eds.): ICA 2007, LNCS 4666, pp. 446–453, 2007. c
dataset ”optimally”. As discussed in [9], the ”optimal” representation, if by mi-nor or principal components, is dependent on the dataset. By freely choosing between minor, principal components and their combinations, datasets can be represented with possibly a lower number of components.
As previously mentioned, MCA can be used to extract minor components that represent invariants of the data. However, when it is desired to extract the mutual interdependencies of a set of input functions, MCA suffers because of the necessary preprocessing step of input data centering. In the usual case, where the input functions are linearly independent, centering reduces the span of the data. Therefore, these centered functions can no longer fully represent the inputs. Furthermore, as discussed in [10] the TLS and therefore the MCA solution is non trivial and can usually not be found in closed form.
In this paper, we propose Mutual Interdependence Analysis (MIA) to solve a TLS-like optimization problem in the span of the original inputs in order to extract a mutually interdependent function from the input function set. We prove that in the case of linearly independent input functions, a closed form solution can be found that minimizes the MIA criterion.
In section 2 we define the MIA problem, derive its solution and illustrate its properties. In the experimental section 3, MIA is used for simple text indepen-dent speaker recognition. We end the paper with conclusions and directions for further work.
2
Mutual Interdependence Analysis (MIA)
Throughout the paper, we usexT to denote the transpose of column vector x. Also, we denoteXto be the matrix whose columns arexiwithi= 1, . . . , D. We use 1 to represent a vector of ones, 1 to represent a matrix of ones andI to be the identity matrix. The dimension will be clear from the context.
ConsiderDreal inputs,xi(tj) withi= 1, . . . , Dandj= 1, . . . , N, where each inputxi= [xi(t1), . . . , xi(tN)]T is viewed as a single entity (i.e. has the intrinsic structure of a function) rather than a series of individual observations. Functional Data Analysis (FDA) normally treats data this way, therefore we refer to eachxi as an input. In our case,N is typically larger or much larger thanD. TLS solves a linear equation XT·s=b by finding a directionsthat minimizes the squared,
orthogonal distances to the data points xi: min s
D i=1
|xT
i·s−bi|
2
sT·s+1 . On the other hand, the ordinary Least Square (LS) problem finds a directionsthat minimizes min
s D
i=1x
T
i ·s−bi
2
.While LS assumes that only vectorbto contain errors,
the TLS approach models uncertainties in bothband in the dataX. Our goal is different: Extract a new vector (function)sthat ”optimally” represents theD
J(X|s) = D
i=1
sT ·xi− 1
D
D
k=1
sT ·xk 2
(1)
Our problem is to find the maximum likelihood vector ˆsof norm one, in the span of the inputs, that minimizesJ(X|s):
ˆ
s= arg min
s,s=1,s=
D
k=1
ck·xk
J(X|s) (2)
2.1 Solution to MIA
Let us find an equivalent formulation for the MIA problem in (2). Consider the mean functionx(m) = 1
D D
i=1xi and the centered functions x
(c)
i =xi−x(m). It can be easily shown that sT ·xi− 1
D D
k=1sT·xk = sT·x (c)
i . Hence, (2) becomes:
ˆ
s= arg min
s,s=1,s=D k=1ck·xk
sT ·X(c)
2
, (3)
where X(c) has as columns x(c)
i with i = 1, . . . , D. Then, x
(m)= 1
DX·1 and X(c)= [x
1−x(m)|...|xD−x(m)] =X−x(m)·1T .It follows that
X(c)=X·P with P=I− 1
D1 . (4)
Obviously, Di=1x(ic)=0 . Hence, the nullspace N ULL(x1(c),x(2c), . . . ,x(Dc)) is non trivial. All vectorss∈ N ULL(x(1c),x2(c), . . . ,x(Dc)) will minimize J(X|s). In the next theorem, we show that the problem given by (3) has at least one solution.
Theorem 1. Assumex1,x2, . . . ,xDare linearly independent. Then, there exists
s= 0in N ULL(x(1c),x2(c), . . . ,x(Dc)) such thats is in the span of the inputs xi,
i= 1, . . . , D.
Proof. A solution s = 0 and c = [c1, c2, . . . , cD]T ∈ RD of the system of equations:
sT ·X(c)=0 (5)
s=X·c (6)
will also satisfy the theorem and solve the optimization criterion of problem (3). Indeed, (5) is equivalent to the existence of s such that s ∈ N ULL(x(1c),
x(2c), . . . ,xD(c)) and (6) specifies thatsis in the span of the inputsxi ands=0.
Let us substitutesfrom (6) andX(c)from (4) in (5):
⇒cT·XT ·X·P=0 (7)
cT =dT ·(XT ·X)−1. (8)
Therefore, (7) becomes:dT·P=0with
d=ζ1 (9)
andζ∈R.When substituting (9) into (8): c=ζ(XT ·X)−1·1.Hence:
ˆ
s=ζX·(XT ·X)−1·1. (10)
Then, ˆsˆs is a solution to (6) and (5) for all ζ ∈ R . Therefore, any MIA problem with linearly independent inputs has a solution given by (10). An al-ternative interpretation of the MIA solution ˆˆss is that of a direction in the
N-dimensional space which minimizes the variance of the projections of all points
xi, i= 1, . . . , D.
Should the inputs be translated by a constantλ∈R, i.e.
xi←xi−λ1 ∀i (11)
then the solution of J(X|s) changes. Indeed, it can be easily proven that the criterion (1) itself is invariant to a translation (11), however the constraint of (2) will require that the solution ˆsis in the span ofxi.
2.2 Example with Synthetic Data
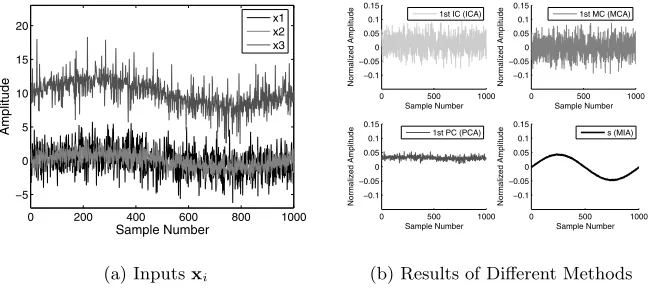
A synthetic example is given below to compare MIA, MCA, PCA and Indepen-dent Component Analysis (ICA) (see [12]). Assume three inputs given by:
x1= f1 + f2
x2= f1 −0.5f2
x3= 2f1 + 2f3+101
wheref1= sin(2NΠi) i= 1, . . . , N ,f2is Gaussian noiseN(0,1) andf3is
Lapla-cian noise. The inputs and results of the methods are illustrated in Fig. 1. The MIA solution closely approximatesf1, in contrast to the other methods.
3
Application: Text Independent Speaker Verification
0 200 400 600 800 1000 −5
0 5 10 15 20
Sample Number
Amplitude
x1 x2 x3
(a) Inputsxi
0 500 1000
−0.1 −0.05 0 0.05 0.1 0.15
Sample Number
Normalized Amplitude
0 500 1000
−0.1 −0.05 0 0.05 0.1 0.15
Sample Number
Normalized Amplitude
0 500 1000
−0.1 −0.05 0 0.05 0.1 0.15
Sample Number
Normalized Amplitude
0 500 1000
−0.1 −0.05 0 0.05 0.1 0.15
Sample Number
Normalized Amplitude
1st IC (ICA) 1st MC (MCA)
1st PC (PCA) s (MIA)
[image:5.595.133.457.151.300.2](b) Results of Different Methods
Fig. 1. (a) Inputs xi are linear combinations of three basis functions. (b) Signals
extracted using ICA, MCA, PCA and MIA. The MIA result, withλ= 0, is meaningful.
3.1 Data Model
A speech signal can be modeled as an excitation that is convolved with a linear dynamic filter which represents the vocal tract. The excitation signal can be modeled for voiced speech as a periodic signal and for unvoiced speech as random noise. It is common to analyze the voiced and unvoiced speech separately [15]. In this example, only the voiced speech is used for speaker recognition. Let E(p),H(p)andV(p)be the spectral representations of the excitation, vocal tract
filter and the voiced signal parts of a personp respectively. Moreover, let M represent speaker independent signal parts in the spectral domain (i.e. recording equipment, environment, etc.). Therefore, the data can be modeled as:
V(p)=E(p)·H(p)·M. (12)
By cepstral deconvolution, the model can be represented as a linear combination of its basis functions:
x(ip)= logV(p)= logE(p)+ logH(p)+ logM. (13)
This model suggests that we could use MIA to extract a function that repre-sents the speaker’s signature. In practice, we take speech segments of about one second as MIA inputs x(ip) in order to achieve spectral accuracy. An example of inputsx(ip)is shown in Fig. 2(a). Therefore, MIA will extract signatures that capture typical speaker dependent correlations in the logarithmic spectral do-main. Speaker independent signal parts M will be minimized if they are not equally present in all MIA inputs.
3.2 MIA-Based Text Independent Speaker Verification
We partition the training and testing data for each personpintoD= 8 segments
using MIA. The cosine distances between the testing data signatures and training data signatures is used as a measure of similarity. A matrix that represents the cosine distances between all signatures in the database is illustrated in Fig. 2(b). Let NFA andNCA represent the number of false and correct acceptances
re-spectively.NUis the number of registered users. The speaker recognition results
are evaluated by a comparison of the false acceptance rate FA with the false rejection rate FR, calculated as follows:
FA = NFA
N2
U−NU
and FR =NU−NCA
NU
. (14)
NFA and NCA result from the entire database by testing each learned speaker
signature against all test speaker signatures. This means that a number ofNU2
tests is performed, includingNU correct combinations andNU2−NUimpostors.
By changing a threshold value, more people can be accepted which results in a trade off between FA and FR. The FA versus FR plot of this example is illustrated in Fig. 3(a). The equal error rate (EER), where FA equals FR, is used to compare to previous results in [14].
0 2 4 6 8
−20 −15 −10 −5 0
Frequency [kHz]
Logarithmic Amplitude
(a) Inputsxiin the Fourier Domain
Learned Signature of Speaker Nr.
Test Signature of Speaker Nr.
0 50 100 150
0
50
100
150
[image:6.595.127.454.376.504.2](b) Similarity Scores
Fig. 2. MIA applied to text independent speaker recognition. (a) Representation of
input data{x(ip)}i=1,...,8, given by speech segments of a single speakerp in the
loga-rithmic Fourier domain. (b) Matrix of similarity scores between different signatures. Bright gray stands for high and dark gray for low similarity between signatures.
3.3 Results
0 5 10 15 20 25 0
5 10 15 20
False Acceptance Rate
False Rejection Rate
Speaker Dependent Variance Threshold Trace Dependent, Equal Threshold
(a) FA vs. FR percentage
0 2 4 6 8
−0.1 −0.05 0 0.05 0.1 0.15
Frequency [kHz]
Normalized Amplitude
0 2 4 6 8
−0.1 −0.05 0 0.05 0.1 0.15
Frequency [kHz]
Normalized Amplitude
0 1 2 3 4 5 6 7 8
−0.1 −0.05 0 0.05 0.1 0.15
Frequency [kHz]
Normalized Amplitude
s (MIA) 1st MC (MCA) 1st PC (PCA)
[image:7.595.133.452.151.295.2](b) Results of Different Methods
Fig. 3. Results of MIA-based text independent speaker verification. (a) False rejection
(FR) versus false acceptance (FA) rate. (b) Speaker signature extracted by MIA from
{x(ip)}i=1,...,8. Also plotted are the first minor component (MCA) and the first principal
component (PCA) of the data.
from all signatures to focus on the evaluation of differences. The comparison of the MIA-based signature with the 1st minor component and the 1st principal component is illustrated in Fig. 3(b). Note visually that only MIA extracts signal amplitudes in accordance with the well known result that low frequencies contain most information about a speaker. In order to alter the proportion between FA and FR, two different thresholds were used. First, a trace dependent threshold treats every user the same. Secondly, the variance dependent threshold uses in-formation about the similarity between test cases to learn a speaker dependent weighting. The EER of this MIA-based text independent speaker recognition system was 2.9 % for the variance dependent threshold and 5.4 % for a trace dependent threshold. For a similar experiment, [14] reports EER’s between 4.3 % and 6.1 % using ICA and PCA features. Here it has to be noted that this test was done with 462 speakers. However, one person was represented by 16 or 32 features of 128 or 256 samples length. On the other hand, MIA only uses a single signature of 256 sampes length per speaker.
4
Conclusion
discriminate between inputs and bias towards a result which correlates only with a subset of them. Further work will analyze the robustness of MIA to noise. More-over, the effect of changes in the span constraint, or the choice of a basis function set, will be explored.
Acknowledgments
We would like to thank Radu Balan for his invaluable input to this paper.
References
1. Jolliffe, I.T.: Principal Component Analysis, 2nd edn. Springer, Heidelberg (2002) 2. Ramsay, J.O., Silverman, B.W.: Functional Data Analysis, 2nd edn. Springer,
Hei-delberg (2006)
3. Oja, E.: Principal components, minor components, and linear neural networks. Neural Networks 5, 927–935 (1992)
4. Tipping, M.E., Bishop, C.M.: Probabilistic principal component analysis. Journal of the Royal Statistical Society 61(3), 611–622 (1999) (Series B)
5. Williams, C., Agakov, F.: Products of gaussians and probabilistic minor compo-nents analysis. Neural Computation 14(5), 1169–1182 (2002)
6. Thompson, P.A.: An adaptive spectral analysis technique for unbiased frequency estimation in the presence of white noise. In: Systems and Computers, pp. 529–533 (1980)
7. Xu, L., Oja, E., Suen, C.Y.: Modified hebbian learning for curve and surface fitting. Neural Networks 5, 441–457 (1992)
8. Moon, T.K., Stirling, W.C.: Mathematical methods and algorithms for signal pro-cessing. Prentice-Hall, Upper Saddle River, NJ (2000)
9. Welling, M., Agakov, F., Williams, C.K.I.: Extreme components analysis. In: Thrun, S., Saul, L., Sch¨olkopf, B. (eds.) Advances in Neural Information Processing Systems 16, MIT Press, Cambridge, MA (2004)
10. Rao, Y.N., Principe, J.: Efficient total least squares method for system modeling using minor component analysis. In: Proceedings of international workshop on neural networks for signal processing, pp. 259–268 (2002)
11. Horn, R.A., Johnson, C.R.: Matrix Analysis. Cambridge University Press, Cam-bridge (1999)
12. Hyv¨arinen, A., Karhunen, J., Oja, E.: Independent component analysis. John Wiley and Sons, Chichester (2001)
13. Garofolo, J.S., Lamel, L.F., Fisher, W.M., Fiscus, J.G., Pallett, D.S., Dahlgren, N.L., Zue, V.: Timit acoustic-phonetic continuous speech corpus. CDROM (1993) 14. Rosca, J., Kofmehl, A.: Cepstrum-like ica representations for text independent
speaker recognition. In: ICA, pp. 999–1004 (2003)