NUTRITIVE AND NON-NUTRITIVE
BLOOD FLOW IN MUSCLE
By
Joanne Maree Youd B.Sc.(Hons)
- - -
-- -- - - --- -Submitted-in-fulfilment-of-the-requirements-for the-degree-of---- -
-~Doctor of Philosophy
Biochemistry Department
University of Tasmania
DECLARATION
This thesis contains no material which has been used for the award of any other degree or graduate diploma in any tertiary institution and, to the best of my knowledge and belief, contains no material previously published or written by another person, except where due reference is made in the text of the thesis.
J.M. Youd
AUTHORITY OF ACCESS
This thesis may be made available for loan and limited copying in accordance with the Copyright Act 1968.
ACKNOWLEDGEMENTS
First of all I would like to thank my PhD supervisor, Professor Michael Clark, for all his advice, knowledge and patience throughout the course of my candidature.
Secondly, I thank Dr Steve Rattigan for all his help over the past couple of years, particularly completing some outstanding experiments (in particular the TNF work) for me when my allergy to rats became so severe that it was necessary to avoid these animals entirely. In addition, I would like to thank Dr Andrew Clark and Professor Clark for allowing me to use some of their laser Doppler flowmetry work in this thesis.
Thanks must also go to John Newman for all his assistance with experiments and difficult calculations and statistics, Dr Adrian West for his help and encouragement over the past few years, Carla Di Maria, Lucy Clerk, Michelle Wallis, Michelle Vincent, Maree Smith, Geoff Appleby, Julie Harris, and the rest of the Biochemistry department and Molecular biology unit for their friendship and help throughout the past 3 years.
I would also like to thank John Driessen for his infinite wisdom and advice in recent years and Andrew Barnden for all his support and friendship.
Finally, I wish to thank my grandmother, Judith Youd for all her love and
PUBLICATIONS
Academic Publications:
Wallis MG, Appleby GJ, Youd JM, Clark MG, and Penschow ID (1998) Reduced glycogen phosphorylase activity in denervated hindlimb muscles of rat is related to muscle atrophy and fibre type. Life Sci 64(4): 221-228.
Youd JM, Newman JMB, Clark MG, Appleby GJ, Rattigan S, Tong ACY, and Vincent MA. (1999) Increased metabolism of infused 1-methylxanthine by working muscle. Acta Physiol Scand 166: 301-308.
Clark MG, Rattigan S, Clerk LH, Vincent MA, Clark ADH, Youd JM, and Newman JMB. (1999) Nutritive and non-nutritive blood flow: rest and exercise. Acta Physiol Scand 168: 519-530.
Youd JM, Rattigan S, and Clark MG. (2000) Acute impairment of insulin-mediated capillary recruitment and glucose uptake in rat skeletal muscle in viva by TNFa. Diabetes (In Press).
Clark ADH, Youd JM, Rattigan S, Barrett EJ, and Clark MG. (2000) Heterogeneity
of laser Doppler flowmetry signal responses in perfused rat muscle: Evidence for nutritive and non-nutritive regions of blood flow. Am J Physiol (Submitted May 2000).
Other Articles:
Clark MG, Rattigan S, and Youd JM. (Ma,y, 1998) Hormone and substrate delivery to muscle. Australian Society for Biochemistry and Molecular Biology (ASBMB) newsletter. Showcase on research section.
Papers at Scientific Meetings:
American Diabetes Association Meeting. San Antonio, USA. June 2000. Stephen Rattigan, Joanne M Youd and Michael G Clark.
Acute impairment of insulin-mediated capillary recruitment and glucose uptake in rat skeletal muscle by TNFa.
American Diabetes Association Meeting. San Antonio, USA. Abstract accepted for publication in conference proceedings, June 2000.
Michael G Clark, Joanne M Youd, John MB Newman, and Stephen Rattigan.
Sciatic nerve severance produces insulin resistance without changes in 1-MX metabolism.
4 th International Diabetes Federation Western Pacific Region Congress "Diabetes
towards 2000". Sydney. August 25-28, 1999.
Jenny D Penschow, Michelle G Wallis, Joanne MY oud and Michael G Clark.
Estradiol increases capillary:fibre ratio in muscles of insulin resistant hyperandrogenic female rats.
Cambridge, UK, May 1999.
Michael G Clark, Stephen Rattigan, Joanne M Youd and Andrew DH Clark.
Australian Society for Medical Research (ASMR) Conference, Hobart, Tasmania, Nov 1998.
Stephen Rattigan, Joanne M. Youd and Michael G. Clark. Insulin action and blood flow within skeletal muscle.
ASBMB Conference, Adelaide, South Australia, Sep 28-0ct 1, 1998.
Invited Speaker in Symposium: Recent Advances in Fuel Homeostasis by Metabolism and Molecular Medicine Special Interest Group (Ml\.11\1SIG).
Joanne M Youd, Stephen Rattigan, Andrew DH Clark and Michael G Clark. Blood flow and glucose uptake by muscle.
161h International Diabetes Federation (IDF) Congress. Helsinki, Finland, July 20-25, 1997. Abstracts published in Diabetologia 40 (Supplement 1) I-IV, Al-A722, 1997. Joanne M Youd, Stephen Rattigan, Michelle A Vincent, and Michael G Clark.
Sciatic nerve severance produces an apparent haemodynamic change and insulin resistance.
Biochemistry of Exercise. lOth International Conference. "Membranes, muscle and exercise". University of Sydney, July 15-19, 1997.
John MB Newman, Michael G Clark, Stephen Rattigan, Geoffery Appleby, Michelle A Vincent, Joanne M Youd, and Alex CY Tong.
Effect of muscle contraction on metabolism of 1-MX and L-arginine in the constant flow perfused rat hindlimb.
Society Membership:
CONTENTS
Declaration
Authority of Access Acknowledgements Publications
Abbreviations List of Figures List of Tables Abstract
CHAPTERl General Introduction
1.1 Early Evidence for Two Circulatory Routes in Skeletal Muscle
1.2
Location of Non-Nutritive Capillaries1.3 Vasoconstrictors are Capable of Controlling Muscle Metabolism
1.4 Possible Reasons for the Existence of Two Flow Routes in Skeletal Muscle
1.5
1.6
1.4.1 Under Resting Conditions 1.4.2 During Exercise
Non-Nutritive Flow Route Measurement
Nutritive Flow Route Measurement
Page ii ii iii iv xiii xv xv iii xx
1
1
2
5
8 K~ 10
13
1.7 1-Methylxanthine Metabolism and Measurement of Capillary Recruitment
1.8 Laser Doppler Flowmetry as a Tool for Measuring Relative Nutritive and Non-Nutritive Flow
1.9 Aims of the Present Study
CHAPTER2 Materials and Methods
2.1 Rat Hindlimb Perfusion Studies 2.1.l Animals
2.1.2 General Surgical Procedures 2.1.3 Perfusion Media
2.1.3.1 Erythrocyte-Free Hindlimb Perfusions 2.1.3.2 Red Blood Cell Perfusions
2.1.4 General Perfusion Procedure
2.1.4.1 Calculation of Oxygen Uptake 2.1.5 Blood Perfusion Procedure
2.1.5.l Determination of Oxygen Consumption in Blood Perfusions
2.2 In Vivo Studies 2.2.1 Animals
2.2.2 General Surgical Procedures
2.2.3 Euglycaemic Hyperinsulinaemic Clamp
2.2.4 1-Methylxanthine lnfasion during In Vivo Experiments 2.2.5 Glucose Assay
2.2.6 Insulin ELIZA Assay 2.2.7 TNF ELIZA Assay
2.3 Analytical Methods
2.3.1 1-Methylxanthine Analysis by HPLC 2.3.1.1 Treatment of Peifusate Samples 2.3.1.2 Treatm~nt of In Vivo Blood Samples 2.3.1.3 HPLC Analysis of Purines
2.3.2 2-Deoxyglucose Uptake 2.3.2.1 Hindlimb Peifusions 2.3.2.2 In Vivo Experiments
2.3.3 Measurement of Total Flow by Microsphere Entrapment
2.3.3.1 Hindlimb Peifusions
2.3.3.2 Microsphere Distribution Assay
CHAPTER3 The Effect of Exercise from Sciatic Stimulation on 1-MX Metabolism in the Blood Perfused Rat Hindlimb
3.1 Introduction
3.2 Methods
3.2.1 Sciatic Nerve Exposure for Stimulation 3.2.2 Hindlimb Peifusions
3.2.3 Measurement and Calculation of Oxygen Uptake 3.2.4 Muscle Incubations
3.2.5 Xanthine Oxidase Activity 3.2.6 Statistical Analysis
3.3
Results3.3.1 Changes to Total Blood Flow
3.3.2 Peifusion Pressure, Oxygen Uptake and Lactate Release
3.3.3 1-MX Metabolism
3.4
3.3.4 Metabolism of the Working Muscles 3.3.5 Xanthine Oxidase Assay
Discussion
CHAPTER4 The Effect of NE and SHT on Laser Doppler Flowmetry in Blood Perfusion
4.1 Introduction
4.2 Methods
4.2.1 Hindlimb Perfusions 4.2.2 Laser Doppler Flowmetry
4.2.2.1 Suiface Measurements 4.2.2.2 Within Muscle Measurements 4.2.3 Vasoconstrictor Infusions
4.2.4 Measurement of Oxygen Uptake 4.2.5 Microscopy
4.2.6 Statistical Analysis
4.3 Results
4.3.l Surface Measurements 4.3.2 Implantable Probes 4.3.3 Sustained Infusions 4.3.4 Biological Zero
4.4 Discussion
41
45
46
51
51
52
52
52
52
54
55
56
56
56
56
56
59
65
65
CHAPTERS Insulin Stimulates Laser Doppler Flow Signal In Vivo Consistent with Nutritive Flow Recruitment
5.1
Introduction5.2
Methods5.2.1 Laser Doppler Studies In Vivo
5.3
Results5.3.1 Glucose Metabolism During the Insulin Clamps
5.3.2 Clamp Experiments for LDF Signal by Scanning Probe 5.3.3 Stationary LDF Probe
5.4
DiscussionCHAPTER6 Sciatic Nerve Severance-Induced Insulin Resistance in Muscle Without Loss of Capillary Exposure
6.1
Introduction6.2
Methods6.2.I Sciatic Nerve Severance Surgical Procedure 6.2.2 Hindlimb Peifusions
6.2.3 Statistical Analysis
6.3
Results6.3.l 2-Deoxyglucose Uptake
6.3.2 1-Methylxanthine Metabolism and Fluorescent Microsphere Distribution
6.4
DiscussionCHAPTER 7 Acute Impairment of Insulin-Mediated Capillary Recruitment and Glucose Uptake in Rat
Skeletal Muscle In Vivo by TNFa.
7.1
Introduction7.2
Methods7.2.1 Experimental Procedures 7.2.2 Statistical Analysis
7.3
Results7.3.l Haemodynamic Effects 7.3.2 Glucose Metabolism
7.3.3 Arterial Plasma TNF Levels 7.3.4 [3H] 2-Deoxyglucose Uptake 7.3.5 1-MX Metabolism
7.4
DiscussionCHAPTERS Final Discussion
8.1
Summary of thesis8.2
Other Studies8.3
Towards the FutureREFERENCES
99
99
101
101
101
103
103
103
107
107
108
111
113
113
117
121
A-V bpm
BSA
CL
DL d.p.m. EDL g GastrocHPLC
IMGU Ins i.p. IU i.v KH L LDF ml min NE NIDDM p PCA Plan P02 Pa02 Pv02 R'g sABBREVIATIONS
arteriovenous beats per minute bovine serum albumin contralateral leg denervated legdisintegrations per minute extensor digitorum longus gram
gastrocnemius
high performance liquid chromatography insulin-mediated glucose uptake
insulin intraperitoneal international units intravenous Krebs Henseleit litre
laser Doppler flowmetry millilitre
minute
norepinephrine (noradrenaline)
non-insulin dependent diabetes mellitus probability
perchloric acid plantaris muscle
oxygen partial pressure
arterial oxygen partial pressure venous oxygen partial pressure
Sal saline
SE standard error
Sol soleus
Tib tibialis anterior muscle
TNF tumour necrosis factor
a
V02 oxygen consumption
2DG 2-deoxy-D-[1-3H]glucose
5-HT 5-hydroxytryptamine (serotonin)
Ii change in
µI micro litre
µM micromolar
CHAPTERl Figure 1-1 Figure 1-2 Figure 1-3 CHAPTER2 Figure 2-1 Figure 2-2 CHAPTER3 Figure 3-1 Figure 3-2 Figure 3-3 Figure 3-4 Figure 3-5
LIST OF FIGURES
Vascular arrangement of the rabbit tenuissimus muscle. Possible method of amplifying nutrient delivery during exercise.
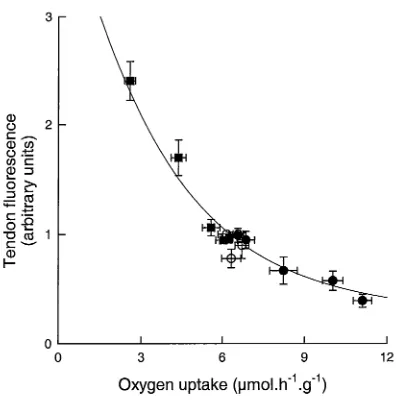
Relationship between muscle tendon vessel flow and oxygen uptake (as influenced by infusion of
vasoconstrictors).
Pictorial view of perfused hindlimb surgical ligations. Perfusion apparatus for the constant-flow perfusions.
Experimental protocol for sciatic nerve stimulation experiments.
Effect of exercise on the distribution of fluorescent microspheres to the calf and thigh muscles in the perfused rat hindlimb.
Effect of exercise on perfusion pressure (a), oxygen uptake (b) and lactate release ( c) in the perfused rat hindimb.
CHAPTER4 Figure 4-1 Figure 4-2 Figure 4-3 Figure 4~4 Figure 4-5 Figure 4-6 Figure 4-7 Figure 4-8 CHAPTERS Figure 5-1 Figure 5-2 Figure 5-3
General areas chosen for positioning of LDF probes either on or impaled into muscles of the perfused rat hindlimb.
Typical trace recorded using macro surface probe. Relationship between peak changes in oxygen uptake and LDF signal from the surface macro probe for the constant-flow perfused rat hindlimb.
Distribution of LDF signal changes from impaled micro probes.
LDF tracings for NE-positive (A), NE-negative (B) and mixed (C) sites from impaled micro probes.
LDF tracing from NE-positive (top, left) and
NE-negative (bottom, left) sites using micro impaled probes following the constant infusion of 83 nM norepinephrine (filled bar).
LDF tracing from NE-positive (top, left) and NE-negative (bottom, left) sites using micro impaled probes following the constant infusion of 750 nM serotonin (filled bar). Polymer tube studies in vitro.
Total femoral blood flow and scanning LDF measurement of lateral surf ace of thigh muscles of anaesthetised rats
following insulin/glucose, epinephrine or saline infusions. Representative scans of LDF before (A) and after (B)
insulin in the same animal.
Time course for changes in femoral blood flow (A) and for stationary probe LDF signal (B) during a
CHAPTER6 Figure 6-1 Figure 6-2 Figure 6-3 Figure 6-4 CHAPTER7 Figure 7-1 Figure 7-2 Figure 7-3 Figure 7-4 Figure 7-5 CHAPTERS Figure 8-1
Effect of sciatic nerve severance on 2-deoxyglucose uptake by individual muscles of the perfused hindlimb.
Representative trace for time course changes in oxygen uptake and perfusion pressure for hindlimb perfusions.
Perfusate flow in the denervated and contra-lateral control
90
92
leg of the perfused hindquarter from microsphere entrapment. 93
Time course for the metabolism of infused 1-MX.
Study design.
Hindlimb femoral blood flow, mean arterial blood pressure and hindleg vascular resistance at end of experiments (120 min).
Systemic and hindleg glucose values of control groups (saline or TNF alone) and insulin clamp groups
(insulin or TNF
+
insulin) at 120 min.[3H] 2-Deoxyglucose uptake values for soleus and plantaris muscle.
Systemic and hindleg 1-MX values of control groups (saline or TNF alone) and euglycaemic insulin clamp groups (insulin alone or insulin
+
TNF).Correlation between 1-MX disappearance and LDF in viva in the presence of insulin, epinephrine and saline.
CHAPTERl
Table 1-1
Table 1-2
CHAPTER3
Table 3-1
Table 3-2
CHAPTER4
Table 4-1
Table 4-2
CHAPTERS
Table 8-1
LIST OF TABLES
Classification of vasoconstrictors into Type A or Type B categories using their effects in the constant-flow perfused rat hindlimb.
Summary of the effects of Type A and Type B vasoconstrictors in the constant-flow perfused rat hindlimb.
Distribution of fluorescent microspheres in the perfused rat hindlimb to various tissues as percentage of total recovered.
Venous concentration (µM) of purines in the perfused rat hindlimb.
Properties of LDF signal from the randomly positioned muscle micro probes.
Characteristics of the NE-positive sites.
Change in relative microvascular blood volume due to infusion of either insulin or saline, as measured using contrast-enhanced ultrasound of the rat hindleg.
Page
6
7
40
45
62
64
Table 8-2
Table 8-3
Changes in microvascular volume (MV VOL) and velocity (MV VEL), forearm blood flow, and glucose uptake as a result of forearm insulin infusion in healthy human subjects.
Effect of serotonin on triglyceride (TO) hydrolysis, V02 and perfusion pressure in the perfused rat
hindlimb at constant-flow
119
ABSTRACT
The idea that two vascular routes exist within, or closely associated with, skeletal muscle (nutritive and non-nutritive blood flow) dates back to early last century (1900's). Recent work in the past decade or two in our laboratory as well as contributions by other researchers has shed more light on the anatomical nature and functional role of the skeletal muscle vasculature and shown how changes to the blood flow distribution within skeletal muscle occur during different physiological states, e.g. exercise and insulin resistance.
Until recently, an effective and non-invasive method to measure the proportion of nutritive to non-nutritive blood flow within muscle did not exist. Such a method would prove invaluable as a general technique to assess the blood flow distribution within skeletal muscle and would have definite clinical application. Recent studies from this research group have focussed on investigating the use of 1-methylxanthine (1-MX) metabolism as an indicator of nutritive flow, or capillary recruitment, within skeletal muscle. It has been shown that capillary recruitment increases during insulin infusion in viva and this increase is blocked when acute insulin resistance is induced by
a
methyl serotonin, an agent known to direct muscle blood flow to the non-nutritive route.This project had two main aims. Firstly, to further investigate the use of the 1-MX
method in insulin resistant rats in viva (tumour necrosis factor
a,
TNF), and in hindimb perfusion (sciatic nerve stimulation and sciatic nerve severance). Secondly, to develop a new technique for the measurement of nutritive and non-nutritive blood flow based on laser Doppler flowmetry (LDF), in the hope that concordance between the two methods (1-MX andLDF) would be attained.1-MX metabolism by the working muscles. Sciatic nerve severance, a rat model of insulin resistance, did not cause any changes in 1-MX metabolism and so the insulin resistance observed in this model did not appear to be a caused by changes in blood flow distribution.
Changes seen in LDF signal under a number of conditions were similar to the changes seen in 1..:MX metabolism. During rat hindimb blood perfusion, vasoconstrictors known to increase and decrease nutritive and non-nutritive blood flow in skeletal muscle produced corresponding changes in laser Doppler signal. In addition, in vivo where insulin is known to increase capillary recruitment as measured by 1-MX metabolism, the LDF signal increased. Epinephrine, which produces large increases in total blood flow to the hindlimb but does not stimulate glucose uptake, produced no change in capillary recruitment or LDF.
CHAPTERl
General Introduction
1.1 Early Evidence for Two Circulatory Routes in Skeletal Muscle
Studies by a number of groups, particularly through the middle of last century, led to the idea that two distinct blood flow pathways exist within skeletal muscle (Barcroft 1963, Barlow et al. 1961, Pappenheimer 1941, Walder 1953, Walder 1955). Of these two pathways, one was thought to lead to capillaries that were in intimate contact with the muscle fibres while the other flow route went to a region without any significant nutrient delivery. The majority of the evidence available was based around the fact that total blood flow into muscle did not correlate with:
a) metabolic or heat transfer processes or
b) clearance of radioactive substances which were either infused or injected intramuscularly.
One particular study by Pappenheimer, published in 1945 clearly demonstrated that flow and metabolism are not always directly related (Pappenheimer 1941). Using the isolated constant-pressure perfused dog hindlimb or gastrocnemius muscle, Pappenheimer showed that when blood flow was reduced by stimulation of . vasoconstrictor nerves, the A-V 02 difference decreased. Conversely, if blood flow
was reduced to the same extent using low dose epinephrine, the A-V 02 difference·
increased. Further to this, even though the flow rates were decreased to the same degree, the difference in temperature between the arterial and venous blood was increased with epinephrine but decreased with nerve stimulation (Pappenheimer 1941). Pappenheimer concluded from this work that the oxygen saturation of the venous blood from resting muscle was not simply a measure of metabolic rate, but an indicator of the blood flow heterogeneity within the muscle.
Pappenheimer (Barlow et al. 1958, Walder 1955). Since the effects observed were not consistent with commonly held theories on muscle microcirculation, and were not attributable to direct effects on skeletal muscle metabolism, an explanation for the heterogeneity of isotope clearance rates was required. One postulation was that skeletal muscle contained arteriovenous anastomoses, similar to those seen in rabbit's ears, and cat's stomachs, which were 50 to 100 µm in diameter. However, further work denied the presence of large shunts in skeletal muscle. This evidence included failure to pass injected wax microspheres of 20, 30 or 40 µm either under basal conditions or during stimulation of vasodilator nerves (Piiper and Rosell 1961). Also, an extensive microscopic examination of skeletal muscle by Hammersen in 1970 did not find any evidence of arteriovenous shunts in muscle from a number of mammalian species including dogs, monkeys and rabbits (Hammersen 1970), even though another researcher claimed they existed in human skeletal muscle vascular beds (Saunders et al. 1957).
1.2 Location of Non-Nutritive Capillaries
blood flow to the venous, thereby bypassing the muscle fibres themselves (Grant and Wright 1970). These capillaries were dilated by acetylcholine and histamine but constricted by norepinephrine or epinephrine and did not respond to body temperature changes, and therefore were unlikely to be directly involved in body temperature regulation.
Muscle
Connective
tissue
Figure 1.1 Vascular arrangement of the rabbit tenuissimus muscle.
The transverse arteriole provides blood to both the capillaries in the muscle tissue proper and the adjacent connective tissue (modified from Borgstrom et al. 1988).
Further work from these researchers using the rabbit tenuissimus muscle revealed that
topically applied isoproterenol (13-adrenergic agent) led to redistribution of flow from
One question, which comes to mind at this point, is whether other skeletal muscles, which are cylindrical in nature, display the same vascular arrangement as the rabbit tenuissimus muscle. Myrhage and Eriksson have shown that the vascular anatomy of the tenuissimus muscle exists as a basic unit in hindleg musculature. In fact, this arrangement of the vasculature has been seen in several muscles of different species, including the rat (Eriksson and Myrhage 1972, Grant and Wright 1970), cat (Myrhage and Eriksson 1980), and monkey (Hammersen 1970). Furthermore, recent studies from our laboratory suggest that these connective tissue vessels may be nutritive for-connective tissue and the associated fat adipocytes, even though they are non-nutritive for the muscle itself (Clerk et al. 2000). This is possible since fat cells have significantly lower metabolic requirements than muscle but higher potential for hydrolysing circulating triglyceride.
1.3 Vasoconstrictors are Capable of Controlling Muscle Metabolism
Table 1-1 Classification of vasoconstrictors into Type A or Type B categories using their effects in the constant-flow perfused rat hindlimb (modified from Clark et al. 1995).
Type A Vasconstrictors
Low dose norepinephrine ( <100 nM) Angiotensin II
Phenylephrine
Vasopressin
Capsaicin ( < 1.0 µM)
Sympathetic nerve stimulation(< 4 Hz)
Type B Vasoconstrictors
High dose norepinephrine (> 100 nM) Serotonin
Capsaicin (> 1.0 µM)
Sympathetic nerve stimulation(> 4 Hz)
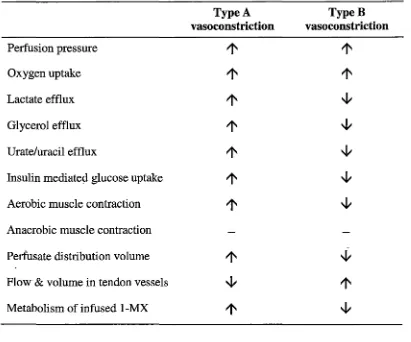
Table 1-2 Summary of the effects of Type A and B vasoconstrictors in the
constant-flow perfused rat hindlimb.
Type A TypeB
vasoconstriction vasoconstriction
Perfusion pressure
1'
1'
Oxygen uptake
1'
1'
Lactate efflux
1'
~Glycerol efflux
1'
~Urate/uracil efflux
1'
~Insulin mediated glucose uptake
1'
~Aerobic muscle contraction
1'
~Anaerobic muscle contraction
Perfusate distribution volume
1'
~FloW' & volume in tendon vessels ~
1'
Metabolism of infused 1-MX
1'
~ [image:28.566.86.497.147.489.2]buffer, there was no effect on muscle insulin-mediated glucose uptake or contractility (Dora et al. 1994, Rattigan et al. 1993, Rattigan et al. 1995).
Another important point to note is that Type A and B vasoconstrictors appear to act at different vascular receptor sites. In addition, the sites responsible for Type A and B vasoconstriction can be distinguished by their metabolic requirements for constriction. Type A vasoconstrictors rely on the presence of extracellular calcium and removal of this, or inhibition of oxidative metabolism (using cyanide, azide or anoxic perfusion) abolishes their action, whereas Type B vasoconstrictors are not affected by these conditions (Clark et al. 1994, Dora et al. 1992).
In an attempt to explain the opposite metabolic effects of Type A and Type B vasoconstrictors, work focussed on looking at the skeletal muscle vasculature. One possible explanation for the differing metabolic effects seen, could be that flow switches between red and white muscles, skin, adipose tissue and bone, which all have differing metabolic requirements. However, studies using fluorescent microspheres to determine blood flow distribution between tissues, show that Type B-mediated inhibition of oxygen consumption
did
not correlate with any changes to perfusate flow distribution, either between different muscle fibre types or between muscle and bone, skin or adipose tissue (Rattigan et al. 1997a). It was concluded from this that the changes in vascular flow route seen with Type B vasoconstriction'
are likely to be occurring within the muscle tissue itself leading to reduction in functional capillary surf ace area available for nutrient artd gas exchange (Rattigan et al. 1995).
1.4 Possible Reasons for the Existence of Two Flow Routes in Skeletal Muscle
1.4.1 Under Resting Conditions:
(Clark et al. 2000). So, basal energy consumption (as measured by oxygen uptake and lactate output) would increase as the proportion of total flow that is nutritive increases. Opposingly, basal metabolism would decrease as the proportion of nutritive flow decreases (Clark et al. 2000). As mentioned above, there are a number of vasomodulators, which act at specific sites along the vascular tree of muscle, thereby controlling the proportion of nutritive to non-nutritive flow within the muscle tissue. Under conditions of constant total flow, such as that seen in the constant-flow perfused rat hindlimb, vasoconstriction leading to reduced flow within the nutritive route would conversely result in a proportional increase in non-nutritive flow and vice versa. In a more physiological situation where constant pressure predominates, vasoconstriction of the non-nutritive route, for example, may not necessarily increase flow in the nutritive pathway, but it is likely that the proportion of nutritive flow will increase (Clark et al. 2000). In this situation, basal energy consumption will not increase whereas if vasoconstrictor activity is at sites leading to nutritive flow routes, then basal metabolism will decrease. Knowing this, it seems likely that when blood pressure is maintained constant in viva, basal metabolism can be controlled, to an extent, by vasoconstrictors controlling blood flow entry into the nutritive route. Further to this, vasodilators that control access to the nutritive flow route by opposing this vasoconstriction will play a major part in the basal metabolic rate for resting muscle. One possible reason for the existence of this non-nutritive route could be because it allows conservation of energy expenditure by the organism, thus conferring an evolutionary advantage over others of the same species. Yet to be examined is whether thyroid hormones and other agents capable of altering resting metabolism in muscle are able to do so by altering the proportion of nutritive to non-nutritive flow as well as by direct effects upon muscle metabolism (Clark et al. 2000).
triglycerides, the flow distribution is favouring the growth of fat cells and an overall lower basal metabolic rate. Furthermore, long term maintenance of this predominantly non-nutritive flow could lead to extensive fat cell deposition (Clerk et al. 2000).
1.4.2 During exercise:
On commencement of exercise, an increase in skeletal muscle blood flow occurs to supply adequate nutrients to the muscle while it is working, and to remove the waste products released. It is possible that the non-nutritive flow route provides a flow reserve, which when required can be used to amplify nutrient delivery and the exit of wastes (Clark et al. 1998). It is well accepted that during exercise, the blood flow to skeletal muscle increases under the influence of elevated sympathetic nervous system activity and elevated cardiac output by diversion of blood flow away from organs and tissues not immediately requiring a large amount of ~ow (e.g. gut), to the skeletal muscle (Segal 1992). This described amplification of blood flow would be over and above the increases in total flow seen during exercise. At this point in time the ratio of nutritive to non-nutritive flow in muscle at rest is unclear. From the data of Lindbom and Arf ors using the rabbit tenuissimus muscle model (Lindbom and Arf ors 1984), the ratio of nutritive:non-nutritive flow could be as high as 30:70 at rest. However, a more conservative position was reached by these authors_ stating that the ratio was closer to 80:20. Other work using the hydrogen clearance method suggests that the nutritive:non-nutritive flow ratio is as low as 0.16 in muscle at rest (Harrison et al. 1990).
-1998, Harrison et al. 1990). A schematic diagram of the possible amplification which can occur within the two vascular flow pathways during exercise is shown in Figure 1-2. In Figure 1-2(i), we assume that the nutritive:non-nutritive flow ratio is 50:50 at rest. As exercise starts, the ratio changes as a result of three influences in particular. Firstly, sympathetic nervous system vasoconstrictor activity increases leading to a change in ratio from 50:50 to 95:5 resulting in a nutritive amplification of 1.9 (via a Type A response, Clark et al. 1995). Secondly, total blood flow to the muscle increases by at least 3-fold due to increased cardiac output during exercise giving a total amplification of 5.7 (3 x 1.9). Thirdly, metabolic vasodilators released at the onset and throughout the duration of the exercise also contribute to increased blood flow to muscle nutritive capillaries (Clark et al. 1998). If the true resting situation is more like that depicted in Figure l-2(ii), as predicted by Lindbom and Arfors (1984) and Harrison et al. (1990), as well as work from our laboratory in the perfused rat hindlimb, then the potential for amplification becomes even larger.
L
100
N/NN= 1.0
Amplf= 1.0
100
N/NN= 0.43
Amplf= 1.0
[image:33.564.73.523.75.537.2]REST Increased Sympathetic NS Activity 100 5 19.0 1.9 100 19.0 3.17 EXERCISE Increased Total Blood Flow to Muscle with Increased sympathetic NS Activity 300 19.0 5.7 300 19.0 9.5 Excessive Sympathetic NS Vasoconstrictor Activity 300 1.0 3.0 300 1.0 5.0
Since blood flow to muscle remains elevated even after exercise has ceased, the proportion of nutritive to non-nutritive flow may play an important role in the recovery of muscle from exercise by allowing removal of waste products and supply of required nutrients to replenish the depleted energy stores. There have been a number of reports where post exercise metabolism is significantly elevated for extended periods (Bahr and Maehlum 1986, Bahr and Sejersted 1991, Borsheim et al. 1994, Ullrich and Yeater 1997). This phenomenon has not been explained by others and may result from exercise induced increases in the proportion of nutritive:non-nutritive flow, thus resetting the basal metabolic rate.
1.5 Non-Nutritive Flow Route Measurement
A number of research groups, including our own, have attempted to measure nutritive and non-nutritive flow. Friedman appears to be the first to attempt the measurement of non-nutritive flow and his method involved using indicator dilution patterns of infused marker substances to determine differing blood flow volumes (Friedman 1966, Friedman 1968, Friedman 1971). Radioactively labelled albumin was used to determine total blood flow and 86Rb used to derive the volume of non-nutritional blood flow. This method relied on two assumptions. Firstly, that rubidium was unable to exchange with the tissue while passing through the non-nutdtive route, where extraction was low, and secondly, that capillary permeability to rubidium was unlimited. Friedman estimated from this work that the volume of non-nutritive blood flow in the whole leg of a dog was 75% of the total blood volume (Friedman 1966). One limitation to this work however, was that Friedman did not take into account the blood flow to the skin of the leg. A number of approaches by others have involved measurement of nutritive flow and total flow by studies determining the removal of intramuscularly injected radioactive markers, and then estimating that non-nutritive flow made up the difference (Clark et al. 2000).
3
~
2
c..-Q) CJ)
(.) .-t=
CJ)
c
Q) :::J ~ 0
C"
:::J CU-
+-" ~c·-o
-e
"'C
cu
1c
-Q)
I-0 L.-~~~~---''--~~~~--'-~~~~~-'-~~~~~-'
0
3
6
9
12Oxygen uptake (µmol.h-
1.g-
1)Figure 1-3 Relationship between muscle tendon vessel flow and oxygen uptake (as influenced by infusion of vasoconstrictors).
[image:36.564.86.486.95.500.2]A recently published study by Clerk and others (2000) has provided important information about the non-nutritive flow route and perhaps a method of measuring relative flow in it (Clerk et al. 2000). Initially this study was focussed on assessing the effect of low nutritive flow (with corresponding high non-nutritive flow) on the clearance of triglyceride in the form of a chylomicron emulsion. This work was performed in the perfused rat hindlimb and results unexpectedly showed that clearance was increased in a predominantly non-nutritive flow situation. The findings suggest that lipoprotein lipase was more concentrated in the non-nutritive route than the nutritive route (Clerk et al. 2000). This begins to make sense in that it has been postulated (as mentioned previously in this introduction) that the non-nutritive flow route is involved in nourishing the fat cells located around the connective tissue of muscle, particularly in the area of the perimysium and epimysium (Myrhage and Eriksson 1980).
The work discussed above provides further evidence that the vessels termed 'non-nutriti ve' are located in the connective tissue closely assqciated with each muscle. Evidence suggests that these non-nutritive vessels are low resistance and high capacitance in character and thus capable of carrying a large amount of flow when the muscle is at rest. One point to note is that even though these connective tissue vessels may be larger than the nutrient supplying capillaries within the muscle, they are still incapable of allowing passage of 15 µm microspheres through them (Rattigan et al. 1997a).
1.6 Nutritive Flow Route Measurement
1973). Freis et al. found that during exercise, both nutritive and non-nutritive flow increased (Freis and Schnapper 1958). Another study by Brod et al. showed that under conditions of emotional stress, total blood flow increased without any corresponding change in nutritive flow (Brod et al. 1966).
1.7 1-Methylxanthine Metabolism and Measurement of Capillary Recruitment Work in this laboratory over the past few years has been focussed on the search for new methods to measure nutritive and non-nutritive flow in skeletal muscle. While these methods are initially being developed in rats, their future application in the clinical setting for assessment of microvascular function has been kept strongly in mind.
xanthine oxidase it was reasoned that measurement ·of 1-MX metabolism by XO could provide a way of determining capillary blood flow within skeletal muscle.
Initial work on the development of the 1-MX metabolism method was performed in the perfused rat hindlimb under conditions of constant total flow (Rattigan et al.
1997a). The metabolism of 1-MX under control conditions was compared with the metabolism in the presence of serotonin, a Type B vasoconstrictor. 1-MX itself has no haemodynamic effect upon the perfused rat hindlimb and the sum of the perfusate levels of 1-MX and 1-MU was always quantitative (100
±
5%) during the duration of the experiment (Rattigan et al. 1997a). To check whether the metabolism of 1-MX was solely due to XO, a specific inhibitor of the enzyme, allopurinol, was infused into the hindlimb (Emmerson et al. 1987). This inhibitor completely blocked the conversion of 1-MX to 1-MU as did xanthine, a competing substrate for XO (Rattigan et al. 1997a). This study showed that 1-MX metabolism decreased in the presence of 5-HT, a vasoconstrictor proposed to decrease muscle metabolism by diverting flow away from the nutritive capillaries of muscle into the larger, non-nutritive capillaries, which are not involved in nutrient exchange with the muscle (Rattigan et al. 1997a).Direct action of 5-HT on XO itself was ruled out, since there was no change to muscle XO in vitro, whether 5-HT was present or not in isolated muscle incubations (Rattigan et al. 1997a). Kinetics studies of the purified enzyme form milk fat globule indicated the Km for 1-MX to be 7.6 µM. On this basis changes in the rate of metabolism of 1-MX were likely to be indicative of changes in enzyme exposure, possibly capillary recruitment (nutritive flow).
purine released endogenously, is capable of inhibiting 1-MX conversion to 1-MU by competitively inhibiting XO.
An obvious application of the 1-MX method was its use in vivo. Most of the recent evidence in the literature supports the idea that insulin is capable of increasing total blood flow to the muscle (Baron 1994). Furthermore, it has been proposed that insulin's action to increase total blood flow could partially account for insulin's ability to stimulate glucose uptake by increasing the delivery of glucose to the muscle cells (Baron and Brechtel 1993b). Rattigan et al. (1997) proposed that insulin not only increases total blood flow to the muscle, it also increases the capillary recruitment (nutritive flow) within the muscle itself (Rattigan et al. 1997b). To test this hypothesis, 1-MX was· infused into anaesthetised rats under control conditions, and in the presence of insulin under euglycaemic hyperinsulinaemic clamp conditions (Rattigan et al. 1997b). As with the perfused rat hindlimb, 1-MX alone had no vasoactive action and there were no changes in haemodynamic parameters such as arterial blood pressure, heart rate, femoral blood flow, or hindleg vascular resistance (Rattigan et al. 1997b). Results showed that 1-MX metabolism increased in the presence of insulin in vivo (Rattigan et al. 1997b), again suggestive of increased nutritive flow or capillary recruitment. Also, these changes could not be accounted for by the increase in total blood flow to the hindleg, since similar increases in total flow induced by epinephrine infusion, did not produce any change in 1-MX metabolism. Further to this, insulin itself did not directly affect the activity of XO when incubated with muscles in vitro (Rattigan et al. 1997b).
A second study in vivo by Rattigan et al. (1999) focussed on the effect of infusion of
a Type B vasoconstrictor, a-methyl serotonin on insulin responsiveness(Rattigan et al. 1999). a-Methyl serotonin was used since its actions are restricted to the
vasculature and it has no direct effects on muscle metabolism itself (Rattigan et al. 1999). In addition to the insulin resistance of glucose uptake, insulin was prevented from increasing 1-MX metabolism when a-methyl serotonin was present (Rattigan et al. 1999). This work demonstrates that vasoconstriction by such agents in muscle
muscle glucose uptake and contributing to the insulin resistance observed in viva (Rattigan et al. 1999).
Overall, results thus far, have suggested that changes in 1-MX metabolism both in perfused muscle studies and in viva are indicative of changes in capillary recruitment (albeit nutritive flow). Key questions that now emerge are: firstly, is the 1-MX technique robust enough to be more widely applicable and secondly, can another independent method be developed to provide concordance.
1.8 Laser Doppler Flowmetry as a Tool for Measuring Relative Nutritive and
Non-Nutritive Flow
anaesthetised rats were used to examine the relationship between total flow (as measured by radioactive microsphere entrapment) and apparent muscle nutritive flow (measured by LDF) when a selection of vasoactive agents were administered (Kuznetsova et al. 1998). Upon infusion of phenylephrine or angiotensin II, a distinct increase in muscle vascular resistance was seen. Along with this, no change in muscle blood flow occurred, but a significant increase in LDF signal was observed (Kuznetsova et al. 1998). Similarly, isoproterenol, a vasodilator, produced a marked increase in muscle blood flow, while muscle vascular resistance and muscle nutritive flow (as measured by LDF) were significantly decreased. Despite other explanations which could account for these results, it appears likely that the two Type A vasconstrictors (phenylephrine and angiotensin II, see Table 1-1 above) have each produced effects in vivo involving a selective increase in muscle nutritive flow which are consistent with previous data found using the perfus~d rat hindlimb. Furthermore, the vasodilator, isoproterenol appears to have increased flow to the non-nutritive route at the expense of flow to the nutritive pathway (Clark et al. 2000). Previous data (Colquhoun et al. 1990) indicates that Type A vasoconstriction is opposed by isoproterenol in the constant-flow perfused rat hindlimb. This is thought to occur by relaxing constricted sites in the vasculature, which reduce flow to non-nutritive routes. As indicated by Rattigan et al. (Rattigan et al. 1997a), microspheres do not appear to be suitable for distinguishing between nutritive and non-nutritive routes in muscle. In addition, serotonin, and other agents capable of inhibiting oxygen uptake and metabolism generally, do not alter the distribution of 15 µm fluorescent microspheres (Rattigan et al. 1997a).
1.9 Aims of the Present Study The present study had two main aims:
1. to further explore the use of 1-methylxanthine as a method for measuring changes in nutritive flow in skeletal muscle under normal physiological situations (e.g. exercise), pathophysiological conditions (tumour necrosis factor-a administration) and as a result of sciatic nerve severance).
CHAPTER2
Materials and Methods
2.1 Rat Hindlimb Perfusion Studies
2:1.1 Animals
Male hooded Wistar rats (180-205 g) were raised on a commercial diet (Gibsons, Hobart) containing 21.4% protein, 4.6% lipid, 68% carbohydrate, and 6% crude fibre with added vitamins and minerals together with water ad libitum. Rats were housed at a constant temperature of 21 ± 1°C in a 12h/12h light-dark cycle. All procedures adopted and experiments undertaken were approved by the University of Tasmania Ethics Committee in accordance with the Australian Code of Practice for the Care and Use of Animals for Scientific Purposes (1990).
2.1.2 General Surgical Procedures
The rat was then connected to the perfusion apparatus and killed with a lethal intra-cardiac injection of sodium pentobarbital. A pictorial view of the surgical ligations is shown in Figure 2-1.
Vena Cava Aorta
Renal Vessels
Superior mesenteric artery First ligature pair
Second ligature pair
Iliolumbar vessels
Internal spermatic vessels Ureter
Common iliac vessels Inferior mesenteric vessels
Superficial epigastric External iliac vessels Hypogastric vessels Seminal vesicles Bladder
Foot Tail
Figure 2-1 Pictorial view of perfused hindlimb surgical ligations. Modified from Dora (Dora 1993) (see above for further details).
2.1.3 Peifusion Media
2.1.3.l Erythrocyte-Free Hindlimb Perfusions
(BSA, fraction V; Boehringer Mannheim, Australia), 8.3 mM glucose, 2.54 mM CaClz, 118 mM NaCl, 4.7 mM KCl, 1.2 mM KH2P04, 1.2 mM MgS04, and 25 mM NaHC03• Once made, the perfusion buffer was filtered using a 0.45 µm pore filter under pressure to ensure that it was free of any particulate matter. The buffer was maintained at a pH of 7.4 by saturation with 95% 02-5% C02
2.1.3.2 Red Blood Cell Peifusions
The perfusion medium consisted of a modified Krebs-Henseleit buffer as described above, containing 5% BSA. This was combined with washed bovine erythrocytes to give a final haematocrit of 38%. Heparin (0.2 ml.L-1) and pyruvate (0.1 g.L-1) were
added to blood mixture. The fresh bovine erythrocytes were washed three times using saline (0.9% NaCl) and filtered through four layers of pre-washed cheesecloth. They were then washed twice more in saline and then stored in Krebs-Benseleit bicarbonate buffer gassed with 95% 0 2-5% C02 at 4°C until use. Erythrocytes were never more than 3 days old when used. As with previous similar studies ((Rattigan et al. 1996), this perfusion medium resulted in minimal oedema.
2.1.4 General Peifusion Procedure
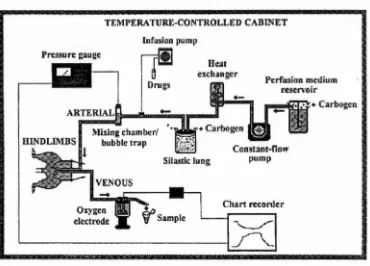
using a peristaltic pump (LKB Microperpex). A typical perfusion apparatus setup is
shown in Figure 2-2.
TEMPERATtTRE-CONTROLLED CABINET llifwi.on puMp
Drup
-Bear
c:c:hange.r
Pe.rf1.tSio1> medium reservoir
-...--- •••. .-Carbogen
Silastk: lung
Con1tan,t..Oow
pump
'-.../
[image:47.565.113.483.170.436.2]--~~~~~~-J'\._
Figure 2-2 Perfusion apparatus for the constant-flow perfusions.
Reproduced from Dora (Dora 1993).
2.1.4.1 Calculation of Oxygen Uptake.
The oxygen electrode was calibrated before and after each perfusion using 100%
oxygen and air. Arterial P02 (Pa02) was determined by joining up the arterial and
venous cannulae to bypass the perfused tissue, but with the same length of
polyethylene tubing so that any loss to the atmosphere was constant. The oxygen
uptake (V02) of the perfused tissue was calculated from the difference between Pa02
and venous P02 (Pv02), the flow rate, and the perfused muscle mass, whilst taking
1.3499 x (Pa02-Pv02) x flow rate (ml/min) x 60 (ml/h)
1000 ml x perfused tissue (g)
where 1.3499 (µmol.L-1.mmHg-l) is the Bunsen coefficient for oxygen solubility in human plasma at 32°C ((Christoforides et al. 1969) (Bunsen coefficient = 1.256 at 37°C, 1.508 at 25°C) and perfused muscle mass is assumed to be 1/lih of body mass in 180-200 g rats ((Ruderman et al. 1971).
2.1.5 Blood Peifusion Procedure
The perfusion medium was equilibrated with 95% air-5% C02) at 4°C to enable normal saturation of the erythrocytes with oxygen. Gassed perfusate then entered a
temperature -controlled cabinet (37°C) at a constant flow rate. The arterial perfusate
was temperature equilibrated (37°C) by passage through an in-line heat exchanger and water-jacketed arterial line. To ensure a constant arterial oxygen concentration, the perfusate was further equilibrated with 95% air-5% C02 by passage through a silastic tube oxygenator before entering the hindlimb.
2.1.5.1 Determination of Oxygen Consumption in Blood Perfusions
2.2 In Vivo Studies
2.2.1 Animals
Male hooded Wistar rats or male Wistar rats were cared for as above.
2.2.2 General Surgical Procedures
Rats were anaesthetized using pentobarbital sodium (50 mg.kg-1 body weight) and had polyethylene cannulas (PE-50, Intramedic®) surgically implanted into the carotid artery, for arterial sampling and measurement of blood pressure (pressure transducer Transpac IV, Abbott Critical Systems) and into both jugular veins continuous infusion of anaesthetic and other intravenous infusions. A tracheotomy tube was inserted, and the animal allowed to spontaneously breathe room air throughout the course of the experiment. Small incisions (1.5 cm) were made in the skin overlaying the ·femoral vessels of each leg, and the femoral artery was separated from the femoral vein and saphenous nerve. The epigastric vessels were then ligated, and an ultrasonic flow probe (Transonic Systems, VB series 0.5 mm) was positioned around the femoral artery of the right leg just distal to the rectus abdominus muscle. The cavity in the leg surrounding the probe was filled with lubricating jelly (H-R, Mohawk Medical Supply, Utica, NY) to provide acoustic coupling to the probe. The probe was then connected to the flow meter (Model T106 ultrasonic volume flow meter, Transonic Systems). This was in turn interfaced with an IBM compatible PC computer which acquired the data (at a sampling frequency of 100 Hz) for femoral blood flow, heart rate and blood pressure using WINDAQ data acquisition software (DATAQ Instruments). The surgical procedure generally lasted approximately 30 min and then the animals were maintained under anaesthesia for the duration of the experiment using a continual infusion of pentobarbital sodium (0.6 mg.min-1.kg-1).
fluid infused. The body temperature was maintained using a water-jacketed platform and a heating lamp positioned above the rat.
2.2.3 Euglycaemic Hyperinsulinaemic Clamp
Once the surgery was completed, a 60 min equilibration period was allowed so that leg blood flow and blood pressure could become stable and constant. Rats were then allocated into experimental groups, control or euglycaemic hyp~rinsulinaemic clamp. All infusion volumes in control groups were matched to the volumes of insulin (10 mU.min-1.kg-1) (Humulin R, Eli Lilly, Indianapolis, IN) and glucose infused in the clamp animals. Glucose (30% w/v solution) was infused to maintain blood glucose levels at or -above basal level (approximately 5 mM) whilst infusing insulin for a period of 120 min (unless otherwise stated).
2.2.4 1-Methylxanthine Infusion during In Vivo Experiments
Since 1-methylxanthine (1-MX, Sigma Aldrich Inc) clearance was very rapid, it was necessary to partially inhibit the activity of xanthine oxidase (Rattigan et al. 1997b ). To do this, an injection of a specific xanthine oxidase inhibitor, allopurinol (Emmerson et al. 1987) (10 µmole.kg-1) was administered as a bolus dose 5 minutes
prior to commencing the 1-MX infusion (0.4 mg.min-1.kg-1, dissolved in saline). This
'
allowed constant arterial concentrations of 1-MX to be maintained throughout the experiment.
2.2.5 Glucose Assay
A glucose analyser (Yellow Springs Instruments, Model 2300 Stat plus) was used to determine whole blood glucose and plasma glucose (by the glucose oxidase method)
during and at the conclusion of the insulin clamp. A sample volume of 25 µl was required for each determination.
2.2.6 Insulin ELIZA Assay
2.2.7 TNF ELIZA Assay
Arterial plasma TNF levels at the end of each experiment were determined by ELIZA assay (OptEIA TM Rat TNF-a Set, Pharmingen, USA) using recombinant rat TNF
standards.
2.2.8 Data Analysis
All data is expressed as means
±
SE. Mean femoral blood flow, mean heart rate and mean arterial blood pressure were calculated from 5 second subsamples of the data, representing approximately 500 flow and pressure measurements every 15 min. Vascular resistance in the hindleg was calculated as mean arterial blood pressure in millimetres of mercury divided by femoral blood flow in millilitres per minute and expressed as resistance units (RUs). Glucose uptake in the hindlimb :was calculated from A-V glucose difference and multiplied by femoral blood flow and expressed asµmol.min-1• The 1-MX disappearance was calculated from A-V plasma 1-MX
difference and multiplied by femoral blood flow (corrected for the volume. accessible to 1-MX, 0.871, determined from plasma concentrations obtained after additions of standard 1-MX to whole blood) and expressed as nmoles.min-1•
2.3 Analytical Methods
2.3.1 1-Methylxanthine Analysis by HPLC
2.3.1.1 Treatment of Perfusate Samples
Perfusate samples (1.0 ml) from hindlimb·perfusions were mixed with 0.2 ml of 2 M perchloric acid (PCA) to precipitate proteins and left on ice for 5 min. If the samples were collected from a blood perfusion, the sample was immediately centrifuged for 15 sec at 8000 x g to remove the red blood cells before mixing .with PCA. PCA treated samples were then centrifuged at 8000 x g for 10 min and the supernatant neutralised using 2.5 M K2C03. Samples were then stored at -20°C till assayed using
2.3.1.2 Treatment of In Vivo Blood Samples
Duplicate arterial (A) and venous (V) samples (300 µl) were taken at the end of the experiment and placed on ice. These blood samples were immediately centrifuged and 100 µl of plasma mixed with 20 µl of 2 M PCA. The PCA treated samples were
then stored at -20°C until assayed for 1-MX. When required, samples were thawed on ice, centrifuged for 10 min and the supernatant used to determine 1-MX, allopurinol and oxypurinol concentrations as described previously ((Rattigan et al. 1997b, Rattigan et al. 1999).
2.3.1.3 HPLC Analysis of Purines
Analysis of purines was by reverse-phase High Performance Liquid Chromatography (HPLC) essentially as described previously ((Rattigan et al. 1997a, Wynants et al. 1987).
2.3.2 2-Deoxyglucose Uptake
2.3.2.l Hindlimb Perfusions
The hindlimb was allowed to equilibrate to a steady state of perfusion pressure and Pv02• Insulin (0.4 U.mr1 in saline) (Actrapid Insulin, Novo Nordisk) was infused at
a rate of 1 in 200 for 25 min into the perfusion line immediately prior to a small continuously mixed bubble trap to give a final concentration of 2 mU:mr1. In
addition, 2-deoxy-D-[1-3H]glucose (2DG) (10 µCi.mr1; 15 Ci.mmor1; NEN Research
Products) and [U-14C]sucrose (3.14µCi.ml-1; 552 mCi.mmor1; NEN Research
Products) in 2 mM sucrose/0.9% NaCl were infused at 35-40 µl.min.
vial of solubilised muscle to neutralise the basic Soluene. Scintillant (15 ml; Biodegradable Counting Scintillant-BCA, Amersham USA) was added to each vial and radioactive counts (disintegrations per minute, dpm) were determined using a scintillation counter (Beckman LS3801, USA). Perfusate samples (200 µl) were also counted after adding 3 ml of scintiallant to ~ach vial.
Insulin-mediated 2DG uptake, as represented by R'g was calculated using the following equation:,,
2 x [3H dpm in muscle-(14C dpm in muscle x 3H dpm.!14C dpm. ratio in perfusate)] dry wt muscle (g)x
(3H
dpm. per ml perfusate /µmoles glucose per ml perfusate)2.3.2.2 In Vivo Experiments
At 45 min prior to the completion of the experiment, a 50-µCi bolus of 2-deoxy-D-[2,6-3H]glucose (2DG; specific activity= 44.0 Ci.mmor1, Amersham Life Science) in
saline was administered. Plasma samples (20 µl) were collected at 15, 30 and 45 min to determine plasma clearance of the radioactivity. At the conclusion of the experiment, the soleus and plantaris muscles were removed, clamp frozen in liquid nitrogen and stored at -80°C until assayed for 2DG uptake.
2.3.3 Measurement of Total Flow by Microsphere Entrapment
2.3.3.1 Hindlimb Perfusion
Microsphere entrapment can be used to determine total flow to the hindleg during the hindlimb perfusion technique. This technique was used both in the sciatic nerve severance work and in the sciatic nerve stimulated rats to ascertain the distribution of microspheres in the hindlimb.
These experiments were usually performed as a separate study, but under the same conditions, in order to compare experimental (sciatic nerve severed and sciatic nerve stimulated rats) and control animals (sham-operated or non-sciatic nerve stimulated rats).
Ten minutes before the end of the respective experiment, a bolus dose of 400,000 (200,000 in the case of the sciatic nerve stimulation work since it only involves a
single hindlimb) yellow-green 15 µM FluoSpheres® (Fluorescent Microsphere Resource Centre, University of Washington, Seattle) was injected immediately prior to the arterial cannula. This injection was performed over a period of 10 seconds to minimise any interruptions to the normal perfusate flow and pressure. During this final 10 min of the experiment, the venous perfusate was collected in order to ascertain the number of microspheres which passed through the hindlimb.
2.3.3.2 Microsphere Distribution Assay
washed in 10 ml of 0.25% Tween-80 solution, followed by distilled water alone. After the final wash, as much of the supernatant as possible was removed without disturbing the pellet. The microsphere pellet in each tube was then resuspended in 5 ml of Cellosolve® (2-ethoxyethyl. acetate, Aldrich Chemical Co Inc) and left
CHAPTER3
The Effect of Exercise from Sciatic Nerve Stimulation on
1-MX Metabolism in the Perfused Rat Hindlimb.
3.1 Introduction
As described in the first chapter, there are two methods currently being developed in this laboratory for measurement of nutritive flow within skeletal muscle, laser Doppler flowmetry and 1-MX metabolism. The 1-MX meth0d involves infusion of an endogenous substrate for capillary endothelial xanthine oxidase, 1-MX, and measurement of its metabolism by HPLC.
It is generally accepted that there is a marked increase in functional capillary surface area as a result of capillary recruitment within skeletal muscle during exercise (Segal 1992). In the isolated perfused rat hindlimb, sciatic nerve stimulation leads to vasodilation with increased V02, particularly if the hindlimb has pre-existing vascular tone caused by the presence of a vasoconstrictor (Colquhoun et al. 1990). Any change in capillary flow (recruitment) should be reflected by changes in 1-MX metabolism. Thus, the aim of this chapter was to investigate the effect of exercise (in the form of sciatic nerve stimulation), which is known to increase nutritive flow in the constant-flow perfused rat hindlimb, on 1-MX metabolism. A positive outcome lends further support to the use of 1-MX as ah indicator of changes in capillary surface area.
3.2 Methods
3.2.1 Sciatic Nerve Exposure for Stimulation
electrode. The knee was secured at the level of the tibiopatellar ligament, and the Achilles tendon was attached to a Harvard Apparatus isometric transducer, allowing transmission of tension development from the calf muscle groups. Voltage across the electrodes was monitored on a cathode ray oscilloscope (Telequipment DM64) and tension development was recorded during contraction on a Y okagawa 3056 chart recorder.
3.2.2 Hindlimb Perfusions
Specific details for hindlimb perfusions are given in Section 2.1. Perfusion pressure was monitored. Following 30 min equilibration at 4 ml.min-1, the perfusate flow rate
was increased to 15.0
±
0.1 ml.min-1 (equivalent to 0.95±
0.01 ml.min-1.g-1 muscle) for the remainder of the experiment (see Figure 3-1 for experimental protocol). At the same time, 5 mM 1-MX was infused into the perfusion line (at 1 in 200 of the perfusate flow rate) proximal to a small stirred bubble trap and the arterial cannula to give a final concentration of 25 µM.Prior to contraction, the resting length of the muscle was adjusted to attain maximal active tension on stimulation. Sciatic nerve stimulation was then commenced using 200 ms trains of 0.1 ms pulses at 100 Hz every 2 seconds at 6 V to attain full fibre recruitment (Rattigan et al. 1996) for the last 15 min of the perfusion.
-30
-20
-10
0
i
A1 V110
1-MX (25 µM)
20
30
40
i i i
V2 V3 V4
Exercise
50
i i i
VS V6 A2 V7
FV
Figure 3-1 Experimental protocol for sciatic nerve stimulation experiments. Flow rate in the first 30 min (equilibration period) was 4 ml.min-1. From time= 0
onwards, the flow rate was 15 ml.min-1.
3.2.3 Measurement and Calculation of Oxygen Uptake
The total oxygen content of perfusate samples was determined using a galvanic cell oxygen analyser (TasCon oxygen content analyser manufactured by the Physiology Department, University of Tasmania). The rates of oxygen uptake were calculated from arterio-venous difference and flow rate, and were expressed per gram of perfused muscle, as estimated previously (Dora et al. 1992).
3.2.4 Muscle Incubations
To assess whether contraction directly affected xanthine oxidase activity, soleus (30
±
pre-using the identical conditions as for the hindlimb calf muscle group above. Stimulation was continued for 15 min. As controls, 5 soleus and 5 EDL muscles were incubated without stimulation for a total of 45 min. Muscles were stored at -80°C until assays could be conducted.
3.2.5 Xanthine Oxidase Activity
Xanthine oxidase activity was measured at 293 nm and 37°C in 50 mM phosphate buffer, pH 7.4, containing 0.1 mM EDTA essentially as described by others (Wajner and Harkness 1989)s. Commercially available (Sigma Chemical· Co.) buttermilk xanthine oxidase (2.0 units.mg-1) was used to construct direct linear plots for the
determination on Km and Vmax for xanthine (XAN). and 1-MX.
3.2.6 Statistical Analysis
Unpaired Student's t-test was used to test the hypothesis that there was no difference between sets of data. For the time courses, one way repeated measures analysis of variance (ANOV A) was performed and when a significant difference was found, multiple comparisons (Dunnett's method) were made by comparing with the time point just prior to exercise (35 min). Significant differences were recognised at P
<
0.05.
3.3 Results
3.3.1 Changes to Total Blood Flow
Figure 3-2 shows the effect of contraction of the calf muscle group on the distribution of flow to various muscles of the calf and thigh of the perfused leg. As a result of exercise there was a significant increase in flow to several muscles of the group, including soleus, plantaris, and the gastrocpemius red and white. In addition, total flow to the calf was increased as a ~esult of exercise from 5.20 ± 0.78% (n