16th Australasian Fluid Mechanics Conference Crown Plaza, Gold Coast, Australia
2-7 December 2007
Design and Calibration of a Facility for Film Cooling Research
J.S. Porter J.E. Sargison A.D. Henderson
School of Engineering
University of Tasmania, Hobart, Tasmania, 7005 AUSTRALIA
Abstract
An existing open circuit wind tunnel has been modified to incorporate a secondary supply loop to provide controlled flow conditions at the inlet to a film cooling hole model. The primary or crossflow fluid enters from atmosphere through a smooth two dimensional contraction before entering the working section. The newly constructed supply loop has a single inlet from a high pressure source, in-line blower, and a 600mm long rectangular passage working section. Various film cooling geometries can be installed to connect the supply loop passage to the main wind tunnel working section. The installation of the supply loop enables variation of cooling hole inlet conditions, including crossflow velocity, mass flow rate, and flow direction. Detailed flow measurements were made to establish uniformity of flow in the supply passage and accurate control of coolant mass flow. A range of operating conditions have been established and calibrated for use in subsequent research.
Nomenclature
D cooling hole diameter
ρ
air density (kg/m3 ) U∞ mainstream velocity (m/s) Uj coolant jet velocity (m/s) r velocity ratio = Uj/U∞M mass flux (blowing) ratio = ρjUj/ρ∞U∞ I momentum flux ratio = ρjUj2/ρ∞U∞2 Tu turbulence intensity (%)
Introduction
The use of film cooling techniques to control the operating temperature of gas turbine components continues to be one of the most important contributors to the overall performance of a gas turbine jet engine. It can be shown that even small increases in turbine entry temperature (TET) result in large increases in engine thrust and overall engine efficiency. These elevated temperatures have been made possible partly by improvements in materials technology, including surface coatings, but to a greater extent through improved aerodynamics and film cooling design [1]. Film cooling involves bleeding a small percentage of cooler air from the high pressure compressor and passing it around the combustion chamber to be fed to the turbine vanes and blades internally. This cool air then moves through the inside of the blade, providing convective cooling, before being ejected through discrete rows of holes in the blade surface. These discrete ‘jets’ of coolant fluid optimally coalesce to form an insulating film of air between the hot mainstream gases (from the combustor), and the blade material. Cooling hole design is a constant trade-off between maximum cooling performance and aerodynamic efficiency.
The aerodynamic component of cooling hole performance is often seen as secondary in importance to that of the heat transfer and cooling effectiveness. Indeed, preventing the blade from thermally induced failure is a primary aim, and thus concentration on thermal performance is understandable. However, as indicated above, the important value of overall engine efficiency has a strong dependence on the performance of
[image:1.595.319.543.454.658.2]the turbine section. This means that optimising the coolant flow path to reduce aerodynamic entropy generation is a very worthwhile exercise. Figure 1 shows a typical coolant flow path through the internal passages of a high pressure turbine blade. Coolant is fed from the root of the blade along a series of passages and bends, where high levels of turbulence are induced by transverse ridges. These are designed to increase the wetted area of the internal blade material and thus provide increased levels of convective cooling. Film cooling holes are drilled either by laser or electro-discharge machining at particular locations to create a surface pattern that provides the best film coverage. Typically, these holes are either cylindrical (round) or fan-shaped, with an expanded exit. The angles of the hole axis relative to the passage and external hot-gas flows are varied, and depend on the location of the hole both internally and on the blade surface. In addition, the surface outline of the hole will also vary with hole angle, and with the hole geometry. The transverse ribs, sharp 180 degree bends, mixing of the coolant and mainstream flows, and in-hole turbulence all contribute to entropy production. Numerous parameters need to be examined to determine the combinations of hole size, shape, angle, mass flow etc to identify and reduce these sources of entropy production and improve turbine and thus overall engine efficiency.
Figure 1. Internal coolant flow path in a high pressure turbine blade [2]
extensive body of findings pertain overwhelmingly towards cooling performance results. The coolant flow path within an actual turbine blade or vane is quite complex. There is significant variation of internal and external flow direction in relation to hole orientation for different hole locations around a blade. Also, the pressure difference across a hole is strongly effected by the location of that hole in the coolant and mainstream flows. It has been shown through studies such as [3], [4], and [5] that the inlet conditions for a cooling hole have an important effect on the flow within the hole, which in turn affects the discharge coefficient and cooling effectiveness for that configuration. Thus, trying to replicate the flow conditions both internally and externally in a film cooling model is important.
A number of ratios help define the operating characteristics of a cooling hole or series of holes. These include the velocity ratio, r, temperature ratio, TR, density ratio, DR, mass flux (blowing) ratio, M, and momentum flux ratio, I. The values of these ratios are frequently used in research to try and match the conditions in an actual engine, and many previous studies have revealed the effect of changing these parameters on film cooling performance, and to an extent, on discharge coefficients. Direct engine modelling covering all parameters is unfeasible for most investigations, and thus the parameters considered vital in reproducing aspects of the flow that are critical to the phenomenon under examination must be identified. Having a low speed tunnel means that Mach numbers cannot be reproduced. However, velocities are set, in conjunction with the hole diameter, to achieve Reynolds numbers in the range of typical values in actual blades. Table 1 below lists a number of quantities and their typical values in an operating engine, and those selected in the current research investigation.
Parameter Engine value Test value D (hole diameter) 0.7 - 1.2 mm 50 mm
α (inclination angle) 20 – 60° 30°
L/D 3 – 6 5
Fan expansion angle 14 – 32° 30°
DR 1.5 – 2 1
r (velocity ratio) 0.5 – 2 0.5 – 1.5
M 0.8 – 4 0.5 – 1.5
I 0.9 – 2 0.25 – 2.25
ReDj 1 – 3 x10⁴ 1 – 5 x10⁴
Table 1. Comparison of actual and experimental parameters.
Description of the facility
The existing wind tunnel selected for modification was an open circuit design using an axial flow fan to draw air through the working section. A previous modification created a meter long working section 225x225 mm in cross-section, preceded by a smooth two-dimensional contraction [6]. This resulted in mainstream turbulence intensity of 0.6%, flow direction uniform to within ±0.5°, and velocity uniform to within ±2%. Maximum mainstream velocity was 20 m/s. These features of the tunnel remain in the new design. The existing tunnel enabled a complete side of the working section, with integrated cooling hole model, to be removed and replaced with different hole geometries. A round and a fan-shaped hole model could be fitted to the working section. Inlet to the hole was via a bellmouth tube to measure the cooling flow, preceding a plenum chamber mounted normal to the hole axis (see figure 2). Velocity (and mass flux) ratios of up to 0.76 could be achieved in the existing configuration.
Required specifications
Table 1 lists a range of values that the current research aims to employ in evaluating the flow. The existing set-up was unsuitable to achieve these values for several reasons. The mainstream
hot-gas flow and coolant passage flow in an actual blade are generally in parallel planes, as shown in figure 3. When compared with the existing configuration, we can see that the important hole inlet conditions are not being well replicated by the plenum feed and perpendicular entry. The maximum velocity through the metering section was limited by the achievable pressure difference across the hole, created by the drop in static pressure of the mainstream flow. In addition, no variation of internal crossflow direction was possible due to the plenum at inlet. The existing cooling hole geometries were not suitable due to the perpendicular inlet, and the 28° expansion angle of the existing model was increased to 30°, as the current research intends to examine the unsteady flow features within the overexpanded exit of fan-shaped holes. This is still representative of holes used in actual blade designs, based on data supplied by Rolls-Royce Plc [7].
Figure 2. Existing working section with plenum and perpendicular hole inlet.
It should be noted that although the supply loop air is referred to as ‘coolant’, the work here is not reproducing engine like temperature ratios between the two flows. This is due to the difficulties in cooling the large volumes of air required, and also the undesirable thermal effects on hot-wire measurements in the mixing region of the coolant and mainstream flows if they were at different temperatures. Hence ‘coolant’ refers to the air passing through the supply loop and cooling hole model. There is scope, however, for experiments with different density ratios in future work, by using a foreign gas with appropriate density as the coolant.
Figure 3. Comparison of actual blade internal coolant flow with the existing coolant supply configuration.
Supply loop design
Extensive measurements of the existing framework and components enabled a 3D CAD model of the wind tunnel assembly to be constructed. A significant design challenge was to incorporate the supply loop within the confines of this framework. Combining three-dimensional computer models of the current and new components, allowed proposed supply loop designs to be examined in all required positions prior to construction, and major misfitting problems rectified. The design evolution resulted in a recirculating loop with a rectangular clear
[image:2.595.317.535.263.411.2] [image:2.595.43.273.425.536.2] [image:2.595.333.520.567.641.2]acrylic supply passage, large 180° bends, a fan, and an inlet from a controlled air supply. Several transitional pieces, designed to prevent flow separation, connect the rectangular passage to round cross-section bends of 150 mm internal diameter. These 90 degree bends were sourced from stormwater supplies and have a radius of curvature of ~250 mm to minimise turning losses. Two bends were joined together and fitted with mounting flanges to connect with the transitional pieces. All joins were sealed with a silicone gasket and tape where required. The blower is a 0.14 kW in-line mixed flow single phase fan made by Fantech, commonly used in air-conditioning applications, capable of delivering a 200 Pa pressure rise at a flow rate of 0.2 m3/s. A Powerform Controls variable voltage controller was coupled to the fan to adjust speed remotely.
The supply loop components are supported by a stand-alone mobile framework. to enable easy manoeuvring. This facilitates varying internal crossflow directions, through repositioning of the loop at almost any angle relative to the mainstream flow direction of the wind tunnel. A three dimensional drawing of the supply loop is shown in figure 4.
[image:3.595.323.524.171.354.2]Figure 4. CAD model of supply loop design positioned within existing framework. Arrows indicate direction of supply loop rotation.
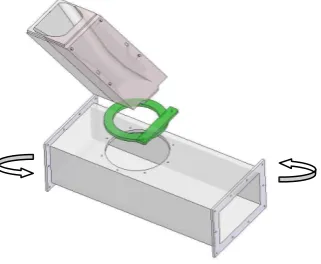
Figure 5. Exploded view of hole connection to passage and mainstream. Arrows indicate rotation of supply passage in relation to cooling hole model.
Supply passage
The supply passage dimensions were guided by the passage Reynolds number required to be representative of engine conditions, having a range of 7000<Reh<90,000 [3]. The passage dimensions were chosen at a height of 100 mm (2D) and width of 180 mm (3.4D), with 6 diameters of passage upstream and 4
[image:3.595.51.269.316.497.2]diameters downstream of the hole centre. A novel component of this design is the ability to easily rotate the supply loop relative to the hole axis, and allow straightforward interchanging of hole geometries. A large 160mm diameter hole in the top of the passage allows a custom flange for each cooling hole geometry to be inserted. The round hole permits rotation of the supply loop about the hole inlet centre, as shown in figure 5.
Figure 6. Completed supply loop installed. Flow from right to left.
Cooling hole model
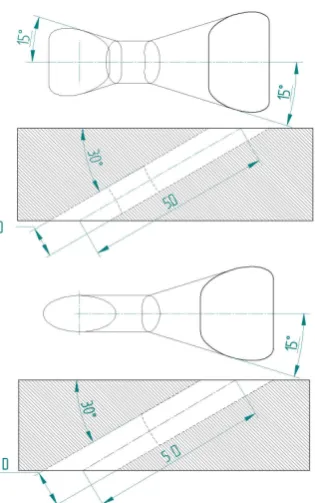
The variation of coolant flow path within a turbine blade or vane gives rise to a need for different hole geometries to improve cooling performance. The major development in cooling hole design over the last 30 years has been the progression from cylindrical holes to holes with flared or fan-shaped exits. Fan-shaped holes offer advantages such as superior coolant spread across the blade surface, and reduced detachment from the cooled surface at higher blowing ratios. In modern turbine components, fan-shaped holes often have an expansion angle near 30 degrees. This generally results in an over-expansion of the cooling hole flow and the rapid diffusion results in large scale flow separations and associated unsteadiness. In line with the research aim of investigating the sources of entropy production in the coolant flow path, the investigation will make measurements of the pressure field in the inlet region, within the hole itself, and in the near field exit region where the coolant fluid interacts with the mainstream. This should provide a greater understanding of the actual flow mechanisms within a highly diffused hole, and provide quantitative data for comparison with computational fluid dynamics results. The cooling hole model geometries are at large 50:1 scale to permit detailed flow field measurements.
[image:3.595.85.246.546.678.2]Figure 7. Cooling hole model geometries
Figure 8. Cooling hole model machined from clear acrylic
Coolant air metering
One of the main independent variables in this investigation is the velocity ratio between the cooling hole and mainstream flows. With a density ratio of unity, this is also equivalent to the mass flux or blowing ratio. In order to calculate the velocity of coolant through the metering section of the cooling hole geometries, the mass flow rate of the coolant needs to be known. The design of the supply loop means that the air entering the loop is equivalent to that leaving the loop through the cooling hole. Accurate measurement of the mass flow through the cooling hole is thus essential to calculate the velocity through the metering section of the hole geometries. This is achieved by a design that takes direction from the facility at the University of Karlsruhe as described in [8]. The supply loop is closed apart from one inlet, connected to a metered compressed air source, and one exit, the film cooling hole. In this way, at steady state, the mass flow of air that enters the supply loop is equivalent to the mass flow exiting through the cooling hole. A mass flow metering system is installed at the compressed air wall outlet. This consists of a pressure regulator, needle valve, digital flow rate meter, pressure transducer, and thermocouple (figure 9). A flexible hose connects the metering system to the supply loop inlet port, as can be seen in figure 6. The compressed air line is driven by a screw-type
compressor, capable of delivering 4.3 m3/min at 75 bar, which equates to approximately 0.6 kg/s of air. This is well above the 0.072 kg/s required to achieve a blowing ratio of 1.5. The pressure regulator and needle valve are manually set to achieve the desired mass flow rate. A pressure transducer monitors the static pressure immediately upstream of the flow meter, and a thermocouple monitors the temperature. Knowing the volumetric flow rate from the meter, together with the pressure and temperature of the air, enables the mass flow rate to be calculated. In addition, the supply loop blower allows the internal crossflow velocity to be varied independently of the blowing ratio.
Figure 9. Coolant air metering components R-L: pressure regulator, needle valve, pressure transducer, flow-rate meter, thermocouple.
Measurement uncertainty analysis
Uncertainty analysis is an important component of the presentation of measured data. A comprehensive review of error sources and the propagation of those errors through the measurement system and subsequent data reduction allows a defined level of confidence to be established in the reported values. Instrumentation of the wind tunnel included calibration and uncertainty estimation for the various measurement devices in use. The procedure followed was based on the approach of Moffat [9] and similarly from Dunn [10]. All combined uncertainties are expressed at 95% confidence and result from appropriate propagation of uncertainties through the measurement and data reduction system.
Coolant air supply calibration
The coolant air supply system was calibrated against a standard orifice plate. The plate was fitted within a length of pipe that had appropriate connections to the flexible piping from the metering equipment. The mass flow rate from the system was set to a range of values that created a calibration curve for the flow measurement system. Figure 9 shows the resulting plot and fitted polynomial regression. The combined uncertainty in mass flow values is less than 2% of a reading.
R2 = 0.9999
0.00 0.02 0.04 0.06 0.08
0.00 0.02 0.04 0.06 0.08
Supply system [kg/s]
O
ri
fi
c
e
p
la
te
[
k
g
/s
]
[image:4.595.309.543.223.290.2] [image:4.595.73.246.368.515.2] [image:4.595.320.531.573.757.2]Supply passage profiles Mean velocity
Measurements of flow velocity, direction, and turbulence were made in the coolant supply passage upstream of the cooling hole inlet. Probe insertion points were created on the supply passage mid-planes to allow both a vertical and horizontal traverse, as indicated in figure 10. A 4 mm Airflow Developments Ltd. Pitot-static tube was used to make time-averaged velocity measurements in each traverse direction to determine the uniformity of flow in the passage. Initially, no flow conditioning was installed in the supply loop between the blower and supply passage. The vertical Pitot traverse revealed significant non-uniformity in the flow due to a combination of flow turning through the bends, and a residual effect of the fan. Progressive levels of conditioning, consisting of 2 mm square nylon mesh screens, were inserted into the loop at flanged connections between the transitions and 180 degree bends upstream of the passage. The process was incremental, starting with a single layer of mesh at the upper flange, and adding up to two layers of non-aligned mesh at the upper and lower flanges. A 5 cell diameter long section of honeycomb straightener was also positioned in the round-rectangular transition just upstream of the passage start.
Figure 10. Coolant supply passage coordinate system and probe positioning.
The resulting profiles from various configurations of mesh are shown in figure 11. It is interesting to compare the vertical profiles with those from a horizontal traverse, as shown in Figure 12. Immediately it can be seen that the horizontal profiles exhibit far less variation than their vertical profile counterparts. This led to the conclusion that the large peaks in the vertical profiles near the walls and significant variation through the interior could not be due to the blower, as some radial consistency in the profiles would be expected. Attention was subsequently drawn to the positioning of the honeycomb in the end of the round-rectangular transition. It was possible, due to the convergent angle of the transition upper and lower walls, that some coolant may have been ejected from around the honeycomb at an angle to the passage axis. This fluid would also be slightly accelerated as it passed through the reducing flow area between the angled wall and axially aligned honeycomb exterior, and would not be subjected to pressure losses from entering and passing through the honeycomb cells. This would explain the regions of higher velocity fluid near the walls. As a result, it was decided to move the honeycomb into the rectangular supply passage to try and eliminate this feature.
Placing a layer of nylon mesh across the downstream end of the honeycomb had a significant impact on the uniformity of the velocity profile in the supply passage. This is due to the smaller mesh cell size breaking up the wakes from the honeycomb cells and thus reducing the length scale of the turbulent eddies. Smaller eddies take less downstream distance to dissipate and
create a more uniform flow more quickly. There is still some variation across the passage, however the profile is quite flat through the central region with flow uniformity to within ±1.5%.
It should be noted that in an actual turbine blade passage, the flow would be expected to be somewhat non-uniform due to the presence of turbulating ribs, passage bends, and flow effects from preceding holes. So although we wish to have a consistent and defined velocity profile upstream of the hole inlet, the creation of a typical profile for fully developed flow is not essential.
Mesh at
bend start
Mesh at bend end
Honeycomb Mesh over
honeycomb
A
B X
C X X X
[image:5.595.311.541.198.486.2]D X X X X
Table 2. Flow conditioning configurations for supply loop.
-50 -40 -30 -20 -10 0 10 20 30 40 50
4.00 5.00 6.00 7.00 8.00
Mean velocity [m/s]
Y
s
[
m
m
]
A B C D
Figure 11. Vertical centreline mean velocity profiles for different conditioning configurations – see table 2.
-90 -60 -30 0 30 60 90
3.00 4.00 5.00 6.00 7.00
Mean Velocity [m/s]
Z
s
[
m
m
]
C D
Figure 12. Horizontal centreline mean velocity profiles for different conditioning configurations – see table 2.
Flow direction
A 3-hole wedge probe was used to assess the flow direction in the mid planes of the supply passage. The results, shown in figure 11, indicate that the honeycomb flow straightener works well. Flow direction is parallel to the passage walls to within ±1° . 3D
xs
ys D
2D
[image:5.595.49.270.354.456.2] [image:5.595.311.541.520.692.2]-90 -60 -30 0 30 60 90
-1 -0.5 0 0.5 1
Flow angle [deg]
Z
s
[
m
m
]
Figure 13. Coolant supply passage flow direction in centreline vertical (xs-ys) plane.
Turbulence intensity
A single axis hot-wire probe provided measurements of average velocity and turbulence intensity in the supply passage. Measurements revealed good agreement with velocity profiles from the Pitot-static traverse. Turbulence intensity values of about 2% were measured through the central region of the passage flow. The effect of the mesh on the downstream side of the honeycomb flow straightener can be seen in the uniformity of the turbulence intensity through this central region in both figure 15 and 17.
-50 -40 -30 -20 -10 0 10 20 30 40 50
4.00 5.00 6.00 7.00 8.00
Mean velocity [m/s]
Y
s
[
m
m
]
[image:6.595.45.273.89.280.2]Pitot Hot-wire
[image:6.595.310.542.90.259.2]Figure 14. Supply passage mean velocity profiles from hot-wire and Pitot traverses in the centreline vertical (xs-ys) plane. Configuration D – see
table 2.
-50
-40
-30
-20
-10
0
10
20
30
40
50
0 5 10 15 20
Turbulence intensity [%]
Y
s
[
m
m
]
Figure 15. Turbulence intensity profile in the centreline vertical (xs-ys)
plane. Configuration D – see table 2.
-90 -70 -50 -30 -10 10 30 50 70 90
4.00 5.00 6.00 7.00 8.00
Mean velocity [m/s]
Z
s
[
m
m
]
Pitot Hot-wire
Figure 16. Supply passage mean velocity profile in centreline horizontal (xs-zs) plane. Configuration D – see table 2.
-90 -70 -50 -30 -10 10 30 50 70 90
0 2 4 6 8 10 12
Turbulence intensity [%]
Z
s
[
m
m
]
Figure 17. Supply passage turbulence intensity profile in centreline horizontal (xs-zs) plane. Configuration D – see table 2.
Conclusions
[image:6.595.311.541.301.458.2] [image:6.595.44.273.438.608.2] [image:6.595.311.542.498.664.2]Turbulence intensity values in the passage freestream are 2%. The large, 50:1 scale of the cooling hole model makes this design novel, and capable of generating highly detailed flow field measurements. These measurements will enable sources of entropy production to be established, and assist in the design of more aerodynamically efficient cooling holes.
Acknowledgments
The authors wish to acknowledge Rolls-Royce Plc Derby for providing funding for this research project, in addition to ongoing support and guidance. The Author acknowledges support through receipt of an Australian Postgraduate Award.
References
[1] Gostelow, J.P. 1984, Cascade Aerodynamics, Thermodynamics and Fluid Mechanics, Pergamon Press, Sydney.
[2] Cohan, H., Rogers, G. and Saravanamuttoo, H. 1996,
Gas Turbine Theory, 4th edn, Longman Group Limited, Harlow, England.
[3] Kohli, A. and Thole, K.A. 1997, "A CFD investigation on the effects of entrance crossflow directions to film-cooling holes", paper presented to American Society of Mechanical Engineers, Heat Transfer Division, (Publication) HTD, 223-32.
[4] Gritsch, M., Schulz, A. and Wittig, S. 2003, "Effect of internal coolant crossflow on the effectiveness of shaped film-cooling holes", ASME J Turbomachinery, vol. 125, no. 3, pp. 547-54.
[5] Gritsch, M., Saumweber, C., Schulz, A., Wittig, S. and Sharp, E. 2000, "Effect of internal coolant crossflow orientation on the discharge coefficient of shaped film-cooling holes", Journal of Turbomachinery, vol. 122, no. 1, pp. 146-52.
[6] Sargison, J.E., Walker, G.E. and Rossi, R. 2004, "Design and calibration of a wind tunnel with a two dimensional contraction", paper presented to 15th Australasian Fluid Mechanics Conference, University of Sydney, 13th-17th December,
[7] Rolls-Royce Plc, Film cooling data, Personal communication to JS Porter, June 2006.
[8] Wittig, S., Schulz, A., Gritsch, M. and Thole, K.A. 1996, "Transonic film-cooling investigations: effects of hole shapes and orientations", paper presented to American Society of Mechanical Engineers, [9] Moffat, R.J. 1988, "DESCRIBING THE
UNCERTAINTIES IN EXPERIMENTAL RESULTS."
Experimental Thermal and Fluid Science, vol. 1, no. 1, pp. 3-17.
![Figure 1. Internal coolant flow path in a high pressure turbine blade [2]](https://thumb-us.123doks.com/thumbv2/123dok_us/8439689.334050/1.595.319.543.454.658/figure-internal-coolant-flow-path-pressure-turbine-blade.webp)