(1) (o)
·~.
1 give. penu.:i.sslon £04 rrr/ ,thesis to be =de nvo.iloule to ~e.aders :Lo the Hassey University Librar; undl!r c:01H.litionr; de.te.n:tlnud by 'the. )..ibrad.ao.
(~. l do not wish mJ thesis to be mod~ 8Vnilubla co rcc~arn ' \Jlthout W'/ v1·itten consent £or' - lllonths.
(2) (n)
(J) (a) (bt
l agree that my thesis, or a copy, maf be. sent to unochar
institution und~r conditions c.le.t.e.rtlinud
...
by the Lib:rbrion • l do not. \J:l.sh m/ thesis, or: a c.opy, to be sent to unotha.i: ins citution vi.thou t III'/ v:i:i tte.n consent. f 01: _ _ _ _ _ lllon thi.:, l abrc.e that my thesis nrny be. copied f.01: Library uce.l do not vish my thesis to be copied !~r Librury U!l~ !or
·• taon ths. (·
..
---'DH!. copyright of this thesis belongs to tha nuchor. Rcu<lcr!l lllU!l t:.
sign their narol! in· tlie ~pace belo\.J to sho\.J thot they recognise. this. 11,cy nre asked to udcl their perm.anent o<ldrcss.
A thesis presented in partial
fulfilment of the requirements
for the degree of Master of
Arts in Psychology, at
Massey University.
Keren Mary Lavell
ABSTRACT
The present study investigates unrealistically positive biases in human thought,
and their relationship with subjective well-being and perceived physical health.
Taylor and Brown (1988) refer to these biases as illusions, as most individuals
hold more positive perceptions for themselves than they do for most others.
Three separate illusions exist - self-perception, control, and expectations for the
future - and these are claimed to be an important element of mental health.
Traditionally, definitions of mental health have included accurate perception as
a criterion. Recent evidence has found that those with accurate perception are
instead mildly depressed, while those who have unrealistically positive
perceptions are non-depressed. The present study extends the research on
illusions and depression, to examine the illusions in relation to well-being and
health.
A self-report questionnaire, consisting of five scales, was completed by 300
Psychology students. The Anderson (1968) scale of personality trait adjectives
was used to assess self-perception. For control, items were based both on
previous experimental measures (Langer & Roth, 1975) and on locus of control
measures (Rotter, 1966). Optimism was assessed using the Weinstein (1980)
scale. The Mental Health Inventory (Viet & Ware, 1983) was used to measure
well-being, and the Cohen Haberman Inventory of Physical Symptoms (Cohen
& Haberman, 1983) was used to assess perceived physical health.
Three distinct illusions were found. Self-perception was related to positive
well-being; control was not related to the outcomes. Optimism was related to
positive and negative well-being, and to physical health, and was the strongest
predictor of the outcomes. As the measures of self-perception and control were
developed for the present study, further research is necessary to confirm their
suitability. To the extent that relationships were found, Taylor and Brown (1988)
were supported. The present study finds that illusions play a small but
ACKNOWLEDGEMENTS
I would like to express my most sincere gratitude to my supervisor Kerry
Chamberlain. His excellent knowledge of the research process, and his
thorough supervision, have been invaluable. I would also like to thank him for
his constant support and advice through each stage of this thesis.
Finally, I would like to say thank-you to my family, for the encouragement and
ACKNOWLEDGEMENTS . . . . . iii
LIST OF TABLES . . . . . . vi
INTRODUCTION . . . . . . 1
Background . . . . . . 1
The Nature of Illusions: The Need for Definition . . . . . . 4
Consequences of Illusions . . . . . . 7
Subjective Well-Being . . . . . . 9
Perceived Physical Health . . . . . . 1
o
Measuring the Illusions . . . . Measuring the Outcomes . . . . METHOD . . . . Pilot . . . ··· Respondents . . . . Procedure . . . . Survey Content 12 14 16 16 16 16 17 RESULTS . . . . . . 20DISCUSSION . . . . . . . . . . . . . . . . . . . . 25
The Nature of Illusions . . . . . . 25
Measurement Issues . . . . . 26
Illusions and Perceived Physical Health . . . . . 28
Control Theory and Health . . . . . . 29
Illusions and Well-Being . . . . . 30
Negative Well-Being . . . . . 30
Illusions: Beneficial or Harmful? . . . . . . 34
Conclusion . . . . . . 35
REFERENCES . . . . . . . . . . . . . . . . . . . . . . . . . . . . . . . . . 37
APPENDIX . . . . . . . . . . . . . . . . . . . . . 47
Table
1
2
Means, Standard Deviations, Alpha
Coefficients, and lntercorrelations
Page
of the Illusions ... 21
Correlations Obtained Between the
Three Measures of Illusions, MHI,
MHI well-being, MHI distress, and
CHIPS ... 22
3 Correlations Obtained Between the
Measures of Illusions and the
Third-Order Factors of the MHI.. ... 23
4 Multiple Regression Data for MHI
well-being, MHI distress, CHIPS, and the
INTRODUCTION
Background
The concept of mental health, its definition and structure, has long been a subject
of debate. A wide range of theories have been proposed to define mental health,
employing such criteria as the absence of mental illness, and adjustment to what
is "normal". In a review of the literature, Jahoda (1958) determined six major
components of mental health. These were attitudes toward self, self-actualisation,
integration, autonomy, perception of reality, and environmental mastery. Of these,
accurate perception of reality has traditionally been considered to be important.
Human thought and behaviour occurs within the context of the world as it is
perceived by the individual. As Jourard & Landsman (1980) concluded, effective
action is not possible unless the individual has an accurate perception and valid
beliefs about the world. This capacity has been adopted as a criterion by many
researchers (Jourard & Landsman, 1980; Snyder, 1989). As Jahoda (1958)
stated, " ... the perception of reality is called mentally healthy when what the
individual sees corresponds to what is actually there ... " (p.49).
This view at least partially derives from the fact that the research has been
conducted on clinical populations, for whom lack of contact with reality is a
distinguishing symptom. Conflicting evidence, however, has found that mildly
depressed individuals may be more in contact with reality than "normal"
individuals. It has been found that mildly depressed individuals display
significantly less cognitive distortion than non-depressed individuals (Abramson
& Alloy, 1981; Alloy & Abramson, 1979; Galin, Terrell, & Johnson, 1977;
Lewinsohn, Mischel, Chaplin & Barton, 1980). Ruehlman, West and Pasahow
(1985) reviewed the evidence, finding that mildly and moderately depressed
individuals demonstrated comparatively unbiased responses in the areas of
contingency judgements, causal attributions, expectancies, and self reference.
patterns, while non-depressed individuals showed positively biased response
patterns. In their review, Taylor and Brown (1988) supported these findings,
concluding that biases occur in three specific areas. These are self-perception,
perception of control over the environment, and perception of the future. Taylor
and Brown (1988) suggest that, contrary to earlier beliefs, exaggerated
perceptions are an adaptive and crucial element of mental health. They suggest
that these perceptions rely on a series of social and cognitive filters which make
information more positive, and reduce any adverse aspects. Hence, under
threatening circumstances these distortions are particularly adaptive. In an earlier
paper, Taylor (1983) proposed that the ability to sustain and modify these
perceptions is vital for successful adjustment; they buffer against both present
threats and future setbacks. Taylor and Brown (1988) describe these perceptions
as "illusions", implying, " ... a general enduring pattern of error, bias or both that
assumes a particular direction or shape ... " (p. 194). These illusions consist of
overly positive self-evaluation, exaggerated perceptions of control or mastery, and
unrealistic optimism; they are proposed to be part of normal human thought, and
a necessary element of mental health.
The first of these illusions is an unrealistic view of the self. The premise is that
individuals tend to judge themselves as better than most others, even though this
is not objectively warranted. People overestimate their management abilities
(Larwood & Whittaker, 1977), and overestimate the consensus of others for the
opinions and abilities they hold (Campbell, 1986). The traits which individuals rate
as most important for themselves form the criteria by which they judge other
people (Lewicki, 1983, 1984). After describing themselves using an adjective
checklist, individuals remembered best those adjectives which were most
self-serving (Brown & Taylor, 1986). Self-ratings of social interaction are considerably
higher than ratings of the same subjects by trained observers (Lewinsohn et al.,
1980). Alicke (1985) found that ratings of the self, compared with ratings of the
"average" college student, were increasingly positive as traits increased in
desirability. Individuals judge positive traits as much more like themselves than
information better than negative information (Kuiper & Derry, 1982). This is
consistent with findings that individuals judge themselves more positively than
others judge them (Lewinsohn et al., 1980). Negative aspects of the self are
perceived as being both common to many people, and also as less important
(Campbell, 1986). Positive outcomes are attributed to the self rather than to
others (Bradley, 1978), and failure is- recalled less well than success (Silverman,
1964). This evidence demonstrates the tendency of individuals to perceive
themselves in a self-serving manner, and to compare themselves with others in
an overly positive way.
The second of the illusions is an unrealistic perception of the control, or mastery,
an individual has over the environment. Much of the research has utilised
task-outcome scenarios, in which individuals' perceptions of their control over the
outcome are measured. This has included gambling scenarios in which
individuals participated in a dice game and rated their confidence in obtaining the
desired outcome (Golin et al., 1977). Similarly, Langer and Roth (1975) had
individuals predict the outcome of coin tosses, then rate their confidence in their
ability to make correct predictions (meanwhile ensuring their success rate was
random). Alloy and Abramson (1979) also used this format, whereby individuals
were required to estimate their control in what was actually a chance situation.
Individuals learned to turn on a light by pressing a button, and then predicted the
degree of control they had over light onset. In all these situations, individuals
overestimated the degree of control they would have, even in situations where the
outcome was purely random. Individuals attribute their outcomes (success or
failure) on a task according to self-serving biases, so that their perception of
control is overly positive (Kuiper, 1978). This is true even for situations in which
there is no control at all (Alloy, Abramson & Viscusi, 1981; Langer, 1975). Langer
and Roth (1975) found that perceived success resulted in higher perceptions of
control because it induced a skill orientation. Where the outcome was perceived
to be affected by skill, individuals were more likely to have unrealistic perceptions
of control. As most individuals assume they have more control than most other
(Taylor & Brown, 1988).
The third illusion is one of unrealistic optimism regarding future events. Research
suggests individuals are optimistic about the future. Most individuals believe that
in most situations they will be able to attain desired goals (Fibel & Hale, 1978)
and college students reported that negative possibilities for them in the future
were outweighed four times over by positive possibilities (Markus & Nurius, 1986).
Evidence for the unrealistic nature of optimism is derived from individuals whose
predictions reflect what they would like to occur, for example in predicting the next
president (Cantril, 1938). They also predict what is socially desirable, for example
overestimating the likelihood of their acting in socially desirable ways (Sherman,
1980). This optimism is more in evidence for the self than for others. Individuals
rated themselves as more likely than their peers to experience good events, such
as liking their first job, or getting a good salary (Weinstein, 1980). They also rated
themselves as less likely than their peers to experience negative events, such as
becoming depressed (Kuiper, MacDonald & Derry, 1983). Similarly, they believe
they are less likely to have a car accident, become a victim of crime, or become
ill (Kuiper et al., 1983; Robertson, 1977).
Evidence for the illusory nature of these perceptions is derived from the fact that
most people perceive themselves as having more positive qualities, more control,
and a better future than most other people will have. This demonstrates a
consistent bias in perception, in a positive direction; that is, an illusion.
The Nature of Illusions: The Need tor Definition
Taylor and Brown (1988) propose three separate illusions. However, they do not
discuss separate outcomes for each of the illusions. Rather, the outcomes are
discussed as resulting from illusions in general. This raises two issues. Firstly,
while existing as separate entities, the illusions may be occurring concurrently, so
that the attribution of specific outcomes to specific illusions has so far not been
possible. Secondly, the illusions may not be separable at all, but may instead be
investigate this.
There is evidence which relates specifically to self-perception. Individuals rated
trait adjectives as much more characteristic of themselves when the traits were
more desirable (Alicke, 1985). They also recalled positive self-descriptive
adjectives more readily than negative adjectives (Kuiper & Derry, 1982). Those
traits judged by individuals as most important for themselves were also judged
most important for others, demonstrating a self-image bias in person perception
(Lewicki, 1983, 1984). This evidence clearly supports an illusion of
self-perception which is distinct from the other illusions as proposed by Taylor and
Brown (1988).
Other research cited by Taylor and Brown (1988) contradicts this conclusion,
however. Miller and Ross (1975) studied self-serving biases in attribution under
conditions of success and failure. This work was extended by Zuckerman (1979)
who considered the reasons for the biases. Rizley (1978) also examined biases
in attributions for success and failure under various conditions. These studies
found that when presented with conditions of success or failure, individuals will
perceive the outcomes in a manner which is self-enhancing. Thus to a certain
extent, an illusion of self-perception is supported. However, the perception that
one is responsible for, and has control over, a successful outcome when not
objectively warranted, can also be interpreted as an illusion of control. As these
findings can be explained by two supposedly distinct illusions, doubt is cast on the
structure proposed by Taylor and Brown (1988). The possibility is raised that the
illusions either occur concurrently, or exist as aspects of one general illusory
process.
This also applies to the illusion of control and the evidence cited by Taylor and
Brown (1988). Investigations used behavioural tasks in which individuals estimate
their control in chance or low control situations (Alloy & Abramson, 1979; Galin,
et al., 1977; Langer, 1975; Langer & Roth, 1975). Such studies, however, also
state that the belief that one will experience more positive events in the future
than the average person is part of the definition of optimism. Galin et al. (1977)
Langer and Roth (1975) and Rizley (1978) each examined expectations for future
events in some form, therefore the evidence does not conclusively separate
control and optimism.
Evidence cited for the illusion of optimism includes individuals' estimates of their
own positive behaviour in the future (Sherman, 1980) and predictions of positive
aspects of "possible selves" (Markus & Nurius, 1986). Also included are
measures of optimism for future positive events (Weinstein, 1980), and affect and
recall surrounding potential positive and negative events (Pietromonaco & Markus,
1985). This research exclusively supports an illusion of optimism; it can not be
interpreted as support for the other illusions.
However, not all the studies of optimism have found such unequivocal results.
Alloy and Ahrens (1987) required respondents to estimate their expectancies for
future success and failure in a given hypothetical situation. Expectancies for
success and failure on various tasks were also obtained by Irwin (1944, 1953)
and Marks (1951 ). Such studies do examine optimism for future events,
supporting the existence of an illusion of optimism. However, perceptions
regarding the outcomes of tasks are also influenced by perceptions of control over
those tasks. These studies, cited by Taylor and Brown (1988) as supporting an
illusion of optimism, have in effect measured an illusion of control. Thus, it is
possible that optimism is a distinct illusion but occurs concurrently with control.
Alternatively, optimism may be one aspect of a general illusory process.
The way in which the evidence is presented by Taylor and Brown (1988)
precludes drawing any conclusions regarding the structure of illusions. There is,
however, an alternative means of unravelling the issue. The overlap of illusions
may be caused by the way in which Taylor and Brown (1988) organised their
discussion of the research, rather than an overlap of illusions per se. Reshuffling
reduce the blurred boundaries. To enable this, a more precise definition of each
illusion would facilitate accurate allocation of evidence.
Evidence for the illusion of self-perception must restrict itself to self-perception,
and not include studies examining success/failure (e.g., Miller & Ross, 1975)
which belong in the control category. As an example, Taylor and Brown (1988)
cited a study on attributions for success and failure (Rizley, 1978) as evidence of
self-perception. According to the more precise definition, this study more
accurately supports an illusion of control. The misallocation of this evidence
resulted in the incorrect conclusion that self-perception and control could not be
separated. In fact, they appear as distinct entities when definitions are precise
and evidence is correctly cited. In dealing with the illusion of control, only those
studies examining control in the present should be included, not expectancies of
control in the future (e.g., Galin et al., 1977; Langer & Roth, 1975). This would
prevent control from overlapping with optimism. Finally, optimism must be more
carefully defined as that which refers to the future, and not as success/failure on
a behavioural task in the present, to reduce any overlap with the illusion of control
(e.g., Alloy & Ahrens, 1987).
It is likely the illusions do influence each other, and that there will be some
overlap, for example, self-perception will most likely affect the way in which
control and the future are perceived. The exact nature of this interaction is an
area for research. With appropriate definitions and allocation of evidence,
however, it can be concluded that the three illusions discussed by Taylor and
Brown (1988) are separate entities.
Consequences of Illusions
The evidence for illusions, as drawn together in Taylor and Brown (1988), is
based largely on studies which compare depressed and non-depressed
individuals. This evidence suggests that people who have illusions are
non-depressed. For example, Lewinsohn et al. (1980) found that non-depressed
Non-depressed individuals were also found to have unrealistic perceptions of control
(Abramson & Alloy, 1981; Galin et al., 1977) and overly positive optimism
(Weinstein, 1980). The absence of illusions is associated with mild depression,
and illusions are associated with being non-depressed. Taylor and Brown (1988)
extended this, proposing that individuals with illusions are mentally healthier.
Reviews of the criteria of mental health have been distilled from the literature by
Jourard and Landsman (1980) and Jahoda (1958). Taylor and Brown (1988)
draw upon these reviews to define mental health as consisting of happiness, the
ability to care for others, and the capacity for creative, productive work. The
reviews included accurate self-evaluation which Taylor and Brown (1988) omitted
as it is inconsistent with the premise that individuals have unrealistically positive
self-perception.
There is some evidence for the relationship between illusions and these criteria
of mental health. The first aspect to be considered is the link between illusions
and happiness. Most people report being happier than most other people, which
is by definition illusory (Freedman, 1978). Those who report high control and
optimism for the future, which may have illusory aspects, are more likely to report
present happiness (Freedman, 1978). There is also some evidence that illusions
may directly influence mood (Macfarland & Ross, 1982) which has implications
for happiness.
The second aspect of this evidence is the link between illusions and the ability to
care for others. High self-evaluation, associated with an illusion of self-perception,
is important for social bonding (Bohrnstedt & Felson, 1983). Illusions are related
to positive mood, and those with positive mood are more likely to help others
(Batson, Coke, Chard, Smith, & Taliaferro, 1979) and to express their liking for
others (Gouaux, 1971 ).
The third aspect is the capacity for creative, productive work. There is some
affect, which may result from illusions, helps retrieval of positive information and
problem solving (lsen & Means, 1983). Positive conceptions of the self are
associated with working harder and longer on tasks (Felson, 1984), and
perseverance leads to more effective performance and increased likelihood of
goal achievement (Bandura, 1977). Illusions may lead to more positive evaluation
of performance, facilitating increased motivation, persistence and performance in
a different way (Vasta & Brockner, 1979).
However, as Taylor and Brown (1988) themselves state, conclusions based on
this limited evidence are tenuous and inconclusive. There is no evidence that
manipulation of success and failure by Macfarland and Ross (1982) actually
manipulates illusions. The illusory aspects of the attribution process were not
specifically tested. The measures of "the ability to care for others" are peripheral
only. The rate of initiating conversations is not necessarily a measure of the
ability to care. The two aspects may be related, but one does not imply the other.
Finally, it has been claimed that illusions are related to higher persistence and
perseverance, and that this in turn is indirectly related to mental health. However,
higher persistence has not always been found to be adaptive (see Janoff-Bulman
& Brickman, 1982).
While the results of illusions generally remain unclear, there are some exceptions
in which specific consequences can be related to specific illusions. Kuiper and
Derry (1982) found that positive mood was related to illusions of self-perception.
Scheier and Carver (1985) found that optimism is associated with less physical
symptom-reporting, supporting the claim that the illusion of optimism is related to
physical health. Although this research provides direct evidence of the results of
illusions, the studies are few in number, the exception rather than the rule.
Research is required not only to determine the relationship between mental health
and illusions, but also to determine the contribution of each illusion separately.
Subjective Well-Being
and Brown (1988) argument. They claim that the relationship between illusions
and positive affect (or happiness) may be an indirect route by which illusions
affect other criteria of mental health. However, they concede this link is
theoretically weak and requires further empirical evidence.
There is evidence that self-perception, control and optimism are associated with
well-being. For example, self-esteem (Anderson, 1977) and self concept
(Drumgoole, 1981) are related to general life satisfaction. Perceived autonomy
(control over one's life) is positively associated with life satisfaction for older adults
(Eisenberg, 1981 ). Freedman (1978) found a relationship between optimism and
happiness. These studies have not, however, specifically examined the illusory
aspects of the relationships, and the findings regarding illusions remain tentative.
Within the context of depression, research has been conducted focusing on these
illusory aspects (Alloy & Abramson, 1979; Galin et al., 1977). It is from this that Taylor and Brown (1988) proposed that those with illusions would have higher
levels of well-being. An absence of depression, however, does not imply the
presence of well-being. According to the World Health Organisation definition
(1948, in Ware, Johnston, Davies-Avery, & Brook, 1979) "health is a state of
complete physical, mental, and social well-being and not merely the absence of
disease or infirmity". As yet there has been no systematic examination of illusions
and mental health. To determine the relationship between each of the three
illusions and positive and negative well-being is, therefore, an area requiring
investigation.
Perceived Physical Health
There is evidence which indicates a relationship between illusions and perceived
physical health. Kobasa (1979) and Kobasa, Maddi, and Kahn (1982) found an
association between hardiness (which includes perceptions of control), and
physical health and illness symptoms. Larwood (1978, in Myers & Ridl, 1979)
found that Los Angeles residents think that they are healthier than the average
individual. When a group of students were given insurance company longevity
be supported by the actuarial data (Snyder, 1978). Evidence suggests that
individuals perceive a comparatively reduced chance of illness for self compared
with others; that is, they have an illusion of greater vulnerability of illness for
others. Kirscht, Haefner, Kegeles and Rosenstock (1966) found that others were
rated as more susceptible than self to diseases such as tuberculosis and cancer.
Individuals also rate their chances of negative events such as having a heart
attack as less than that of the average individual (Weinstein, 1980). This may be
because they compare themselves with an unrealistic stereotypic average person
who does nothing to decrease the likelihood of these events. Perloff and Fetzer
(1986) named this phenomenon an "illusion of unique invulnerability", finding that
the chances of experiencing negative life events, such as contracting diabetes or
venereal disease, were rated as less than that of the average person.
Perloff (1983) suggests that this illusion may serve the purpose of increasing
feelings of control, thus reducing anxiety and psychological distress. The belief
that one's coping abilities are extraordinary in dealing with breast cancer is
common, and has been found to be associated with successful adjustment to the
cancer (Wood, Taylor & Lichtman, 1985). Taylor, Lichtman and Wood (1984)
found that the belief that one can personally prevent cancer from returning is also
common. Taylor (1983) suggests that illusions of self-perception, self-efficacy and
expectancies for the future can be found in individuals dealing with potentially
tragic events such as cardiac illness and rape.
There is a considerable body of evidence which indicates a relationship between
illusions and health. Some of this evidence specifically examines one of the three
illusions. Weinstein (1980) investigated the illusion of optimism using perceptions
of risk regarding health events. Scheier and Carver (1985) examined the
relationship between the illusion of optimism and physical symptom-reporting.
Taylor et al. (1984) examined perceptions of control regarding cancer, finding
evidence of an unrealistically positive bias. However, apart from a limited few,
there has been no systematic investigation of each of the illusions. The present
with perceived physical health.
Measuring the Illusions
The many studies cited by Taylor and Brown (1988) utilised a wide range of
measurements. One of the difficulties in interpreting the research has been that
the illusory aspects of self-perception, control, and optimism have not always
been examined. As the present study represents the first attempt to
systematically measure the three illusions proposed by Taylor and Brown (1988),
it is vital the measurements be appropriate, and examine the actual illusions.
When measuring self-perception, an individual may have more positive traits than
negative traits. They may also be justified in judging themselves more positively
than another person. However, if all individuals judge themselves more positively
than they judge others, this is evidence of a positive bias (all individuals cannot
be better than all other individuals). Unfortunately, the evidence cited does not
necessarily test the illusory aspects. As examples, the self-ratings found by
Lewicki (1983, 1984) and the recall of adjectives found by Kuiper and Derry
(1982) may have been accurately reflecting individual qualities; evidence of an
"illusion" would only be found if the self-ratings were compared with ratings for the
average student (a consistent tendency for subjects to judge themselves more
positively than the average would be evidence of an illusion).
A frequently used form of measurement of self-perception is one in which
individuals rate both themselves and the "average" other person on a variety of
personality traits (Alicke, 1985; Brown & Taylor, 1986; Kuiper & Derry, 1982;
Lewicki, 1983, 1984). The Anderson (1968) scale is one which has been used
for this purpose (Alicke, 1985; Brown & Taylor, 1986). This is a list of personality
trait adjectives rated on the dimension of likableness. This measure can be easily
adapted to measure the illusion of self-perception by requiring a comparison of
self with others on each trait. This scale has a very high reliability (Anderson,
1968) and is appropriate for the measurement of the illusion of self-perception in
There have been a range of experiments examining the illusion of control. Most
of these have used gambling formats in which respondents estimate their chances
of success in a low - or no - control situation (Golin et al., 1977; Langer, 1975;
Langer & Roth, 1975). When aspects suggesting skill, such as competition, are
introduced people behave as if the outcome is determined by skill and not
chance. Those in whom a negative mood has been induced instead demonstrate
more realistic perceptions of personal control (Alloy, Abramson & Viscusi, 1981 ).
Alloy and Abramson (1979) found that when there was some control over the
outcome both depressed and non-depressed individuals gave accurate
judgements of contingency. However, when the contingency was zero,
non-depressed individuals demonstrated an illusion of control. This method assesses
perceptions of control in situations where such perceptions are not objectively
warranted; that is, the illusory aspects of control. The experimental tasks will be
used as the basis for self-report items for the present study.
This adaptation represents the first attempt to use a purely self-report format,
without actual tasks, to assess control. As an initial attempt, some potential for
improvement might be expected. Additional questions were sought to strengthen
the measure.
Locus of control is the extent to which individuals perceive contingency
relationships between their actions and the outcomes. An external locus of
control is the perception that outcomes are due to factors extrinsic to the
individual. Internal locus of control is the perception that the contingency
relationship is due to intrinsic factors. According to Taylor and Brown (1988)
perceptions of control are subject to self-enhancing biases. By including these
biases, the definition of locus of control can be expanded so that it defines the
illusion of control.
Preliminary investigations demonstrated that items based on locus of control, and
items based on practical tasks, appeared to assess control in the same way. The
requirement of the present study, and they can be adapted to assess the illusory
aspects by examining the way individuals compare themselves to others on each
of the items. Items were taken from the Multidimensional Internal-External
Control Scale (Gurin, Gurin, Lao, & Beattie, 1969), and Rotter's Internal-External
Locus of Control Scale (Rotter, 1966, in Robinson & Shaver, 1973) selected for
their relevance to the illusion of control.
Optimism has previously been assessed using the Weinstein (1980) scale,
designed specifically to measure this illusion. This is a list of 18 clearly positive
and 24 clearly negative events. Respondents rate the chances of each event
occurring to them, compared with the chances for the average student. It is
usually difficult to show that optimistic expectations are unrealistic - an individual
may have a greater than average chance of experiencing positive events, and a
less than average chance of experiencing negative events. A simple comparison
of optimistic and pessimistic responses is not enough to show a systematic
(consistently positive) bias. On a group basis, however, an optimistic bias can be
tested for. If all people claim their chances are greater than those of the average
person, this demonstrates an illusion of optimism.
Measuring the Outcomes
There has been debate regarding the structure of mental health. Measurement
within general populations initially focused on negative components, such as
anxiety and depression (Ware et al., 1979). However, conclusions from recent
research are that mental health consists of positive and negative components.
Measurements have accordingly been expanding, to cover not only symptoms of
illness, but also symptoms of well-being. Bradburn (1969, in Zautra, Guarnaccia,
& Reich, 1988) claimed that these positive and negative states are independent.
However, subsequent research supports that they are separate, but highly
correlated, states (Zautra et al., 1988).
The Mental Health Inventory (MHI) (Viet & Ware, 1983) assesses how often
mental health on three levels. The first is general mental health; the second
divides mental health into psychological distress and psychological well-being; the
third divides well-being into positive affect and emotional ties, and distress into
anxiety, depression, and loss of behavioural/emotional control. Items describing
positive states cluster to define psychological well-being, and items describing
negative states cluster to define psychological distress. The factors are treated
as distinct but correlated. Support was found for this hierarchical structure by
Tanaka and Huba (1984).
The MHI is an appropriate measure for the current study. It allows examination
of the hypothesis that illusions will be related to psychological well-being. It also
provides the opportunity for confirmation of past research which has found that
illusions are related to non-depression. Included in the MHI is a measure of
depression, and it is expected that those individuals with illusions will exhibit lower
levels of depression.
Within the research on illusions and physical health various facets have been
investigated. One of these is the illusory aspect of perceived risk for negative
health events (Perloff & Fetzer, 1986; Weinstein, 1980). Another is the illusory
aspect of coping with, and adjustment to, major illnesses and potentially tragic
events (Taylor, 1983; Taylor et al., 1984; Wood et al., 1985). These measures
are only relevant in a peripheral way, as they do not measure perceptions of
physical health itself. Hence, although a relationship is alluded to, perceived
physical health has not been specifically measured in relation to illusions. The
exception to this is the work by Scheier and Carver (1985). They investigated the
relationship between the illusion of optimism and physical symptom-reporting.
They successfully used the Cohen Haberman Inventory of Physical Symptoms
(CHIPS) (Cohen & Haberman, 1983). This is a checklist of 39 common physical
symptoms rated on a scale for the degree to which they bother or distress the
individual. It represents symptoms commonly found in the population and is an
METHOD
Pilot
As the measures of the illusions of self-perception and control were developed for
the present study, and had not previously been combined with the Weinstein
(1980) scale, a pilot test was conducted. Twenty students at Massey University
completed the pilot questionnaire of measures of the three illusions. Included
were the complete version of the Weinstein (1980) measure of optimism, 40 items
of the Anderson (1968) scale of self-perception, and 8 items measuring control.
Respondents encountered no difficulties completing the items, and it was decided
the measures were suitable for the study.
Respondents
Three hundred Psychology students at Massey University completed the
questionnaire. Twenty of the respondents returned incomplete questionnaires,
and were excluded from further analysis. Demographic data was provided by 268
respondents. The group ranged in age from 16 to 63 years, with a mean age of
20 years (SD
=
4.89). There were 17 4 (62%) females and 94 (34%) males.Procedure
Sampling was conducted during class time in the winter term. Questionnaires
were completed at this time, and took 20 to 30 minutes. Students were informed
that the research concerned well-being, and that they would be required to
complete a questionnaire examining how students compare themselves with
others. They were informed the study was voluntary and anonymous. They were
also informed that feedback on the study would be provided once analysis was
complete; the researcher would be available to respond to queries in the
Survey Content
The questionnaire included five self-report scales. These examined
self-perception, control, optimism, psychological well-being, and perceived physical
health.
The self-perception measure was based on Anderson's (1968) scale, consisting
of a list of 555 personality trait adjectives, rated on the dimension of likableness.
Correlations of the normative likableness values with similar data from three other
universities ranged from .96 to .99 (Anderson, 1968). Forty items, consisting of
the 20 items judged most and least likable, were used (Brown & Taylor, 1986).
Where a complementary pair of words occurred, for example "sincere" and
"insincere", one was omitted and the next item from the list selected. Those items
with meaningfulness ratings under 350 and variance greater than 1.0 were also
omitted (Brown & Taylor, 1986). Respondents rated themselves, compared with
other students, on each adjective. Items were presented in the following format:
"Compared to the average Massey student I am ... "
1---2---3---4---5
much less
kind
average much more
kind
The original 7-point scale was adapted to a 5-point scale in order to make it
consistent with scales used for the other measures of illusions.
The control measure consisted of 17 items drawn from two sources. Firstly, items
were drawn from previously used experimental measures assessing perceptions
of control (Galin et al., 1977; Langer & Roth, 1975; Rizley, 1978). Respondents
assessed the degree of control they would have, compared to other students, in
a range of hypothetical situations based on these experimental measures. As the
actual degree of possible control was zero, any perceptions of control were
"When playing a board game, would you rather throw
the dice, or let someone else throw for you?"
Secondly, items were modified from two measures of locus of control; the
Multidimensional Internal-External Control Scale (Gurin et al., 1969), and Rotter's
Internal-External Locus of Control Scale (Rotter, 1966, in Robinson & Shaver,
1973). Items were selected for their compatibility with those drawn from the
experimental measures, and were adapted so that subjects were required to
compare themselves with others. In this way the illusory nature of control was
measured. An example is as follows:
"Compared with the average person, how much of your
life is controlled by accidental happenings?"
The illusion of optimism was measured using the Weinstein (1980) scale, which
assesses perceptions of the likelihood of 42 positive and negative events for self
compared with others. In some cases the wording was adapted slightly to make
it appropriate for a New Zealand population. This scale has the advantage of
being specifically designed to measure the illusion of optimism, although
Weinstein (1980) did not cite reliability or validity data. An example is:
"Compared to the average Massey student, what are
the chances that you will have your car stolen?"
The fourth measure was the Mental Health Inventory (Veit & Ware, 1983) which
has 38 items and is scored on a 7 point rating scale. This was developed for use
in general populations, and assesses psychological well-being and distress. It is
based on a hierarchical factor model composed of a general underlying mental
health factor. There is a higher order structure defined by two correlated factors,
Distress and Well-Being, and five correlated lower order factors, Anxiety,
Depression, Emotional Ties, General Positive Affect, and Loss of
Behavioural/Emotional Control. Internal consistency estimates for the two higher
order factors and the MHI range from .92 to .96, indicating high reliability (Veit &
The final measure was of perceived physical health. The scale used was the
Cohen Haberman Inventory of Physical Symptoms (CHIPS) (Cohen & Hoberman,
1983). This is a checklist of 39 common physical symptoms. Although there are
some physical symptoms which could be viewed as psychosomatic, items of an
obviously psychological nature are excluded. Six items were deleted from this
questionnaire, at the suggestion of the original authors (S. Cohen, personal
communication, April 8, 1988). The internal reliability of CHIPS is .88, and in two
separate college samples CHIPS was found to be significantly correlated with the
use of Student Health Facilities (.22 and .29) (Cohen & Haberman, 1983). This
measure enables assessment of physical symptom-reporting which does not
RESULTS
Scores for analysis were obtained by calculating total scores for each scale. If
there were less than 10% missing data, values were compensated for with the
mean of the data. If more than 10% were missing, the scale was eliminated from
the analysis. The exception to this was CHIPS where it was assumed that
missing data indicated that the item was irrelevant to the respondent.
Internal consistency was examined for each of the measures of illusions, using
Cronbach's alpha. The internal reliabilities of self-perception and optimism were
high, while the reliability of control was moderate. The high reliability (alpha
=
.91) of self-perception was consistent with the high intraindividual reliability found
by Anderson (1968). Initial analysis of control revealed a low to moderate
reliability (alpha= .48). Items 7 and 10 were negatively correlated with the total
score and were deleted. The new measure with these items deleted had a
slightly improved reliability (alpha= .58). All subsequent analyses were based on
the modified measure. A high reliability (alpha= .82) was found for optimism.
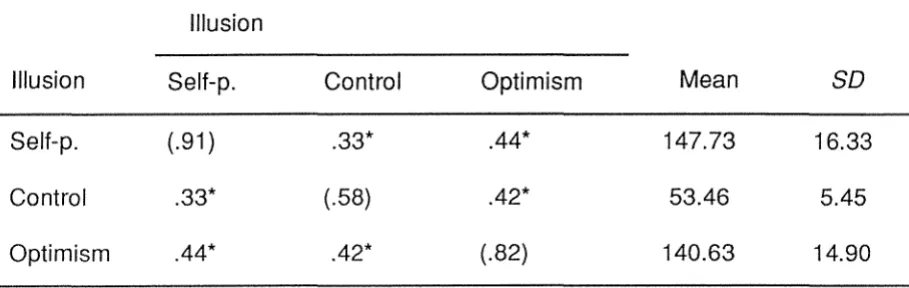
Correlations between each of the measures of illusions were low to moderate (see
Table 1 ). High correlations would have indicated either that the scales were
measuring the same construct, or that the illusions were not found to occur
separately. However, low to moderate correlations indicated that the three scales
Table 1
Means, Standard Deviations, Alpha Coefficients, and lntercorrelations of the Illusions (f'/=278)
Illusion
Illusion Self-p. Control Optimism Mean SD
Self-p. (.91) .33* .44* 147.73 16.33
Control .33* (.58) .42* 53.46 5.45
Optimism .44* .42* (.82) 140.63 14.90
* p < .001
Note: alpha coefficients shown on diagonal
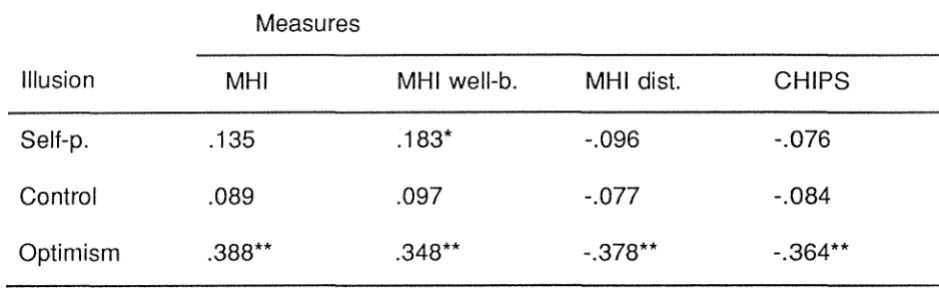
Next, correlations were examined for the relationships between the illusions, and
well-being and health. The second-order factors of the MHI, MHI well-being and
MHI distress, were included (see Table 2). The MHI correlated moderately with
optimism (r
= .388**,
p < .001 ); no significant relationships were found with the other illusions. MHI well-being correlated to a low level with self-perception (r=
.183*,
p
< .01 ), and to a moderate level with optimism (r=
.348**,p
< .001 ). Norelationship was found for MHI well-being and control. For MHI distress, a
moderate relationship was found with optimism (r
=
-.378**, p < .001 ); no significant relationships were found with the other illusions. CHIPS correlated ata moderate level with optimism (r
= -.364**,
p < .001 ), in a negative direction as predicted. No relationship was found for CHIPS with the other two illusions. Boththe MHI and CHIPS correlated most strongly with the optimism measure. There
was some concern that the relationship between optimism and health might be
a function of the health-related items of CHIPS. However, when the 16 items
[image:29.568.87.542.187.331.2]-.265**, p < .001 ), although somewhat smaller.
Table 2
Correlations Obtained Between the Three Measures of Illusions, MHI, MHI well-being, MHI distress, and CHIPS
Measures
Illusion MHI MHI well-b. MHI dist. CHIPS
Self-p. .135 .183* -.096 -.076
Control .089 .097 -.077 -.084
Optimism .388** .348** -.378** -.364**
* p < .01 ** p < .001
Finally, correlations between the third-order factors of the MHI and the measures
of illusions were examined (see Table 3). The second-order factors of the MHI,
MHI well-being and MHI distress, are composed of five component factors (Viet
& Ware, 1983). MHI well-being consists of positive affect and emotional ties.
MHI distress consists of anxiety, depression, and loss of behavioural/ emotional
control. Of the well-being factors, positive affect correlated to a low degree with
self-perception (r = .184*, p < .01 ), and to a moderate degree with optimism (r =
.367**, p < .001 ). Emotional ties correlated to a low degree with self-perception
(r
=
.150*,p
< .01) and optimism (r=
.175*,p
< .01 ). No relationship was found for emotional ties and control. Of the MHI distress factors, anxiety correlated withself-perception to a low degree (r= -.151*, p< .01), and optimism to a moderate
degree (r = -.409**, p < .001 ). Low correlations were found for depression with optimism (r
=
-.269**, p < .001) and behavioural/emotional control with optimism [image:30.568.78.548.249.394.2]Table 3
Correlations Obtained Between the. Measures of Illusions and the Third-Order Factors of the MHI
Third Order Factors of MHI
Illusion PA
Self-p. .184*
Control .134
Optimism .367**
* p < .01 ** p < .001
PA: positive affect
ET: emotional ties
A: anxiety
D: depression
ET
.150*
.107
.175*
B/E: behavioural/emotional control
A
-.151 *
-.099
-.409**
D B/E
-.024 -.064
-.038 -.123
-.269** -.363**
Multiple regressions were conducted to examine the ability of the illusions to
jointly predict scores on MHI well-being, MHI distress and CHIPS (see Table 4).
For each regression, the three illusion measures were forced into the equation on
a single step. Jointly, the illusions predicted MHI well-being (adjR2 = .125, df =
3,273, p < .001 ), MHI distress (adjR2
= .148,
df= 3,273,
p < .001 ), and CHIPS (adjR2=
.120, df=
3,269, p < .001 ). This confirmed the results of the correlational analyses. Of the illusions separately, only optimism was significantlyrelated to the outcomes. Self-perception and control did not increase the
predictive ability, demonstrating that optimism is the most important of the three
Table 4
Multiple Regression Data for MHI well-being, MHI distress, CHIPS, and the Illusions
Dependent B Beta t
Measures
Illusions
MHI well-being
self-p. .033 .040 .629
control -.057 -.023 -.369
optimism .321 .357 5.419**
adjR2 = .125, F(3,273) = 14.120**
MHI distress
self-p. .115 .082 1.306
control .226 .053 .857
optimism -.689 -.443 -6.795**
adjR2 = .148, F(3,273) = 16.993**
CHIPS
self-p. .108 .099 1.535
control .161 .048 .763
optimism -.491 -.408 -6.141 **
adjR2
= .120, F(3,269)
= 13.412**DISCUSSION
Theories of the structure of mental health change constantly as criteria are
examined, and new definitions proposed. A history of research using clinical
populations, for whom lack of contact with reality is commonly a symptom, has
resulted in an emphasis on accurate perception as a criterion of mental health
(Jahoda, 1958). Recent research using individuals in a nonclinical population has
found, however, they do not display such accurate perceptions as have been
assumed. Mildly depressed individuals exhibit accurate perceptions (Ruehlman
et al., 1985), while non-depressed individuals instead exhibit self-serving biases,
or illusions (Taylor & Brown, 1988).
Taylor and Brown (1988) reviewed the associations between illusions and
depression, and proposed that individuals with illusions would have higher levels
of well-being. The present study examined this relationship in terms of
self-perception, control, and optimism. Building on tentative ideas by Taylor and
Brown (1988) a relationship was also predicted for illusions and perceived
physical health. Results supported the theoretical structure of three distinct
illusions, as proposed by Taylor and Brown (1988). Self-perception was related
to the positive aspects of subjective well-being, and to anxiety among the negative
aspects. It was unrelated to physical health. Control was unrelated to either of
the outcomes. Optimism was related to both well-being and physical health.
The Nature of Illusions
From their review, Taylor and Brown (1988) concluded that the three illusions
were distinct.- However, examination of this evidence revealed that the
boundaries overlap. Evidence cited as supporting self-perception was able to be
interpreted as evidence for control (Rizley, 1978; Zuckerman, 1979). Evidence
supporting control was able to be interpreted as supporting optimism (Galin et al.,
optimism also supported control (e.g., Alloy & Ahrens, 1987; Pruitt & Hoge, 1965).
This raised the possibility that the illusions could not be separated, and were
instead different aspects of one general illusory process.
In the Taylor and Brown (1988) review, the studies were not always allocated to
the discussion of the most relevant illusion. For example, Rizley (1978) examined
expectations of control, so this study was included in the discussion of the illusion
of control. These expectations concerned the future, and the study would have
been more appropriate within the context of optimism. This confusion could have
been avoided if definitions of the illusions had been precise. When control is
limited to the present, and optimism defined as that which refers to the future, it
becomes clear that the study by Rizley (1978) is more relevant to optimism. The
definitions overlapped, not the illusions themselves. This was confirmed in the
present study, by the low relationships between the illusions, and by the different
effects each have on well-being and health. With the appropriate allocation of
evidence, the illusions appear to operate separately, rather than as aspects of one
general illusory process.
Measurement Issues
By their very nature illusions are difficult to examine. An individual's perceptions
may be accurate; they may be kinder than average, or have a less than average
chance of becoming ill. The degree to which these perceptions are illusory is
hard to assess. However, if all individuals perceive more positively for self than
others, there is evidence of a consistent bias in perception. In this way, illusions
can be examined on a group basis. In the limited previous research, this has
proved to be a useful approach (e.g., Weinstein, 1980).
The best available method for the present study was, therefore, to investigate the
illusions on a group basis. As the Weinstein (1980) scale was the only direct
measure of an illusion available, other measures had to be adapted for the
purpose. Measures were used which related as closely as possible to the
By requiring this comparison with others, the illusory aspects were assessed. The
measure of self-perception was selected on the basis of its usefulness in previous
literature (Alicke, 1985; Brown & Taylor, 1986) and its high internal consistency
(Anderson, 1968), adapted so that each item required a comparison with others.
The measure of control was adapted from previously used practical tasks (Galin
et al., 1977; Rizley, 1978) and locus of control measures (Gurin et al., 1969;
Rotter, 1966, in Robinson & Shaver, 1973).
The present study found these measures were useful, although evidence for the
illusions was not as strong or consistent as predicted. However, it is not possible
to determine whether the findings accurately reflect the relationships, or whether
the result was affected by the type of measurement used. The measures
represent initial attempts at a new format, and so potential for improvement could
be expected. The measure of self-perception had not been used previously to
assess illusory aspects, and its validity for this is unknown. The measure of
control represented the first attempt to transpose practical tasks into a self-report
format, and to combine these with items based on locus of control. It may be that
the self-report format does not assess the same elements of control as the tasks
used in previous experiments. A further difficulty in interpreting the effects of
control in the present study is the moderate reliability of the measure. Therefore,
although the results suggest the measures were useful, additional work is required
to confirm their validity before conclusions can be drawn.
One means of validation is by examining the predicted relationships between each
of the illusions and the outcomes. The literature suggests that the illusion of
self-perception will be related to subjective well-being and physical health. To the
extent that these relationships were found, there is evidence for this illusion.
However, the relationships were not strong, and self-perception was not related
to negative well-being or to health. This may be an accurate reflection of the
relationships, although some doubt remains because the suitability of the
measurement is not known. Further investigation is required to confirm the limited
From the literature indicating a relationship between control and depression,
Taylor and Brown (1988) hypothesised that those with an illusion of control would
have higher levels of well-being and health. However, the present study found
no significant relationships. Again, although this may be an accurate conclusion,
interpretation of the findings is hampered by the lack of evidence for the measure.
Taylor and Brown (1988) also predicted relationships between the illusion of
optimism, and well-being and health. Relationships were found, providing support
for this illusion.
In the absence of evidence to the contrary, the present study accepts the
theoretical structure of illusions as proposed by Taylor and Brown (1988). The
three illusions were separated out, and assessed individually using the best
available measures. To the extent that relationships with well-being and physical
health were found, evidence was provided for the hypotheses. There were low
to moderate correlations between the illusions, and as predicted, each illusion
affected well-being and health in different ways. The need for further evidence
remains, however, as the measures are new, and the findings inconsistent.
Although the illusions are distinct entities, it is likely that they will influence each
other to some extent. Self-perception, for example, will affect perception of
control and the future. The small relationship found between the illusions, as
indicated by the low correlations, confirms that there is some interaction; the
nature of this is an area for future research.
Illusions and Perceived Physical Health
Illusions were hypothesised to be associated with higher levels of physical health.
As part of an optimistic bias, individuals rate themselves as much less likely than
others to experience illness (Weinstein, 1980). Most individuals overestimate their
own age of death, even when presented with actual longevity data (Snyder,
1978). This is related to the "illusion of unique invulnerability" whereby individuals
events (Perloff & Fetzer, 1986). Evidence suggests aspects of self-perception,
control and optimism are associated with successful adjustment to health
problems, such as cancer (Taylor, 1983; Taylor et al., 1984; Wood et al., 1985).
In the present study, the predicted association between illusions and physical
health was found for optimism, but not for the other illusions, contradicting
previous research. There is an important difference, however, in the way health
was measured. The present research examined day to day common physical
symptoms, rather than aspects of major health problems which have previously
been the focus. It might be that illusions are necessary for dealing with major
problems such as cancer, as Taylor and Brown (1988) claim. In contrast, day to
day illnesses are not threatening and it may be that illusions are unnecessary.
This may explain the absence of relationships between self-perception and
control, and health.
Control Theory and Health
The relationship between optimism and health, found in the present study,
confirmed evidence by Scheier and Carver (1985) that higher levels of optimism
are associated with lower levels of physical symptom-reporting. Control theory,
in which goal-directed behaviour is guided by negative feedback systems, has
been suggested as the mechanism underlying this relationship (Scheier & Carver,
1985). These feedback systems become more fully engaged when the individual
is focusing inward at a time when some goal or standard is salient. The result is
an attempt to reduce the perceived discrepancy between the actual state and the
goal. If this process is interrupted by any obstacle, expectancies for success are
assessed, resulting in either renewed effort or disengagement (Carver, Blaney &
Scheier, 1979b). Physical symptoms represent an obstacle to the desired state
(Carver & Scheier, 1981, 1982, 1983) and must be eliminated to reduce the
discrepancy (Carver & Scheier, 1982).
It would seem likely that if physical health was poor similar discrepancies would
is inconsistent with rating self as better than others. The task of completing a
self-report questionnaire would again induce self-focus, which serves to
exaggerate any discrepancies; this would increase the need of the individual to
perceive good health. This would be consistent with Scheier and Carver (1985),
and with the findings for optimism. However, such relationships were not found.
One means of explaining the disparity concerns self-focus. This occurs when the
individual directs their focus to some aspect of the self, and so becomes aware
of how they compare to a salient standard (Carver & Scheier, 1983). Previous
research used mirrors (Carver, Blaney & Scheier, 1979a) and the sound of the
respondents own voice (Carver & Scheier, 1981) to evoke self-focus. It is
possible that the health-related items in the optimism measure induced a focus
not just on the self, but on health aspects of the self in particular, exaggerating
the individual's need to perceive good health. There were no health-related items
in the measures of self-perception and control, and so health may not have been
as salient a standard for those illusions.
Illusions and Well-Being
Negative Well-Being
Mildly depressed individuals demonstrate comparatively unbiased evaluative
responses (Ruehlman et al., 1985). They judge themselves more realistically than
non-depressed individuals do (Lewinsohn et al., 1980) more accurately estimate
their control over the outcomes of dice-throws (Galin et al., 1977) and accurately
estimate their control over other practical tasks (Alloy & Abramson, 1979). In
comparison, non-depressed individuals demonstrate positively biased responses.
On the basis of this, it was expected that those with illusions would be less
depressed, and would also have lower levels of negative well-being. This will be
discussed for each illusion in turn.
Self-perception has been associated with negative well-being. Those who are
depressed demonstrate more balanced recall of self-referent adjectives (Kuiper