Selection on space use in a polymorphic lizard
Mats Olsson,
1* Erik Wapstra,
2Mo Healey,
1Tonia Schwartz
1and Tobias Uller
1,31
School of Biological Sciences, University of Wollongong, Wollongong, NSW 2522, Australia, 2
School of Zoology, The University of Tasmania, Hobart, Tasmania 7001, Australia and 3
Edward Grey Institute, School of Zoology, University of Oxford, Oxford OX1 3PS, UK
ABSTRACT
Background: Polymorphism within the same species, population, and sex is an interesting problem for the evolutionary biologist, since differences in fitness between the morphs have to cancel out over evolutionary time, otherwise morphs of lower fitness would become extinct. One way this may be achieved is through the adoption of different morph-specific reproductive strategies, allowing morphs to become conditional specialists in space (co-existing) or in time (and cycle in frequency). In either case, we expect selection to be disruptive on data pooled across morphs.
Question: In the annual Australian painted dragon lizard (Ctenophorus pictus; less than 10% survive to a second year), red males dominate yellow males in staged contests, and yellow males (sneakers) are superior in sperm competition trials. Here, we ask whether there is ongoing disruptive selection for red males to defend well-defined, smaller territories (dominants) and for yellow males to have larger, more loosely defined territories (sneakers).
Methods: We monitored free-ranging lizards in a natural population, assigned paternity using microsatellites, and calculated selection coefficients to assess ongoing sexual directional and quadratic selection on territory size.
Results and conclusions: Despite the different reproductive strategies, selection on space use in a natural population was not disruptive in either of the two years studied. Instead, there was no difference in territory size between morphs, and in one year there was ongoing directional (positive) and quadratic (stabilizing) selection on territory size applying across both morphs. Thus, divergence of male reproductive strategies in C. pictus does not seem to be related to differences in space use.
Keywords: lizard, polymorphism, selection in the wild.
INTRODUCTION
Evolution and maintenance of different morphs (phenotypic variants) within the same species, population, and sex is a classic problem in evolutionary biology (Darwin, 1871). The key
problem is to understand how ongoing selection and patterns of inheritance may favour one
* Author to whom all correspondence should be addressed. e-mail: [email protected] Consult the copyright statement on the inside front cover for non-commercial copying policies.
morph under some conditions and other morphs under different circumstances (for an excellent review, see Schuster and Wade, 2003). A common prediction that can be made across taxa is that
the underlying evolutionary process should act to specialize the different morphs to their selective optima – that is, ongoing selection should be disruptive. Although considerable theoretical attention has been paid to this research area, few examples of ongoing selection in the wild have been analysed. One exception is Sinervo and colleagues’ work on the Uta or side-blotched lizard (Uta stansburiana), where ongoing selection on morph-related traits is typically disruptive (Calsbeek et al., 2002).
Males of many lizard species patrol territories from which other males are vigorously excluded and, in polymorphic species, morphs may differ in their territorial behaviour and territory attributes (e.g. shapes and sizes), associated with morph differences in aggressiveness (e.g. Zamudio and Sinervo, 2000). Here we report on a study of territorial behaviour
and selection on territory size in the painted dragon lizard (Ctenophorus pictus) from south-east Australia, which now occurs in three different morphs (red, yellow, and orange headed). Elsewhere, we report dominance of red over yellow males in staged trials for females or space in captivity (Healey et al., 2007), and of yellow over red males in sperm
competition trials (Olsson et al., 2007). When the laboratory trials were conducted, the
frequency of orange males in the wild (<15%, n=3) was too low and our information on their behaviour too meagre to allow predictions to be made for selection on space use in the wild. Consequently, to make our analysis of field data comparable to that of laboratory data, we make predictions on space use in the wild based on our assessment of behavioural differences between red and yellow males (while including males of all head colours in the analysis for correct assessment of selection coefficients). Based on our previous results, we would predict yellow males to adopt a sneaker strategy and therefore exhibit larger movement patterns and the lack of a well-defined territory. Thus, we predict our analysis to show sexual selection for relatively smaller, more defendable territories in red males (dominants) and larger, more loosely defined territories in yellow males (sneakers). Furthermore, in data pooled across morphs, we predict disruptive (quadratic) selection for territory size (selecting for bimodality in territory size with different peaks for red and yellow males).
MATERIALS AND METHODS
We studied painted dragon lizards (Ctenophorus pictus) in a desert nature reserve (Yathong, NSW, 145⬚35⬘E, 32⬚35⬘S) every day during the mating season (August–January) when the weather permitted lizard activities in 2000 and 2005. Painted dragons are small (mass to approximately 10 g, 60 mm snout-to-vent length), ground-dwelling lizards, of which about 90% of individuals only live for a single season (<10% survive to a second year). Thus, lifetime reproductive success of the majority of individuals is obtained in a single year. We caught males and females by noosing them from a slow-moving (and then stopping) vehicle. Noosed lizards were weighed, measured, and blood sampled (from the vena angularis in the corner of the mouth), scored for head coloration (following Sinervo and Lively, 1996), and had a
Males spend virtually all day on the graded roadsides of fire trails, the surrounding vegetation is too dense to be used for this visually displaying lizard, and the roads are avoided since their openness makes the lizards prone to bird predation. Thus, the most important aspect of male territories is typically one-dimensional. We therefore used the longest axis through a male’s territory as a proxy of its size. Throughout the season, each observation of males and females was GPS recorded and, at the end of the season, all perch sites (defined as higher than human knee-height) between the end GPS points of male territories were counted. The average number of observations per male during the mating season was 6.7±0.54 (±..) and the lack of a significant relationship between number of observations and territory size in both years (2000: r=0.11, P=0.52, n=34; 2005: r=0.13, P=0.39, n=44; Fig. 1) made us confident that among-male differences in number of observations would not introduce bias in our analysis of selection on territory size.
The selection coefficient analysis on territory size followed standard protocols (Arnold and Wade, 1984a; Lande and Arnold, 1983). Relative fitness in terms of sexual selection (number of sired
young) was calculated as a male’s absolute number of microsatellite-assigned offspring divided by the average number of young produced for all males, resulting in standardized selection coefficients (Arnold and Wade, 1984a, 1984b; Lande and Arnold, 1983). Sexual selection
differ-entials were calculated as the covariance between trait values and relative fitness. Selection gradients were calculated as the partial regression coefficients in a multiple, quadratic selection analysis. Initially, all analyses were multivariate – that is, they included a number of potential predictor variables and their interaction with relative fitness was the response variable. However, in many field studies without experiments, it is unclear which of these variables significantly influence fitness and the predictors that remain in the final calculation of selection coefficients is unavoidably a judgement call (we are grateful to Professor Steve Arnold for an extensive discussion of this neglected topic and here follow his advice). We used territory size, quadratic territory size, male snout-to-vent length (SVL), density of perch sites, and male body condition (i.e. residuals from a mass–SVL regression) as predictors in the initial model. We used backward elimination at P ≥ 0.25 and report the results from the final models. This was confirmed by forward step-wise regression, including interaction terms to assess correlative selection effects, to generate the same final model.
Genotyping at six microsatellite loci followed a standard protocol (Schwartz et al., 2007).
Parentage analyses were conducted independently for each year using both complete exclusion and likelihood-based approaches (assuming a 0.01 error rate) in Cervus 2.0
(Marshall et al., 1998). We assumed 80% of the males in the population had been sampled
each year (we attempted to catch all males, of course, but this conservative approach made us less likely to mis-assign fathers). All males sampled were assumed to be potential fathers for all offspring. Results were compared across the analyses and assigned fathers were assessed by eye across mother–offspring pairs and the clutch mates. Any mis-matches between father–offspring–mother were checked with the raw data.
level. In 2000, we successfully determined the paternity of 18 of 26 clutches made up of 62 young. In 2005, we successfully determined the paternity of 33 of 39 clutches made up of 110 young.
We analysed our data collected in two different years separately for two reasons: (1) the frequencies of the different colour morphs differed significantly between years (Olsson et al., 2007) and thus so did the selection scenario for the different males competing for access to
females; and (2) a two-factor analysis of variance showed that head colour morphs did not differ significantly in territory size (F2,77=1.0, P=0.37), whereas there was a difference
in territory size between years (F1,77=5.45, P=0.022; 2000: mean territory size=66 m,
[image:4.612.168.429.140.523.2]..=13.2 m, n=34; 2005: mean territory size=116 m, ..=18.3 m, n=44).
RESULTS AND DISCUSSION
The standardized selection differential (s⬘) on territory size was 0.14 in 2000 and −0.04 in 2005, and non-significant in both years (P>0.05).
An analysis of selection gradients revealed no effect of head colour on relative fitness, or of the interaction term between head colour and territory size (P>0.50 in all cases). The final model only included territory size and its quadratic term. The standardized directional selection gradient on territory size (β) was 0.97 (..=0.45) and significant (F1,33=2.15,
P=0.039) in 2000, and in the same year there was significant stabilizing sexual selection on territory size (γ= −0.27, ..=0.12, F1,33= −2.22, P=0.034). In 2005, however, neither
directional nor quadratic selection was statistically significant (β= −0.11, ..=0.38, F1,43= −0.30, P=0.76; γ=0.049, ..=0.20, F1,43=0.24, P=0.81).
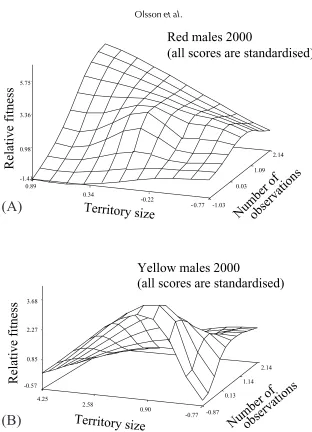
To visualize how sexual selection might operate on the different morphs, we plotted our raw data of relative fitness against territory size (Figs. 1A and 1B) and fitness response surfaces using cubic splines (with a smoothing parameter of 0.05) for red and yellow males in 2000 (i.e. in the year with significant ongoing selection; Figs. 2A and 2B), while including territory size and number of observations on the different axes (to verify that territory size is not increasing further with additional numbers of observations). This revealed a local peak in relative fitness at medium territory size for both morphs (Figs. 1 and 2). However, more reproductively successful red males in 2000, unlike yellow males, were also observed more often (r=0.56, P=0.016; Fig. 2A). Importantly, there was no difference in the number of observations among male morphs (ANOVA: F2,33=0.32, P=0.72) and this effect in red
males is best explained by the observations of a few rarely observed red males that sired no offspring.
Previous work on polymorphic lizards using selection analysis has confirmed ongoing disruptive selection in accordance with expectations from an evolutionary divergence of morphs and with correlated effects defining morphs into even more discrete units (Sinervo and Lively, 1996; Zamudio and Sinervo, 2000; Calsbeek et al., 2002). We expected to find similar differences
among morphs in male territory size in our model species in the wild, with red males being more explicit territory defenders and with yellow males adopting a sneaker strategy, and corresponding ongoing disruptive selection on territory size. This hypothesis was not only rejected (although we cannot refute that disruptive selection may historically have played a role in how the different morphs originally evolved), but we also demon-strated significant stabilizing selection in one year across colour morphs. We caution the reader that the orthogonal methods we used, which refuted correlated selection on colour morphs (non-significant interaction terms between head colour and space use), might not explore the full scale of potentially ongoing correlated selection. A more powerful technique is a canonical variate analysis, which does not rely on the assumption of orthogonality of predictors, and that combines sets of predictors that may be targets of correlated selection. Importantly, however, these combined sets of predictors suffer from the same restrictions in terms of risk of collinearity as in conventional multiple regression. Thus, care must be taken not to inflate the risk of identifying spurious results driven by collinearity, especially at low sample size, as in the present case (see Quinn and Keogh, 2002, pp. 463–466). In our analysis, we doubt that a
Red and yellow males had similar territory size and, in one of two years, there was significant directional selection for an increased territory size across all males, regardless of morph, and with simultaneous stabilizing selection. Thus, extreme territories are selected against, whatever head colour a male has, suggesting that there is no ongoing selection for a specialized space use tailored to male colour morph and potential genetic traits covarying with colour. Furthermore, although red males have more perch sites on their territories, which may reduce the probability of shared paternity of clutches produced by females on his territory (Olsson et al., 2007), this measure of territory quality does not seem to predict
reproductive success in terms of the total number of offspring sired. Thus, any differences in reproductive strategies between morphs in this species do not seem to incorporate differences in space use.
ACKNOWLEDGEMENTS
Thanks to E. Snaith and G. Snaith for logistical support, the Australian Research Council (M.O.) and Wenner-Gren Foundations (T.U.) for funding, and to Steve Arnold for discussions and helpful suggestions on selection analysis. We thank B. Sinervo and M. Rosenzweig for helpful comments on the manuscript.
REFERENCES
Arnold, S.J. and Wade, M.J. 1984a. On the measurement of natural and sexual selection – applications. Evolution, 38: 720–734.
Arnold, S.J. and Wade, M.J. 1984b. On the measurement of natural and sexual selection – theory. Evolution, 38: 709–719.
Calsbeek, R., Alonzo, S.H., Zamudio, K. and Sinervo, B. 2002. Sexual selection and alternative mating behaviours generate demographic stochasticity in small populations. Proc. R. Soc. Lond. B, 269: 157–164.
Darwin, C. 1871. The Descent of Man, and Selection in Relation to Sex. London: John Murray. Healey, M., Uller, T. and Olsson, M. 2007. Seeing red: morph-specific contest success and survival
rates in a colour-polymorphic agamid lizard. Anim. Behav., 74: 337–341.
Lande, R. and Arnold, S.J. 1983. The measurement of selection on correlated characters. Evolution, 37: 1210–1226.
Marshall, T.C., Slate, J., Kruuk, E.B. and Pemberton, J.M. 1998. Statistical confidence for likelihood-based paternity inference in natural populations. Mol. Ecol., 7: 639–655.
Olsson, M., Healey, M., Wapstra, E., Schwartz, T., LeBas, N. and Uller, T. 2007. Mating system variation and morph fluctuations in a polymorphic lizard. Mol. Ecol., 16: 5307–5315.
Quinn, G.P. and Keogh, M.J. Experimental Design and Data Analysis for Biologists. Cambridge: Cambridge University Press.
Schuster, S.M. and Wade, M.J. 2003. Mating Systems and Strategies. Princeton, NJ: Princeton University Press
Schwartz, T.S., Warner, D.A., Beheregaray, L.B. and Olsson, M. 2007. Microsatellite loci for Australian agamid lizards. Mol. Ecol. Notes, 7: 528–531.
Sinervo, B. and Lively, C.M. 1996. The rock–paper–scissors game and the evolution of alternative male strategies. Nature, 380: 241–243.