DOI: 10.1051/forest:2006080
Original article
Genetic parameters for lignin, extractives and decay
in
Eucalyptus globulus
Fiona S. P
a*, Brad M. P
a, René E. V
a, Carolyn A. R
baSchool of Plant Science and Cooperative Research Centre for Forestry, University of Tasmania, Private Bag 55, Hobart 7001, Tasmania, Australia bForests NSW, PO Box 46, Tumut, NSW, Australia
(Received 8 August 2005; accepted 1 February 2006)
Abstract –Eucalyptus globulusis grown in temperate regions of the world for pulp production. The chemical and physical properties of its wood make it highly suited to this purpose. This study analysed genetic variation in lignin content, extractives content and decay, for nine localities ofE. globulus. Heritability estimates were also obtained, and the relationships between these traits and physical wood traits and growth were examined. Significant genetic variation was found between localities for lignin content (Klason lignin and acid-soluble lignin contents) and decay. The only trait for which significant variation between families within locality was detected was acid-soluble lignin content, which resulted in this trait also having the highest narrow-sense heritability (0.51±0.26). However, family means heritabilities were high for lignin content, extractives content and decay (0.42–0.64). The chemical wood traits were strongly correlated with each other both phenotypically and genetically, with important correlations found with density and microfibril angle. Correlations suggested that during selection for the breeding objective traits, it is likely that favourable states in the chemical wood traits, decay resistance and fibre properties are concurrently being selected, whereas growth may be selected for independently. This initial study provides a stepping stone for future studies where particular localities of the breeding population may be characterised further.
correlation/eucalypt/genetic variation/heritability/lignin
Résumé – Paramètres génétiques pour la lignine, les extractibles et la pourriture chezEucalyptus globulus. Eucalyptus globulusest cultivé dans de nombreuses régions tempérées pour la production de pâte à papier. Les propriétés physiques et chimiques de ce bois en font un matériau très apprécié pour cette utilisation. Cette étude analyse les variations génétiques de la teneur en lignine, en composés extractibles et de la sensibilité à la décomposition du bois de neuf provenances deEucalyptus globulus.L’héritabilité de ces propriétés ainsi que leurs relations avec les caractéristiques physiques du bois et la croissance ont été examinées. Des différences inter-provenances significatives ont été détectées pour les teneurs en lignine (lignines dosées par la méthode de Klason, ou lignines soluble en solution acide) et la vitesse de décomposition. Le seul caractère qui a présenté une variation significative entre familles dans les provenances a été la teneur en lignines solubles en solution acide. De ce fait, une forte héritabilité (au sens strict) a été détectée pour ce caractère (0,51±0,26). Cependant, les héritabilités moyennes dans les familles étaient élevées pour la teneur en lignine, les teneurs en composés extractibles et la vitesse de décomposition (0,42–0,64). Les caractéristiques chimiques du bois étaient fortement inter-corrélées au niveau phénotypique et génétique, avec des corrélations importantes également avec la densité et l’angle des microfibrilles. Les corrélations suggèrent que durant la sélection de caractères objectifs d’amélioration, des traits favorables associant caractéristiques chimiques du bois, résistance à la décomposition et propriétés des fibres puissent être sélectionnés simultanément, alors que la croissance doit faire l’objet d’une sélection indépendante. Cette étude constitue une base pour de futurs travaux permettant une caractérisation plus fine de provenances particulières dans cette population de sélection.
corrélation/eucalyptus/variation génétique/héritabilité/lignine
1. INTRODUCTION
Eucalyptus globulusis grown for pulp production in tem-perate Australia and other parts of the world, including South America, southern Europe, Africa and Asia. Considerable ge-netic variation has been identified between the subraces ofE. globulusfor a wide range of traits, including growth and both physical and chemical wood properties [1, 10, 23, 24]. Some of this variation has been exploited in breeding programs for the selection of superior trees. When selecting trees for pulp pro-duction, only a few traits are currently examined in Australia, with the focus on increases in volume per hectare, basic den-sity and pulp yield [1, 16, 17]. Although selection for these traits gives an increase in the pulp yield per hectare, many
* Corresponding author: fpoke@utas.edu.au
other physical and chemical wood properties are important to kraft pulping, and variations in these can be conducive to min-imising the costs or environmental impacts of the process.
Kraft pulping generally involves the removal of most of the extractives, approximately 80% of the lignin and approxi-mately 50% of the hemicellulose from the cellulose fibres us-ing alkali [35]. For the production of high quality paper, the pulp is further bleached to remove the residual lignin, which is responsible for turning the paper yellow through oxidation and light absorption [35]. The lignin and extractives contents of wood, are traits that are fast being recognised as having im-portance in minimising the costs and environmental impacts of kraft pulping. As lignin and extractives are the primary waste products of the pulping process, lower levels in the wood will result in faster delignification and/or a reduction in the use of
chemicals and energy. This will help minimise the production of pollutants from the pulping process.
Studies into the genetic variation and heritability of lignin and extractives have been limited inEucalyptusuntil recently. This was mainly due to the expensive and time-consuming na-ture of the chemical assay used to measure these traits [2, 3]. More recently, simple and cost-effective techniques have been developed for predicting these traits, involving near infrared reflectance (NIR) analysis on ground wood cores [4, 30]. This has been found to be an effective technique for reliably pre-dicting these traits in large numbers of samples. A small num-ber of studies have suggested that there is genetic variation in lignin and extractives contents inE. globulus, although these involved only three or four provenances and a small number of individuals [24, 41]. Studies investigating the correlations be-tween the chemical wood traits and other wood properties inE. globulus, have also been limited by small sample sizes and to small numbers of traits, and have involved phenotypic correla-tions only [23,39]. Genetic correlacorrela-tions have not been reported for these traits in E. globulus. To fully explore the scope of variation within the chemical traits and their genetic control, large numbers of individuals, families and provenances are re-quired which encompass the range ofE. globulus.
The susceptibility of trees to wood decay is important as it may impact on pulp yield in two ways: firstly, the plant de-fence response may lead to an increase in the amount of lignin and extractives present in the wood, which will reduce the pulp yield; secondly, decay leads to degradation of the wood caus-ing a breakdown of the cellular structure [29]. This decay can be caused by pathogen infection of exposed, vulnerable tis-sue following wounding, or through attack of the heartwood (heart rot), which is incapable of an active response due to the lack of living cells [29]. The impact of decay will also depend upon whether the decay organisms are feeding on cellulose or lignin. Two types of fungi generally are responsible for decay, brown rot fungi which degrade cellulose and white rot fungi which degrade lignin. Decay can be observed in “pockets” that are compartmentalised by a reaction zone (purple/pink coloured boundary between healthy and decayed wood) and discolouration of the surrounding wood, or as rotting of the heartwood [29, 40]. Fungal attack has been found to be asso-ciated with increases in lignin due to its resistance to degrada-tion by pathogens, inE. gunnii[18], and increases in extrac-tives which contain antimicrobial compounds, inE. nitens[5]. InE. globulusgenetic variation in decay susceptibility and its relationship to other wood properties has not been examined.
Improving the chemical wood properties of tree species through breeding requires genetic variation to be present for selection. It is also necessary to understand how the traits to be improved are related to one another and to other traits that are not currently being selected, so that when an increase in one trait is selected for, the potential effects on other traits may be predicted. A study conducted by Apiolaza et al. [1] exam-ined the variation in growth and wood traits as well as their correlations using 188 individuals ofE. globulusfrom 35 fam-ilies and eight subraces, which are currently part of the single breeding population of the Australian national breeding pro-gram. The traits examined included diameter at breast height
over bark (DBH), basic density (BD), mean fibre length (FL), mean microfibril angle (MFA) which is the average angle of the cellulose microfibrillar helix relative to the longitudinal fi-bre axis [11], predicted pulp yield (PY) and cellulose content (CELL). The current study aimed to build on that of Apiolaza et al. [1] with a particular focus on the chemical wood prop-erties. Using the same open-pollinated progenies grown in a field trial, we examined the variation in and the heritability of lignin content (LIG), extractives content (EXTR) and extent of decay (DEC) between and within nine localities ofE. glob-ulus originating from around Tasmania and south-east Victo-ria. Phenotypic and genetic correlations were also determined amongst these traits and with the growth and wood traits of Apiolaza et al. [1]. The relationship between these chemical wood traits and with the physical wood traits, wood decay and growth has not been examined before inE. globulusand will provide an indication of how multiple traits are affected during the selection of superior trees.
2. MATERIALS AND METHODS
2.1. Plant material
Wood samples ofEucalyptus globuluswere collected from a base population field trial located at West Ridgley, Tasmania (Gunns Ltd). This trial was established in 1989 based on the CSIRO Australian Tree Seed Centre collection and is comprised of open-pollinated ilies [12, 13]. The trial was an incomplete block design with 451 fam-ilies in five replicates, each with 17 incomplete blocks, and two-tree row plots [1]. A total of 177 trees from 37 families (Tab. I) were sam-pled to cover the same range of eight subraces samsam-pled by Apiolaza et al. [1], with one tree or occasionally two trees per plot sampled. Due to the fact that only a subset of families was sampled the trial was treated as a randomised complete block design for analysis. The locality denoted North-east Tasmania comprises two localities, Royal George and German Town, which were merged because of small sam-ple sizes and their close proximity. Two bark-to-bark wood cores were taken from each tree approximately 10 cm above the previous core sites taken by Apiolaza et al. [1] two years before, according to the method described by Raymond et al. [33].
2.2. Wood and growth measurements
Measurements for BD, MFA, FL, PY and CELL already existed for these trees at age 11 years [1]. Additional measurements were taken for BD and DBH, and measurements were obtained for DEC, LIG and EXTR all at age 13 years.
DEC was recorded for each core as the percentage of the core with heart rot, pocket decay and/or discolouration and results were averaged for the tree. For statistical analysis the different types of decay data were grouped, with 0 indicating no decay followed by 10% intervals thereafter, and class midpoints were used for analysis. Due to the presence of decay in the pith for many of the cores, partial cores (the outer quarters of each core free of decay) were used for further BD, LIG and EXTR measurements.
Table I.Breakdown of subraces (as classified by Dutkowski and Potts [10]), localities and families ofE. globulusused in this study from the base population trial at West Ridgley, Tasmania.
Subrace Locality Number of families Number of individuals
Flinders Island, Tasmania Central Flinders Island 4 18
King Island, Tasmania South King Island 5 27
North-eastern Tasmania North-east Tasmania 4 16
South-eastern Tasmania Moogara 4 14
South-eastern Tasmania North Maria Island 3 14
Southern Tasmania South Geeveston 4 18
Strzelecki Foothills, Victoria Madalya Road 4 20
Strzelecki Ranges, Victoria Bowden Road 4 22
Western Otways, Victoria Cannan Spur 5 28
Total 9 37 177
excess water followed by volume (V) measurements. The mass (M) of each core was taken after drying at 105◦C for approximately two days. BD was calculated using the following formula:
BD(kg/m3)= M
V ×1000
The remaining partial cores were used to develop the NIR calibrations reported in Poke et al. [30] for total lignin (TLIG), acid-soluble lignin (ASLIG) and Klason lignin (KLIG) contents (TLIG = ASLIG + KLIG) plus EXTR. These calibrations were based on chemical mea-surements for 54 to 61 samples and had good correlation coefficients (0.62–0.93), and predicted and laboratory values for the validation set of samples were highly correlated (0.83–0.99) [30]. The calibrations were used to predict these traits for the remainder of the individuals in the data set.
2.3. Statistical analysis
Variance components for BD, DBH, ASLIG, KLIG, TLIG, EXTR and DEC were estimated using the MIXED procedure in SAS (Ver-sion 9.1, SAS Institute Inc.), with locality fitted as a fixed effect, and family within localities, replicate and residual within localities as ran-dom effects. Locality least square means and the differences between them were also calculated using the MIXED procedure in SAS, with a Tukey-Kramer adjustment applied for multiple comparisons.
The individual narrow-sense (h2
op) and family mean (H
2
f m)
heri-tabilities of BD, DBH, ASLIG, KLIG, TLIG, EXTR and DEC were estimated using ASREML [14], with the fixed locality term removed from the model in the latter case.h2
oprefers to the narrow-sense
her-itability within localities which is used operationally to predict ge-netic gains from within locality selection.H2
f m is the family means
heritability which indicates the gain that would be made from select-ing the best families across all localities for deployment.h2
opandH2f m
were estimated as [19]: h2
op=
σ2
add(loc)
σ2
add(loc)+σ2e
H2
f m=
σ2
f
σ2
f +σ
2
ek
where:σ2
add(loc) =additive genetic variation within locality variance component estimated assuming a coefficient of relatedness within open-pollinated families of 0.4, after first adjusting the additive re-lationship matrix for a 30% selfing rate [9];
σ2
f =family variance component calculated across localities;
σ2
e=residual variance component;
k=harmonic mean number of trees per family.
Trait correlations were determined amongst the age 13 measure-ments of BD, DBH, ASLIG, KLIG, TLIG, EXTR and DEC and with the traits of Apiolaza et al. [1]. Phenotypic correlations (Pearsons cor-relation matrix) amongst individuals were determined in SAS using the CORR procedure. Additive genetic correlations could not be es-timated using ASREML [14] directly, as bivariate models failed to converge due to the small sample size. However, as an approxima-tion of the genetic correlaapproxima-tions, Pearsons correlaapproxima-tion matrices were obtained using family means adjusted for locality differences and for the nine locality means using the CORR procedure in SAS.
3. RESULTS
3.1. Trait statistics and variances
Table II.Statistics for growth and wood measurements of individual trees for theE. globulusbase population trial at West Ridgley, Tasmania.
Trait (Abbreviation) Unit n Mean Standard deviation Minimum Maximum
Mean fibre length at age 11 (FL) mm 141 0.77 0.06 0.59 0.95
Mean microfibril angle at age 11 (MFA) ◦ 149 16.9 2.9 11.7 27.5
Predicted pulp yield at age 11 (PY) % 157 51.8 1.6 42.5 57.0
Cellulose content at age 11 (CELL) % 157 42.4 1.5 37.8 46.6
Basic density at age 11 (BD) kg/m3 161 494.5 40.5 395.8 589.4
Basic density at age 13 (BD) kg/m3 133 522.9 44.9 412.1 667.7
Diameter at breast height at age 13 (DBH) cm 177 24.1 5.4 13.4 37.5
Klason lignin content at age 13 (KLIG) % 155 22.38 1.21 18.97 25.45
Acid-soluble lignin content at age 13 (ASLIG) % 155 6.12 0.52 4.42 8.11
Total lignin content at age 13 (TLIG) % 155 28.48 1.26 24.72 31.23
Extractives content at age 13 (EXTR) % 155 6.00 1.84 2.12 12.73
Extent of decay at age 13 (DEC) % 143 35.9 32.4 0 95.0
Table III.Analyses of variance for growth and wood traits at age 13 years between replicates, localities, and families within localities, plus estimates of the heritability of within locality variation, and family means heritability, for these traits in the samples from theE. globulusbase population trial at West Ridgley, Tasmania. Probability values are denoted ***P<0.001, *P<0.05 and ns=non-significant.
Trait df Basic
density (BD)
Diameter at breast height (DBH)
Klason lignin content (KLIG)
Acid-soluble lignin content (ASLIG)
Total lignin content (TLIG)
Extractives content (EXTR)
Extent of decay (DEC)
Replicate Z value (probability value)
4 0a (–)
0.57 (0.284) ns
1.26 (0.105) ns
0.92 (0.178) ns
1.24 (0.107) ns
0.64 (0.261) ns
0.40 (0.345) ns Locality F value
(probability value)
8 1.83 (0.114) ns
2.73 (0.023) *
2.52 (0.033) *
2.52 (0.034) *
2.03 (0.079) ns
1.80 (0.120) ns
5.40 (0.0004) *** Family [locality] Z
value
(probability value)
28 0.89 (0.186) ns
0a (–)
0.688 (0.249) ns
1.90 (0.028) *
1.2 (0.115) ns
1.52 (0.064) ns
0a (–)
Narrow-sense heritability (standard error)
0.24 (0.26)
0a 0.13
(0.20)
0.51 (0.26)
0.29 (0.23)
0.35 (0.23)
0a
Family means heritability (standard error)
0.42 (0.19)
0.19 (0.19)
0.42 (0.16)
0.64 (0.10)
0.50 (0.14)
0.48 (0.14)
0.50 (0.14)
Z values are random terms and F values depict fixed terms. aVariance component was at the boundary of the parameter space.
3.2. Heritability estimates
Narrow-sense heritability estimates had large standard er-rors due to the lack of significant variation between fami-lies within localities for most traits, no doubt reflecting the small sample size (Tab. III). Moderately high heritability val-ues were obtained for ASLIG (0.51±0.26) and EXTR (0.35± 0.23), although ASLIG was the only trait where significant variation between families within localities was detected. Both BD (0.24±0.26) and TLIG (0.29±0.23) showed moderate heritabilities, with KLIG (0.13±0.20) showing little heri-tability. Within locality variation in DEC and DBH was non-heritable. The heritabilities of family means integrated both
within and between locality variation, and were somewhat higher than the narrow-sense heritabilities due to the inclusion of locality effects in the differences between families. ASLIG (0.64±0.10), EXTR (0.48±0.14), TLIG (0.50±0.14) and DEC (0.50±0.14) showed high estimates. BD (0.42±0.19) and KLIG (0.42±0.16) had moderately high estimates, and DBH a moderate estimate (0.19±0.19) (Tab. III).
3.3. Trait correlations
Table IV.Locality least square means and standard errors (in parenthesis) for growth and wood traits at age 13 years for samples from the
E. globulusbase population trial at West Ridgley, Tasmania.
Locality Basic density (BD) (kg/m3)
Diameter at breast height (DBH) (cm) Klason lignin content (KLIG) (%) Acid-soluble lignin content (ASLIG) (%) Total lignin content (TLIG) (%) Extractives content (EXTR) (%) Extent of decay (DEC) (%) Central Flinders Island 520 (12) a 26.0 (1.2) a 22.6 (0.4) a 6.0 (0.2) ab 28.6 (0.4) a 6.4 (0.6) a 23.4 (7.2) a South King Island 486 (13) a 25.3 (1.0) a 21.9 (0.4) a 5.7 (0.1) a 27.7 (0.4) a 5.4 (0.5) a 65.6 (6.5) b North-east Tasmania 512 (14) a 20.9 (1.3) a 22.7 (0.4) a 6.1 (0.2) ab 28.8 (0.4) a 7.1 (0.6) a 22.1 (7.9) a
Moogara 511 (14)
a 22.2 (1.4) a 22.6 (0.4) a 6.3 (0.2) ab 28.9 (0.4) a 6.1 (0.6) a 48.8 (8.9) ab North Maria Island 537 (16) a 23.2 (1.4) a 22.5 (0.4) a 6.0 (0.2) ab 28.5 (0.5) a 6.0 (0.7) a 40.2 (8.5) ab South Geeveston 532 (14)
a 25.6 (1.2) a 21.8 (0.4) a 6.6 (0.2) b 28.2 (0.4) a 5.0 (0.6) a 48.6 (8.5) ab Madalya Road 535 (12)
a 22.9 (1.2) a 22.8 (0.4) a 6.0 (0.2) ab 28.8 (0.4) a 6.7 (0.5) a 21.3 (7.4) a Bowden Road 542 (12)
a 22.7 (1.1) a 22.8 (0.4) a 6.2 (0.1) ab 28.9 (0.4) a 6.2 (0.5) a 18.6 (7.4) a Cannan Spur 527 (11)
a 26.3 (1.0) a 21.8 (0.3) a 6.2 (0.1) ab 27.9 (0.4) a 5.3 (0.5) a 33.7 (6.1) a
Localities with common letters for the same trait are not significantly different atP<0.05 following Tukey-Kramer adjustment for multiple compar-isons.
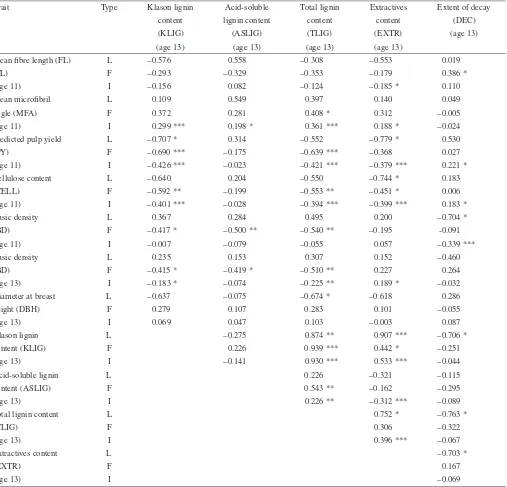
levels (Tab. V). Correlations between locality means and fam-ily means with locality differences removed, represented ge-netic based correlations. As expected, a strong, positive re-lationship was identified between TLIG and its components (ASLIG and KLIG) at most levels, although KLIG and ASLIG were not significantly correlated. EXTR was strongly corre-lated with lignin content for individuals, but the correlations were positive with KLIG and TLIG, and negative with ASLIG. Genetic correlations were observed between EXTR and both KLIG (families and localities) and TLIG (localities). KLIG, TLIG and EXTR all had significant, negative, phenotypic and genetic correlations with both CELL and PY, although these were sometimes not significant at the locality level. Lignin content showed significant negative correlations with BD at the family level supported at both ages 11 and 13 years. TLIG was also positively correlated with MFA at the individual and family level, with ASLIG and KLIG correlated with MFA at the individual level only. TLIG and DBH showed a weak neg-ative correlation at the locality level only.
DEC was highly negatively correlated with BD only at age 11 years for individuals and localities, but not for families. Significant genetic variation has been reported for BD at age 11 at the subrace level [1]. When the South King Island local-ity (particularly susceptible to decay) was removed from the analysis, DEC and BD (age 11) were no longer correlated at the locality level, but a significant correlation still remained at the individual level (r=−0.230,P<0.017). DEC had weak,
positive phenotypic correlations with PY and CELL, but there were no significant genetic relationships. DEC showed nega-tive relationships with KLIG, TLIG and EXTR for localities, which were still significant for KLIG (r=−0.714,P<0.047) and EXTR (r =−0.717,P<0.045) when South King Island was removed from the analysis. DEC had a positive correlation with FL at the family level only.
4. DISCUSSION
4.1. Variation in and heritability of wood properties and growth
Table V.Correlations (Pearsons correlation matrix) amongst growth and wood traits for theE. globulusbase population trial at West Ridgley, Tasmania. L=correlations amongst the nine locality means (df=7), F=correlations amongst family means (adjusted for locality differences; df=25 to 27) and I=phenotypic correlations amongst individuals (df=106 to 155). Significant probability values are denoted ***P<0.001, **P<0.01, *P<0.05.
Trait Type Klason lignin Acid-soluble Total lignin Extractives Extent of decay
content lignin content content content (DEC)
(KLIG) (ASLIG) (TLIG) (EXTR) (age 13)
(age 13) (age 13) (age 13) (age 13)
Mean fibre length (FL) L –0.576 0.558 –0.308 –0.553 0.019
(FL) F –0.293 –0.329 –0.353 –0.179 0.386 *
(age 11) I –0.156 0.082 –0.124 –0.185 * 0.110
Mean microfibril L 0.109 0.549 0.397 0.140 0.049
angle (MFA) F 0.372 0.281 0.408 * 0.312 –0.005
(age 11) I 0.299 *** 0.198 * 0.361 *** 0.188 * –0.024
Predicted pulp yield L –0.707 * 0.314 –0.552 –0.779 * 0.530
(PY) F –0.690 *** –0.175 –0.639 *** –0.368 0.027
(age 11) I –0.426 *** –0.023 –0.421 *** –0.379 *** 0.221 *
Cellulose content L –0.640 0.204 –0.550 –0.744 * 0.183
(CELL) F –0.592 ** –0.199 –0.553 ** –0.451 * 0.006
(age 11) I –0.401 *** –0.028 –0.394 *** –0.399 *** 0.183 *
Basic density L 0.367 0.284 0.495 0.200 –0.704 *
(BD) F –0.417 * –0.500 ** –0.540 ** –0.195 -0.091
(age 11) I –0.007 –0.079 –0.055 0.057 –0.339 ***
Basic density L 0.235 0.153 0.307 0.152 –0.460
(BD) F –0.415 * –0.419 * –0.510 ** 0.227 0.264
(age 13) I –0.183 * –0.074 –0.225 ** 0.189 * –0.032
Diameter at breast L –0.637 –0.075 –0.674 * –0.618 0.286
height (DBH) F 0.279 0.107 0.283 0.101 –0.055
(age 13) I 0.069 0.047 0.103 –0.003 0.087
Klason lignin L –0.275 0.874 ** 0.907 *** –0.706 *
content (KLIG) F 0.226 0.939 *** 0.442 * –0.251
(age 13) I –0.141 0.930 *** 0.533 *** –0.044
Acid-soluble lignin L 0.226 –0.321 –0.115
content (ASLIG) F 0.543 ** –0.162 –0.295
(age 13) I 0.226 ** –0.312 *** –0.089
Total lignin content L 0.752 * –0.763 *
(TLIG) F 0.306 –0.322
(age 13) I 0.396 *** –0.067
Extractives content L –0.703 *
(EXTR) F 0.167
(age 13) I –0.069
estimated narrow-sense (0.51) and family means (0.64) her-itabilities. The only published narrow-sense heritability esti-mate for lignin traits inE. globulusis for total lignin content which was estimated to be very low at 0.09±0.21 [8]. The moderate narrow-sense heritability estimate for total lignin content from the current study (0.29), together with a high family means heritability (0.50), suggest that lignin may be under stronger genetic control than previously thought.
Sup-porting this is an estimate for the clonal heritability of lignin content inE. globulusof 0.83 from Gominho et al. [15].
lack of variation in the current study may be due to different provenances being used, or may be attributed to possible site by genotype interactions affecting this trait. Kube [20] found strong genotype by site interactions for extractives among 434
E. nitenstrees from 40 families grown over three sites, with heritability estimates found to vary between sites from low to very high, suggesting that the factors causing extractives pro-duction in some genotypes are very site specific. Miranda and Pereira [24] found no site effects for extractives while the cur-rent study found no replicate effects inE. globulus.
The heritability of and the variation in basic density and di-ameter forE. globulushas been examined extensively [22] and so will not be discussed in detail here. Basic density (age 13) did not have significant variation at the family or locality level, although the trends in locality means (King Island low and the Strzelecki localities high) were consistent with previous stud-ies that have reported significant differences [1, 10, 26]. This suggested that the small sample size and the use of only the outer part of the core reduced the power of the current study and therefore significance would generally be underestimated. All of the trees used in this study had been cored previ-ously which meant tissue had potential exposure to infection by wood decaying organisms. The West Ridgley site is also a wet site which has been found to be a factor leading to an increase in the incidence of decay [25]. Localities differed significantly in the extent of decay with South King Island found to be particularly susceptible. This was the first evidence of genetic variation for decay resistance in E. globulus. The two main races ofE. globulusthat have been used for plan-tation growth in Australia, Strzelecki and King Island [32], were placed at either end of the range in decay as they have been previously for basic density [10]. The fast growing but low density King Island trees were originally grown for pulp production, however, Strzelecki and Western Otways became preferred [32]. It appears that high basic density trees now selected in the breeding program may be more resistant to decay. Although the narrow-sense heritability for decay was estimated here as zero, a high family means heritability was obtained (0.50±0.14). Narrow-sense heritability estimates in
E. nitenshave been found to vary between studies from 0.13 to 0.41 [20, 42], and also between sites in a single study rang-ing from 0.04 to 0.63 [20]. The successful exclusion of decay is likely the result of a number of traits including lignin and extractives contents, and therefore environmental and site in-fluences are likely to be strong [20].
4.2. Correlations amongst wood properties
Phenotypic correlations indicate the presence of relation-ships between traits that may be due to a similar response to environmental conditions or to genetic associations. Genetic correlations are important for determining the potential for concurrent or independent selection of traits. Correlations be-tween family means (adjusted for locality differences) and be-tween locality means, were used to give an indication of the genetic associations for this dataset. No study has yet identi-fied the genetic correlations among the chemical wood traits
(excluding pulp yield and cellulose content) and their corre-lated effects on the physical wood traits and growth inE. glob-ulus.
Correlations amongst the chemical wood traits were of-ten strong and as expected in terms of kraft pulping prop-erties [35]. A high pulp yield and cellulose content was as-sociated with low extractives, Klason lignin and total lignin contents at both the phenotypic and genetic levels. This was consistent with the phenotypic correlations reported by Wallis et al. [39] for 11 individuals of E. globulus. Miranda and Pereira [23] examined 37 provenances ofE. globulusand re-ported a similar correlation between pulp yield and extrac-tives content at the provenance level, but not with total lignin content. No significant correlations were identified between acid-soluble lignin content and Klason lignin content, consis-tent with the findings of Miranda and Pereira [23] who sug-gested differences in the lignin composition may be responsi-ble. Lignin and extractives contents were generally positively correlated here and Ona et al. [28] found similar relation-ships in a within-tree study of two E. globulus individuals. In E. nitens Kube and Raymond [21] reported a very high negative genetic correlation between extractives and cellulose contents. These studies collectively suggest that selection for increased pulp yield or cellulose content are likely to result in a reduction in lignin and extractives contents, which are favourable responses for a pulpwood breeding objective.
The correlated effect of lignin on wood density is interest-ing as density is one of the main selection traits in theE. glob-ulusbreeding program. Basic density at ages 11 and 13 were significantly positively correlated at most levels (r = 0.56,
P < 0.01 for families and r = 0.65, P < 0.0001 for indi-viduals), and both were negatively correlated with lignin con-tent at the family level. No other studies have looked at the relationship between lignin and basic density for larger sam-ple sizes inEucalyptus. However, a negative genetic correla-tion has also been found between density and lignin content in Pinus pinaster [31]. It is therefore likely that favourable lignin profiles are being indirectly selected along with high basic density. Similar to other studies inE. globulus[23, 28] no apparent relationship was found between basic density and extractives content, although there are reports of positive asso-ciations in bothE. globulus[41] andE. nitens[21].
Positive phenotypic and genetic correlations were found be-tween microfibril angle and lignin content which is consistent with observations for coniferous wood [34]. This relationship is thought to be due to the distribution of the microfibrils about their preferred orientation being large when the microfibril an-gle is large, therefore creating an imperfect alignment with more room for lignin deposition [38]. These results suggest that a reduced microfibril angle (which gives the fibre a greater tensile strength and decreases its shrinkage [7]) may be asso-ciated with improved lignin profiles for pulping.
incidence or extent with wood chemistry, it is important to distinguish between the chemistry found for normal healthy wood, and that found in diseased wood or in the reaction zone between healthy and diseased wood. It has been reported pre-viously that the extractives and lignin contents are elevated in response to decay in eucalypts [5, 18], with the extractives content found to be six times greater in the reaction zone com-pared to healthy sapwood [6]. Only negative locality level cor-relations were found in the current study between the extent of decay and both extractives and lignin contents. No correlations have been found between extent of decay and extractives con-tent in E. nitens [20], however, a negative relationship has been found inE. delegatensis[43]. Together these studies in-dicate that increases in extractives and lignin contents may only occur for diseased wood or in the reaction zone (both of which were removed in the current study), and the surround-ing, healthy wood has normal extractives and lignin levels.
A negative correlation between the extent of decay and ba-sic density (age 11) was observed at the locality level, which seemed to be the result of one locality (South King Island) that appeared to be particularly susceptible to decay and is known for its low basic density [10]. However, the extent of decay showed significant phenotypic correlations with basic density (age 11, negative), even with the South King Island locality removed from the analysis. Similar negative correlations have also been found inE. delegatensisandE. grandis[27, 43]. It has been proposed that lower density wood has wider cell lu-mina, and therefore a larger surface area is exposed to the en-zymes of decay micro-organisms, and also the water and air content in the wood may be at a level that promotes fungal growth [36]. A positive genetic correlation between the extent of decay and mean fibre length was also found, and may sup-port this idea. The lack of a significant correlation between the extent of decay and basic density at age 13, may be be-cause the decayed area of the core was removed prior to basic density measurements and only partial cores were used. The age 11 measures of wood density may have been taken be-fore the formation of the decay and may be more indicative of wood susceptibility to decay.
The combination of the chemical wood properties with the physical wood properties of Apiolaza et al. [1], allows a pri-mary analysis of the genetic variation of the most important traits associated with pulp production, and how they are cor-related with one another. This is the first study incorporating such a large number of traits forE. globulus, although the re-sults must be treated with some caution due to the small sam-ple size. The results indicate that when selecting for the cur-rent breeding objective traits of high basic density and pulp yield [17], other traits beneficial to the pulping process may concurrently be selected, including low lignin and extractives contents, and a high cellulose content, as well as improved fi-bre properties. Selection for high basic density may also result in increased resistance to decay. Growth may be selected for independently of most of the chemical wood properties and decay resistance.
Acknowledgements: The authors would like to thank Gunns Ltd for access to field trials, Leon Savage for assistance with field sampling, and also the Australian Research Council for support.
REFERENCES
[1] Apiolaza L.A., Raymond C.A., Yeo B.J., Genetic variation of phys-ical and chemphys-ical wood properties ofEucalyptus globulus, Silvae Genet. 54 (2005) 160–166.
[2] Appita Standard, Klason lignin in wood and pulp, Australian Pulp and Paper Industry Technical Association, Appita Standard P11s, 1978.
[3] Appita Standard, Organic solvent extractives in wood, pulp and paper, Australian Pulp and Paper Industry Technical Association, Appita Standard 1301.012s, 1994.
[4] Baillères H., Davrieus F., Pichavant F.H., Near infrared analysis as a tool for rapid screening of some major wood characteristics in a eucalyptus breeding program, Ann. For. Sci. 59 (2002) 479–490. [5] Barry K.M., Pearce R.B., Evans S.D., Hall L.D., Mohammed C.M.,
Initial defence responses in sapwood ofEucalyptus nitens(Maiden) following wounding and fungal inoculation, Physiol. Mol. Plant Pathol. 58 (2001) 63–72.
[6] Barry K.M., Pearce R.B., Mohammed C.L., Properties of reaction zones associated with decay from pruning wounds in plantation-grownEucalyptus nitens, For. Pathol. 30 (2000) 233–245. [7] Bootle K.R., Wood in Australia: types, properties, uses,
McGraw-Hill, Sydney, 1983.
[8] Cotterill P.P., Brolin A., Improving Eucalyptus wood, pulp and paper quality by genetic selection, in: Proceedings of the IUFRO Conference on Silviculture and Improvement of Eucalypts, Salvador, Brazil, August 24–29, 1997, pp. 1–13.
[9] Dutkowski G.W., Gilmour A.R., Borralho N.M.G., Modification of the additive relationship matrix for open pollinated trials, in: IUFRO International Symposium on Developing the Eucalypt of the Future, Valdivia, Chile, September 10–15 2001.
[10] Dutkowski G.W., Potts B.M., Geographic patterns of genetic varia-tion inEucalyptus globulusssp.globulusand a revised racial clas-sification, Aust. J. Bot. 47 (1999) 237–263.
[11] Evans R., Hughes M., Menz D., Microfibril angle variation by scan-ning X-ray diffractometry, Appita J. 52 (1999) 363–367.
[12] Gardiner C.A., Crawford D.F., Seed collections of Eucalyptus globulus subsp.globulus for tree improvement purposes, CSIRO Division of Forest Research, Canberra, 1987.
[13] Gardiner C.A., Crawford D.F., Seed collections ofEucalyptus glob-ulussubsp.globulusLabill. for tree improvement purposes, CSIRO Division of Forestry and Forest Products, Canberra, 1988. [14] Gilmour A.R., Cullis B.R., Welham S.J., Thompson R., ASREML
computer software, NSW Agriculture, Orange, 1999.
[15] Gominho J., Rodrigues J., Almeida M.H., Leal A., Cotterill P.P., Pereira H., Assessment of pulp yield and lignin content in a first-generation clonal testing ofEucalyptus globulusin Portugal, in: Proceedings of the IUFRO Conference on Silviculture and Improvement of Eucalypts, Salvador, Brazil, August 24–29, 1997, pp. 84–89.
[16] Greaves B.L., Borralho N.M.G., The influence of basic density and pulp yield on the cost of eucalypt kraft pulping: a theoretical model for tree breeding, Appita J. 49 (1996) 90–93.
[17] Greaves B.L., Borralho N.M.G., Raymond C.A., Breeding objective for plantation eucalypts grown for production of kraft pulp, For. Sci. 43 (1997) 465–472.
[19] Johnson G.R., Burdon R.D., Family-site interaction inPinus ra-diata: Implications for progeny testing strategy and regionalised breeding in New Zealand, Silvae Genet. 39 (1990) 55–62.
[20] Kube P.D., Genetic improvement of the wood properties of
Eucalyptus nitens: Breeding to improve solid wood and pulp prop-erties, Ph.D. thesis, University of Tasmania, Hobart, Australia, 2004.
[21] Kube P.D., Raymond C.A., Genetic parameters for Eucalyptus nitenssolid wood traits and relationships with pulpwood traits, in: IUFRO International Symposium on Developing the Eucalypt of the Future, Valdivia, Chile, September 10–15, 2001.
[22] Lopez G.A., Potts B.M., Dutkowski G.W., Apiolaza L.A., Gelid P.E., Genetic variation and inter-trait correlations in Eucalyptus globulusbase population trials in Argentina, For. Genet. 9 (2002) 217–231.
[23] Miranda I., Pereira H., Provenance effect on wood chemical com-position and pulp yield forEucalyptus globulusLabill, Appita J. 54 (2001) 347–351.
[24] Miranda I., Pereira H., Variation of pulpwood quality with prove-nances and site inEucalyptus globulus, Ann. For. Sci. 59 (2002) 283–291.
[25] Mohammed C., Barry K., Battaglia M., Beadle C., Eyles A., Mollon A., Pinkard E., Pruning-associated stem defects in plan-tationE. nitens andE. globulusgrown for sawlog and veneer in Tasmania, Australia, in: The future of eucalypts for wood pro-duction, Launceston, Tasmania, Australia, March 19–24, 2000, pp. 357–364.
[26] Muneri A., Raymond C.A., Genetic parameters and genotype-by-environment interactions for basic density, pilodyn penetration and stem diameter inEucalyptus globulus, For. Genet. 7 (2000) 317– 328.
[27] Nelson N.D., Heather W.A., Wood color, basic density, and decay resistance in heartwood of fast-grownEucalyptus grandisHill ex. Maiden, Holzforschung 26 (1972) 54–60.
[28] Ona T., Sonoda T., Ito K., Shibata M., Relations between vari-ous extracted basic densities and wood chemical components in
Eucalyptus globulus, J. Wood Sci. 44 (1998) 165–168.
[29] Pearce R.B., Tansley review No. 87. Antimicrobial defences in the wood of living trees, New Phytol. 132 (1996) 203–233.
[30] Poke F.S., Wright J.K., Raymond C.A., Predicting extractives and lignin contents in Eucalyptus globulus using near infrared re-flectance analysis, J. Wood Chem. Technol. 24 (2004) 55–67.
[31] Pot D., Chantre G., Rozenberg P., Rodrigues J.C., Jones G.L., Pereira H., Hannrup B., Cahalan C., Plomion C., Genetic control of pulp and timber properties in maritime pine (Pinus pinasterAit.), Ann. For. Sci. 59 (2002) 563–575.
[32] Potts B.M., Dutkowski G.W., Jordan G.J., Vaillancourt R.E., Providing a population genetic framework for exploitation of eucalypt genetic resources: The case of Eucalyptus globulus, in: Proceedings of the Australian Plant Breeding Conference, Adelaide, South Australia, April 19–23 1999, pp. 97–101. [33] Raymond C.A., Schimleck L.R., Muneri A., Michell A.J.,
Nondestructive sampling ofEucalyptus globulusandE. nitensfor wood properties. III. Predicted pulp yield using near infrared re-flectance analysis, Wood Sci. Technol. 35 (2001) 203–215. [34] Saka S., The relationship between the microfibril orientation in
the tracheid S2 layer and lignin content of coniferous woods, in: Sudo S. (Ed.) Proceedings of the Pacific Regional Wood Anatomy Conference, Tsukuba, Ibaraki, Japan, October 1–7, 1984, pp. 100– 102.
[35] Smook G., Handbook for pulp and paper technologists, Angus Wilde Publications, Vancouver, BC, 1992.
[36] Southam C.M., Ehrlich J., Decay resistance and physical character-istics of wood, J. For. 41 (1943) 666–673.
[37] TAPPI, Basic density and moisture content of pulpwood, TAPPI No. T258 om-98, 1989.
[38] Walker J.C.F., Butterfield B.G., The importance of microfibril angle for the processing industries, N.Z. For. 40 (1995) 34–40.
[39] Wallis A.F.A., Wearne R.H., Wright P.J., Analytical characteristics of plantation eucalypt woods relating to kraft pulp yields, Appita J. 49 (1996) 427–432.
[40] Wardlaw T., Mohammed C., Barry K., Eyles A., Wiseman D., Beadle C., Battaglia M., Pinkard L., Kube P., Interdisciplinary ap-proach to the study and management of stem defect in eucalypts, N.Z. J. For. Sci. 33 (2003) 385–398.
[41] Washusen R., Ades P., Evans R., Ilic J., Vinden P., Relationships be-tween density, shrinkage, extractives content and microfibril angle in tension wood from three provenances of 10-year-oldEucalyptus globulusLabill., Holzforschung 55 (2001) 176–182.
[42] White D.A., Raymond C.A., Kile G.A., Hall M.F., Are there ge-netic differences in susceptibility ofEucalyptus nitensandE. reg-nansstems to defect and decay? Aust. For. 62 (1999) 368–374. [43] Wong A.H.H., Wilkes J., Heather W.A., Influence of wood density
and extractives content on the decay resistance of the heartwood ofEucalyptus delegatensisR.T. Baker, J. Inst. Wood Sci. 9 (1983) 261–263.
![Table I. Breakdown of subraces (as classified by Dutkowski and Potts [10]), localities and families of E](https://thumb-us.123doks.com/thumbv2/123dok_us/8442208.334607/3.629.62.578.128.275/table-breakdown-subraces-classied-dutkowski-potts-localities-families.webp)