1
Published online before print June 30, 2014, doi: 10.1123/jab.2013-0317 Journal of 2
Applied Biomechanics 3
http://journals.humankinetics.com/jab-in-press/jab-in-press/validity-and-reliability-of-4
an-alternative-method-for-measuring-power-output-during-6-s-all-out-cycling 5
6
7
Validity and reliability of an alternative method for measuring power output during 6 s 8
all out cycling 9
10
Martin Watson1, Daniele Bibbo3, Charles R. Duffy1, Philip E. Riches4, Silvia Conforto3, and 11
Andrea Macaluso2 12
13
1
Strathclyde Institute of Pharmacy and Biomedical Sciences (SIPBS), University of 14
Strathclyde, Glasgow, United Kingdom 15
2
Department of Human Movement, Social and Health Sciences, University of Rome “Foro 16
Italico”, Rome, Italy 17
3
Department of Engineering, University “Roma Tre”, Rome, Italy 18
4
Department of Biomedical Engineering, University of Strathclyde, Glasgow, United 19
Kingdom 20
21
Conflict of Interest Disclosure: None. 22
Correspondence Address: Prof. Andrea Macaluso, Department of Human Movement, Social 23
and Health Sciences, University of Rome Foro Italico, Piazza Lauro De Bosis 6, 00135 24
Rome, Italy, Phone: +39 06 36733242, Fax: +39 0636733214, Email:
25
27
Running title: Six-second all-out cycling power output 28
30
Abstract 31
In a laboratory setting in which both a mechanically-braked cycling-ergometer and a motion 32
analysis (MA) system are available, flywheel angular displacement can be estimated by using 33
MA. The purpose of this investigation was to assess the validity and reliability of a MA 34
method for measuring maximal power output (Pmax), in comparison to a force transducer 35
(FT) method. Eight males and 8 females undertook 3 identical sessions, separated by 4-6 36
days, the first being a familiarisation. Individuals performed three 6-s sprints against 50% of 37
the maximal resistance to complete two pedal revolutions with a 3-min rest between trials. 38
Power was determined independently using both MA and FT analyses. Validity: MA 39
recorded significantly higher Pmax than FT (P<0.05). Bland and Altman plots showed that 40
there was a systematic bias in the difference between the measures of the two systems. This 41
difference increased as power increased. Repeatability: intraclass correlation coefficients 42
were on average 0.90±0.05 in males and 0.85±0.08 in females. Measuring Pmax by MA, 43
therefore, is as appropriate for use in exercise physiology research as Pmax measured by FT, 44
provided that a bias between these measurements methods is allowed for. 45
46
Keywords: motion analysis; force transducers; flywheel; acceleration; instrumented pedal.
47
Word Count: 1,992 words 48
50
Introduction 51
Maximal muscle power (Pmax) generated during an all-out action lasting a few seconds 52
is an important physiological measurement that can provide valid information as to the 53
training status of individuals1-7. Pmax is closely related to athletic performance and many 54
athletes aim to develop muscle power to enhance performance3-5. In addition, there are 55
general fitness benefits and rehabilitation advantages from developing maximal muscle 56
power as it has been shown that improvements in maximal muscle power are accompanied 57
with an increase in functional ability in elderly individuals 6,7. 58
Repeated bouts of short duration, high-intensity exercise are common in certain team 59
sports, and muscle power in these exercise regimens has been correspondingly investigated8,9. 60
In addition to the amount of power produced, the rate at which the peak power occurs also 61
has performance implications for athletes3, and for recreationally active1 and older 62
individuals10,11. 63
Pmax can be estimated from the measure of flywheel angular displacement of a 64
frictionally braked cycle ergometer, typically measured by means of incremental 65
encoders12,13. However, biomechanics laboratories often have motion analysis systems able to 66
measure the kinematics of pedalling14. We propose that motion analysis can also be used to 67
measure flywheel angular displacement and hence estimate Pmax. The purpose of this study 68
is therefore to measure the reliability and validity of using motion analysis to determine Pmax 69
compared to the direct measure of power using pedal-mounted strain gauges. 70
71
Methods 72
Participants 73
and eight women (age 23.1±3.4 y; stature 1.65±0.06 m; body mass 60.4±5.0 kg; mean ± SD) 75
volunteered for the study. Participants were required to be exercising at least three times per 76
week, either aerobic or strength training, for at least 30 min, and free from any current 77
muscular or joint injury and cardiovascular or metabolic disease. Volunteers were advised not 78
to alter their current training program and they attended the laboratory at the same time of 79
day to avoid day to day variability15. The study was approved by the Ethics Committee of the 80
University of Strathclyde. 81
Equipment 82
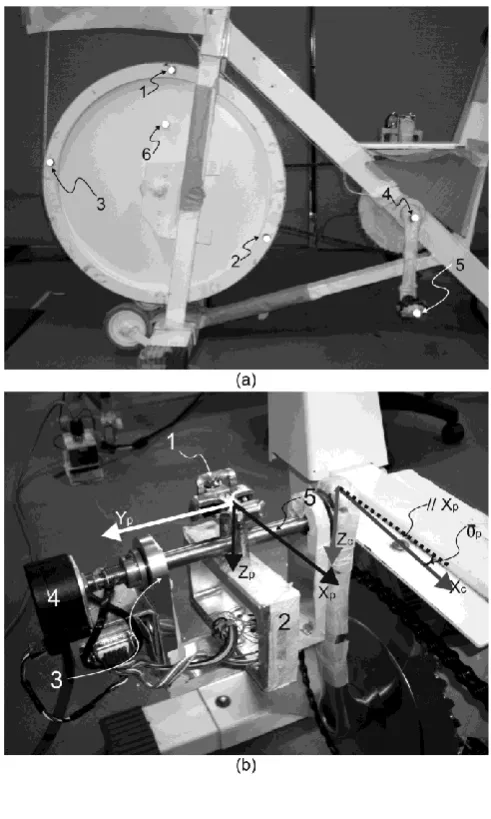
Motion Analysis. Three reflective markers were placed equidistant around the edge of the
83
flywheel of a Monark ergometer (Figure 1A, Monark 812E, Stockholm, Sweden). A 84
reference marker was placed midway between these markers to allow consistency of marker 85
labelling and identification. Two markers were placed on the pedal and the centre of the 86
crank. All markers were 1cm in diameter and placed on the left hand side of the ergometer. 87
Kinematic data were collected using a five camera motion analysis system (Vicon 612, 88
California, USA) operating at 250 Hz. All subsequent calculations were made using Matlab 89
6.5.1 (Mathworks, MA, USA). 90
91
Insert Figure 1 here. 92
93
Force transducers. An instrumented pedal (Figure 1B) was used to measure two force
94
components applied to the pedal16-18. Using a reference system related to the pedal 95
(Xp,Yp,Zp), Fz, defined perpendicular to the pedal load plane and directed downward (Zp
96
axis), and Fx, defined parallel to the pedal load plane and directed forward (Xp axis) were
97
determined. . 98
through two spacer screws to a specially designed load cell (2), which was fixed to a “U” 100
shape stirrup (3) with two circular holes on its extremities. In these holes two ball bearings 101
were fitted to allow the relative rotation of the stirrup and a transmission-shaft (5), fixed to 102
the crank of the bicycle. The load cell transmitted force to the crank through the stirrup and 103
the spindle, thus enabling the participant to cycle as though using a commercial pedal. Angle 104
p was measured using a smart encoder (4) positioned between the stirrup, using another 105
stirrup of smaller dimensions, and the spindle, which had a cylindrical hole at the 106
corresponding extremity. The load cell was based on a strain gauge system arranged in two 107
full Wheatstone bridges. Pedal data were acquired at 1000 Hz and synchronised to the 108
kinematic data using an Analog to Digital Converter card (ADC) in the Vicon workstation. 109
Calibration. The instrumented pedal was calibrated by applying known loads from zero to
110
200 N to it. For the Fz force, the pedal was loaded positioning it on a flat surface and adding
111
weights to it in the middle of the clipless fastening system19. For the Fx force the procedure
112
was repeated with the pedal being rotated by 90°. Output signals from both channels were 113
measured and a calibration matrix C was estimated, taking into account crosstalk, to obtain 114
force values (Fz,Fx) from voltage output (Vz,Vx) as:
115 x z x z V V c c c c F F 22 21 12 11 116
All the procedures described above were repeated once prior to the 1st day of testing 117
and once after the last day of testing. 118
Experimental procedure 119
Volunteers attended the laboratory on three occasions, the first being a familiarisation. 120
Four to six days elapsed between sessions. Warm up consisted of 5 minutes of sub-maximal 121
cycling (100-150 W) followed by two six second sprints against frictional loads12 of 0.25 122
resistance to complete two pedal revolutions (2RM), according to Macaluso et al6. Three 124
minutes of rest occurred between each attempt. 125
After a further five minute resting period, participants then performed three six-second 126
sprints against 50% of 2RM, with three minute rest between trials. The participants left leg 127
rested on the space between the two pedals at all times. 128
Data processing 129
Power calculations through motion analysis. The following moments were assumed to act
130
on the flywheel: the propulsive moment due to human effort, MH, the resistive moment due to
131
belt friction, MB, and the resistive moment due to other friction, MO. The sum of these
132
moments are equal to the inertial load of the ergometer, i.e. 133
MH – MB – MO = I1α1 + I2α2 (equation 1)
134
where I1 is the moment of inertia of the flywheel (manufacturer supplied data), I2 is the
135
moment of inertia of the crank, pedal and chain ring and chain, and is the angular 136
acceleration of the flywheel and the angular acceleration of the other components. The 137
resistive moment due to belt friction may be described by 138
MB = μLr
139
where μ is the coefficient of friction, r is the radius of the flywheel and L is the applied load. 140
The coefficient of belt friction and MO were calculated by placing a known resistance
141
against the flywheel (ranging from 9.81 N to 29.4 N) and decelerating the flywheel from 120 142
rpm similarly to Arsac et al12 and Lakomy13.MH was calculated from equation 1 assuming
143
I22 = 0. Finally, power was calculated using P = MH x where ω = angular velocity of the
144
flywheel. Both and were determined using marker coordinate data20. 145
Power calculations through force transducers.
146
p x
p z
t
F
F
F
sin
cos
148
p x
p z
n
F
F
F
cos
sin
149 2 2 2 2 n t z x
tot
F
F
F
F
F
150
The torque Tc applied to the chain ring was calculated as the product between the Ft 151
and the moment arm d, represented by the crank (d = 170 mm). The torque Tf applied to the 152
flywheel was obtained multiplying Tc by the gear ratio of the ergometer transmission. The 153
power applied to the chain ring, which is the same applied to the flywheel, was calculated as 154
the product of Tc and the angular velocity of the chain ring. 155
Further analysis. Figure 2 shows a typical power output of one participant during a 50%
156
2RM trial obtained from MA and FT, respectively. Average power was defined as the 157
average of the instantaneous values over the first 6 seconds. 158
159
Insert Figure 2 here. 160
161
Statistics 162
Comparisons of average power between the two methods (MA and FT) for each of the 163
three trials were carried out by ANOVA for repeated measures, followed by Student’s t-tests. 164
Absolute agreement between the two methods was assessed by determining the mean 165
difference (bias) and 95% limits of agreement as described by Bland and Altman21. 166
Reliability was assessed using Intraclass Correlation Coefficient. 167
168
Results 169
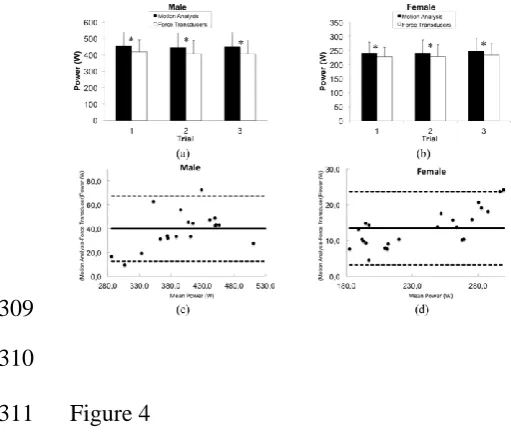
Motion analysis methods recorded statistically higher average power outputs than force 170
participants (p < 0.05, Figure 3 and 4). Bland and Altman plot showed that there was a 172
systematic bias in the difference between the measures of the two systems in both males 173
(Figure 3c and 4c) and females (Figure 3d and 4d), which increased with power. 174
175
Insert Figure 3 and 4 here. 176
177
Good reliability in average power at 50% of 2RM, as measured by the motion analysis 178
system, was evident both between and within days, with average ICCs of 0.900±0.048 and 179
0.878±0.045 for males and females, respectively (Table 1). 180
181
Insert Table 1 here 182
183
Discussion 184
Motion analysis provided a highly reliable measure of mechanical power output in 185
short-duration explosive movements. However, it overestimated mechanical power output 186
compared to the measure obtained by means of instrumented pedals. The difference between 187
the measures increased with speed and therefore power. 188
The motion analysis measured the energy supplied per second to the flywheel, whilst 189
the force transducers on the pedals measured the power applied to the chain ring. The power 190
measured at the pedal was taken as more accurate, since it has fewer assumptions associated 191
with its measurement. To make these measures equivalent, we accounted for the energy lost 192
to the system by including a constant for system friction, MO. Alternative representations for
193
this loss of energy may be more appropriate. Another source of error could be the moment of 194
inertia of the flywheel (1 kg∙m2) taken from the manufacturer’s literature. If this was
195
peaks and troughs being overshot, as shown in Figure 2. However, if this was the case, not 197
only peaks and troughs would be observed, but also differences in the slopes of the ascending 198
and descending phases of the power curves. 199
The estimation of power from the acceleration of a flywheel of a cycle ergometer is not 200
a new technique and torque measured at the pedals has been previously found to be higher 201
than that measured at the flywheel22. The differences with our findings can be attributed to 202
the fact that Lakomi et al.22 measured torque by means of a torque transducer attached to a 203
split chain, which was affected by the inertia of the flywheel, thus underestimating torque. 204
Our ICC values data of around 0.9 represent good inter- and intra-day reliability and are 205
comparable with tests of power output when pedalling on a constant load cycle ergometer 206
(R=0.91-0.97) 23. 207
A major application of this research is the use of motion analysis to measure muscle 208
power when direct measures with force transducers are not available. To enhance adoption, 209
future methodological studies should address the issue of energy loss within the system, to 210
better predict mechanical power measured at the pedal. 211
212
References 213
1. Cronin J, Sleivert G. Challenges in understanding the influence of maximal power 214
training on improving athletic performance. Sports Med. 2005; 35: 213-234. 215
2. Sargeant AJ, Hoinville E, Young A. Maximum leg force power output during short-216
term dynamic exercise. J Appl Physiol. 1981; 51 1175-1182. 217
3. Kraemer WJ, Newton RU. Training for muscle power. Phys Med Rehabil Clin N Am. 218
2000; 11: 341-368. 219
4. Stewart D, Farina D, Shen C, Macaluso A. Muscle fibre conduction velocity during a 220
30-s Wingate Anaerobic Test. J Electromyogr Kinesiol. 2011; 21: 418–422. 221
5. Castronovo AM, Conforto S, Schmid M, Bibbo D, D'Alessio T. How to assess 222
performance in cycling: the multivariate nature of influencing factors and related 223
indicators. Front Physiol. 2013; 4: 116. doi:10.3389/fphys.2013.00116 224
to resistance training increases muscle strength, power, and selected functional 226
abilities in healthy older women. J Appl Physiol. 2003; 95: 2544-2553. 227
7. Rahmani A, Viale F, Dalleau G, Lacour JR. Force/velocity and power/velocity 228
relationships in squat exercise. Eur J Appl Physiol. 2001; 84: 227-232. 229
8. Docherty D, Wenger HA, Neary P. Time motion analysis related to the physiological 230
demands of rugby. J Human Mov Stud. 1988; 14: 269-277. 231
9. Hamilton AL, Nevill ME, Brooks S, Williams C. Physiological responses to maximal 232
intermittent exercise: differences between endurance trained runners and games 233
players. J Sports Sci. 1991; 9: 371-382. 234
10.Macaluso A, De Vito G. Comparison between young and older women in explosive 235
power output and its determinants during a single leg-press action after optimisation 236
of load. Eur J Appl Physiol. 2003; 90: 458-463. 237
11.Giombini A, Macaluso A, Laudani L, et al. Acute effect of whole-body vibration at 238
optimal frequency on muscle power output of the lower limbs in older women. Am J 239
Phys Med Rehabil. 2013; 92(9): 797-804. 240
12.Arsac LM, Belli A, Lacour JR. Muscle function during brief maximal exercise: 241
accurate measurements on a friction loaded cycle ergometer. Eur J Appl Physiol. 242
1996; 74: 100-106. 243
13.Lakomy HK. Measurement of work and power output using friction-loaded cycle 244
ergometers. Ergonom. 1986; 29: 509-517. 245
14.Sides D, Wilson C. Intra-limb coordinative adaptations in cycling. Sports Biomech. 246
2012; 11: 1-9. 247
15.Hill WD, Borden DD, Darnaby KM, Hendricks DM, Hill CM. Effect of time of day 248
on aerobic and anaerobic responses to high intensity exercise. Can J Sport Sci. 1992; 249
17: 316-319. 250
16.Bibbo D, Conforto S, Bernabucci I, Schmid M, D'Alessio T. A wireless integrated 251
system to evaluate efficiency indexes in real time during cycling. IFMBE 252
Proceedings. 2008; 22: 89-92. 253
17.Bibbo D, Conforto S, Bernabucci I, Carli M, Schmid M, D'Alessio T. Analysis of 254
different image-based biofeedback models for improving cycling performances. SPIE 255
Proceedings. 2012; 8295: art n 829503. 256
18.De Marchis C, Schmid M, Bibbo D, Castronovo AM, D'Alessio T, Conforto S. 257
Feedback of mechanical effectiveness induces adaptations in motor modules during 258
cycling. Front Comput Neurosc. 2013; 7: 35. doi:10.3389/fncom.2013.00035 259
19.Conforto S, Sciuto SA, Bibbo D, Scorza A. Calibration of a measurement system for 260
the evaluation of effectiveness index in bicycle training. IFMBE Proceedings. 2008; 261
22: 106-109. 262
power and EMG during 6-s all-out cycling between young and older women. J Sports 264
Sci. 2012; 30: 1311-1321. 265
21.Bland JM, Altman DG. Statistical-methods for assessing agreement between 2 266
methods of clinical measurement. Lancet. 1986; 1: 307–10. 267
22.Lakomy HKA. An indirect method for measuring the torque applied to friction loaded 268
cycle ergometers. Ergonom. 1993; 36: 489-496. 269
23.Williams JH, Barnes WS, Signorile JF. A constant load ergometer for measuring peak 270
power output and fatigue. J Appl Physiol. 1988; 65: 2343-2348. 271
Figure Captions 273
274
Figure 1 — A) The flywheel with reflective markers (1-5) in place. Point 6 corresponds to the 275
reflective reference marker to allow subsequent consistent labelling of the markers. B) The 276
force transducer pedal and the two reference systems: (Xp, Yp, Zp) is related to the pedal, 277
whilst (Xc, Yc, Zc) is related to the crank. 278
279
Figure 2 — Typical power output from one participant during a 50% 2RM trial obtained 280
from motion analysis (black circles) and force transducers (grey squares). 281
282
Figure 3 — Average power (W) during 6 s sprint trials at 50% of 2RM at day 1. Average 283
power from motion analysis (black bars) and force transducers (white bars) per each of the 3 284
trials in males (a) and females (b). Data are presented as mean ± SD (* p=<0.001). 285
Corresponding Bland and Altman plots showing the differences in power between motion 286
analysis and force transducers in males (c) and females (d). Bias and random error lines (95% 287
limits of agreement) are included. 288
289
Figure 4 — Average power (W) during a 6 s sprint trials at 50% of 2RM at day 2. Average 290
power from motion analysis (black bars) and force transducers (white bars) per each of the 3 291
trials in males (a) and females (b). Data are presented as mean ± SD (* p=<0.001). 292
Corresponding Bland and Altman plots showing the differences in power between motion 293
analysis and force transducers in males (c) and females (d). Bias and random error lines (95% 294
limits of agreement) are included. 295
297
298
Figure 1 299
[image:13.595.70.316.69.479.2]301
302
Figure 2 303
305
306
Figure 3 307
309
[image:16.595.37.293.73.292.2]310