City, University of London Institutional Repository
Citation
:
Evans, Alison Ruth (2006). Use of the internet as a data collection tool: amethodological investigation of sampling and mode effect. (Unpublished Doctoral thesis, City University)
This is the accepted version of the paper.
This version of the publication may differ from the final published
version.
Permanent repository link:
http://openaccess.city.ac.uk/19750/Link to published version
:
Copyright and reuse:
City Research Online aims to make research
outputs of City, University of London available to a wider audience.
Copyright and Moral Rights remain with the author(s) and/or copyright
holders. URLs from City Research Online may be freely distributed and
linked to.
Use of the Internet as a data collection tool:
a methodological investigation of
sampling and mode effect
Alison Ruth Evans
Thesis submitted for the degree of
Doctor of Philosophy
City University
Department of Sociology and
School of Nursing and Midwifery
January 2006
Table of contents
Volume 2
List of tables
... 5
List of figures
... 6
PART
III-MODE EFFECTS IN STUDIES OF SEXUAL BEHAVIOUR
7
Web and pen-and-paper survey item non response ... 8
7.1 Introduction ... ... 8
7.1.1 Item nonresponse and its effects .. .. .. .. .. .. .. .. .. .. .. .. .. .. .. .. .. .. .. .. .. .. 9
7.1.2 Sensitive content ... 12
7.1.3 Respondent influences ... 14
7.1.4 7.1.5 7.1.3.1 Inadequate understanding or comprehension ... 18
7.1.3.2 Low motivation or effort ... 21
7.1.3.3 Retrieval of information ... 23
7.1.3.4 Withholding available information ... 25
7.1.3.5 Beliefin the adequacy of response ... 27
Interviewer influences ... 28
Questionnaire influences 7.1.5.1 Question routing 7.1.5.2 Question order 7.1.5.3 Data checking ... 30
... 34
... 35
... 36
7.1.6 Mode influences ... 38
7.1.6.1 Computerisation and sensitive behaviour ... 38
7.1.6.2 Use of the Internet ... 42
7.2 Methods ... 46
7.2.1 Sample comparability... ... ... 46
7.2.2 Questionnaire comparability ... 47
7.2.4 Data analysis ... 50
7.2.4.1 Item nonresponse for each respondent ... 50
7.2.4.2 Item nonresponsefor each question ... 51
7.2.4.3 Quantifying item nonresponse ... 51
7.2.4.4 Analysing item nonresponse ... 52
7.3 Findings ... 55
7.3.1 Influence of respondent variables ... 55
7.3.2 Influence of questions and survey mode ... 68
7.4 Discussion of findings ... 85
7.4.1 Implications for researchers ... 91
8
Participating in online and offline qualitative interviews ..
928.1 8.1.1 8.1.2 8.1.3 Introduction ... 92
Interviews in social research ... 93
Internet-mediated communication ... ... 95
Online interviews .. . .. . . .. . .. . . .. . . .. . . .. . .. . .. ... . . .. . . .... 98
8.1.3.1 What are online interviews? ... 98
8.1.3.2 What are the pros and cons of online interviews? .... .. ... 99
8.1.3.3 Features of synchronous and asynchronous interviews ... 102
8.1.4 The online interview in context ... 106
8.1.5
8.2
8.1.4.1 Respondent use of the online medium ... 1068.1.4.2 Online identity and self-presentation ... 108
8.1.4.3 Online rapport and trust Interviews with sexual content 111 114 Methods ... 117
8.2.1 Interview procedure ... 119
8.2.2 Interview piloting and topic guide development ... 121
8.2.3 Ethics for methodological interviews ... 124
8.3
8.3.1
8.3.2
8.3.3
8.3.4
8.3.5
8.3.6
Findings ... 130
Respondent profile ... 130
Methodological interview duration and word count ... 133
Internet and HIV interview experience ... 135
8.3.3.1 Freedom of expression ... 135
8.3.3.2 Nature of the interview interaction ... 138
8.3.3.3 Verbalising behaviour ... 140
Respondent perspectives on personal privacy ... 141
8.3.4.1 Anonymity and confidentiality in the interview ... 141
8.3.4.2 Perception of general online privacy ... 142
Rapport from the interviewer's perspective ... 144
8.3.5.1 Paralanguage in the methodological online interviews ... 144
8.3.5.2 Online speed of interaction and multi-tasking ... 146
Practicalities of the methodological interview ... 148
8.3.6.1 Interview arrangements ... 148
8.3.6.2 Use of technology in online andface-toface interviews ... 152
8.4 Discussion of findings ... 154
8.4.1 Implications for researchers ... 158
PART IV - CONCLUSION
9
Concluding discussion
... 1609.1 Introduction ... 160
9.2 Researching the population of gay and bisexual men ... 160
9.3 Collecting data on sexual behaviour ... 167
9.4 Limitations and future directions ... 170
List of appendices
...
171Appendices
...
172List of tables
Volume 2
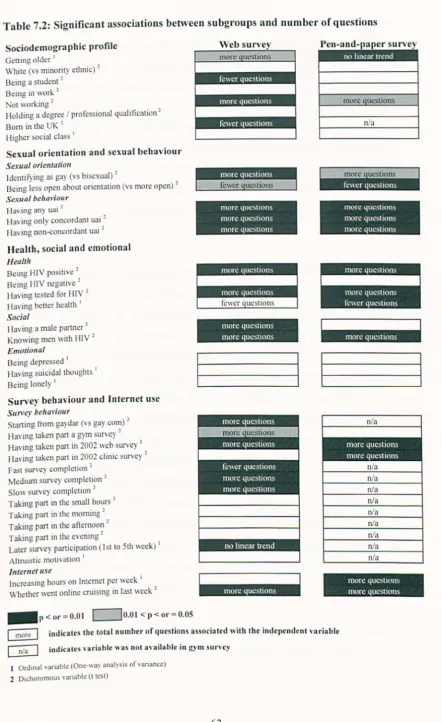
Table 7.1: Significant associations between subgroups and item nonrepsonse 59 Table 7.2: Significant associations between subgroups and number of 63
questions
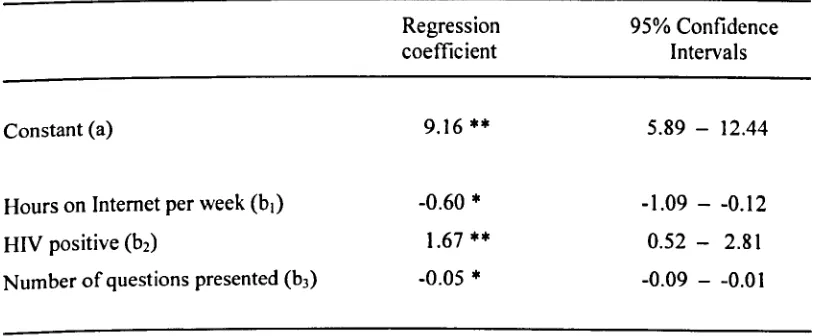
Table 7.3: Coefficients predicting item nonresponse for Internet respondents 66 Table 7.4: Coefficients predicting item nonresponse for gym respondents 67 Table 7.5: Item nonresponse associated with questions 69 Table 7.6: Item nonresponse for subsets of questions in web and pen-and- 72
paper surveys
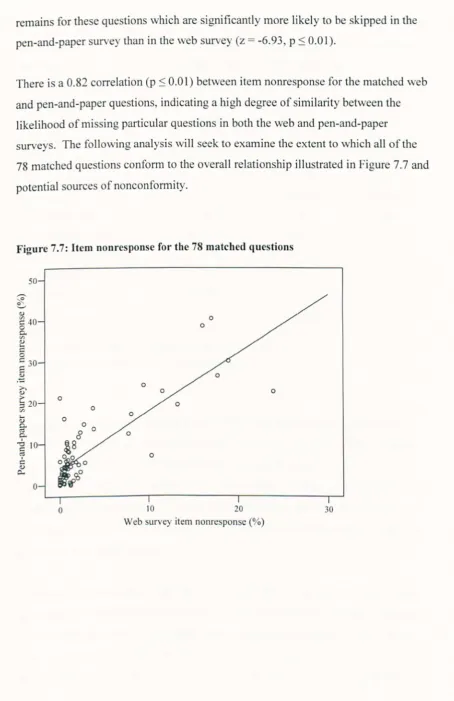
Table 7.7: Item nonresponse to equivalent questions in web and pen-and- 80 paper surveys
Table 7.8: Questions with disproportionately high pen-and-paper item 82 nonresponse
List of figures
Volume 2
Figure 7.1: Beatty and Herrmann's decision model of item nonresponse 17 Figure 7.2: Radio button question format 32 Figure 7.3: Drop-down box question format 32 Figure 7.4: Unacceptable and acceptable survey instructions 34
Figure 7.5: Data checking pop-up 37
Figure 7.6: Proportion of questions skipped by respondents 56 Figure 7.7: Item nonresponse for the 78 matched questions 71 Figure 7.8: Proportion of item nonresponse for sensitive sexual questions 75 Figure 7.9: Proportion of item nonresponse for alcohol and drug use questions 76 Figure 7.1 0: Pen-and-paper survey format for questions about alcohol and 77
drug use
Figure 7.11: Web survey format for questions about alcohol and drug use 77 Figure 7.12: Pen-and-paper survey format for question about HIV positive men 81 Figure 7.13 : Format of question about number of sex partners in past 3 months 83
Figure 8.1: Extract from topic guide
Figure 8.2: Extract of framework used in analysis
Figure 9.1: Kinsey's heterosexual-homosexual rating scale
123 127
PART
III
MODE EFFECTS IN STUDIES OF
7
Web and pen-and-paper survey item
nonresponse
Synopsis
Secondary analysis was used to compare the item nonresponse in the Internet and HIV 2003
web survey with the 2003 pen-and-paper survey completed by the gym sample. Use ofthe
web survey was associated with a significant reduction in item nonresponse, although it did
not appear to reduce item nonresponse to sensitive questions over and above other questions.
7.1
Introduction
Part two of this thesis focussed on factors associated with generating self-selected
Internet samples of gay and bisexual men. It examined the reasons why men may participate in web surveys of sexual behaviour, the impact of drop out and the men
that we might expect to find in the final sample. Part three shifts the focus from the
sample recruited to the data collected. Having established that the Internet provides
a valuable new location for sampling gay and bisexual men, it is important to
investigate the quality of the data that are likely to be generated. Part three of this
thesis examines the influence of the Internet mode on the data collected using
quantitative and qualitative methods.
Chapter 8 will explore the Internet mode in qualitative research. This chapter
presents an examination of the individual's response to questions within the survey
and addresses the question:
"What is the modal difference in item nonresponse when gay and bisexual men
complete web and pen-and-paper surveys of sexual behaviour?"
This introductory section begins with a description of item nonresponse and its
exploration of a range of influences on item nonresponse: the respondent, the
interviewer, the questionnaire and the mode.
7.1.1
Item non response and its effects
In the same way that unit nonresponse is a measure of how completely the selected
sample responds to the survey, item nonresponse is a measure of how completely the
selected items are answered. It may occur because a question is skipped on purpose or by mistake, because the respondent does not know the answer or is unable to give
one, because the appropriate answer is not included among the response categories or
because the response given is unreadable (de Leeuw 2001). It results in a failure to obtain the information required by particular questions (Groves 1989) and in this
way is seen as introducing a gaps into the data matrix (de Leeuw 2001).
Such information gaps not only occur when a respondent refuses point blank to
answer a question but are also said to occur if the respondent gives a "don't know"
response (Groves 1989), which may be a polite way of refusing to answer the
question (de Leeuw 2001). The informational content of the "don't know" response
must be assessed, however, before it can be dismissed as item nonresponse. Thus
when men are asked about their boyfriend's HIV status in the Internet and HIV
surveys, "don't know" is an important response which carries a great deal
information.
Differences have also been found to exist in how respondents use "don't know" and
refusal to answer. Thus, 7% of questions resulted in "don't know" responses and
1.5% in refusals, with more sensitive questions resulting in more refusals and fewer
"don't knows" and questions requiring more cognitive effort resulting in more
refusals and more "don't knows" (Shoemaker et al. 2002). Although a number of
studies incorporate "don't knows" into item nonresponse, such differences have led
to restricting the definition of item nonresponse to item refusal in the present study,
Item nonresponse may be described as "ignorable" where nonresponders and
responders have similar distributions on the variables of interest and "non-ignorable"
where this is not the case (Copas & Farewell 1998). When nonresponders and
responders are similarly distributed, the effect of excluding cases containing item
nonresponse from the analysis will reduce the sample size and, if extensive, result in
less statistical power and create problems where multi-item scales or multivariate
analysis are used (Dickinson & Kirzner 1985). When those who gave responses
differing systematically from those who did not, item nonresponse will also lead to
biased population estimates (de Leeuw 2001; Kupek 1999). In the context of
research on sexual behaviour and HIV prevention, such measurement error may
distort estimates of high risk behaviour and weaken epidemiological work (Catania et
al. 1993). It is therefore important to encourage the respondent to provide a full response.
Although these effects of item nonresponse mirror those of unit nonresponse, Groves
(1989) considers that the origins of item nonresponse have more in common with
other types of measurement error:
"it is much more a part of the measurement process than is unit nonresponse, and the cognitive and affective psychological influences to item missing data
resemble those involving measurement error" (Groves 1989: 156).
In the light of this, the following review of the literature will discuss item
nonresponse in the context of measurement error.
The chapter will compare item nonresponse in the 2003 Internet and HIV web survey
and the 2003 pen-and-paper survey that was completed by the gym respondents in
order to examine whether there is a mode effect on this aspect of data quality.
Couper (2001) recommends that, when comparing the data quality of web surveys
with other survey modes, the researcher should be explicit about the type of web
survey, the nature of the survey mode with which it is being compared and the source
of error that is the focus of attention. The type of web survey adopted here and the
elsewhere (Volume 1, pp40-44). Item nonresponse was chosen as an indicator of
data quality for the following reasons.
Item nonresponse is one of four sources of measurement error that may apply to
questions of sexual behaviour. The other three are failure to report having
participated in an activity, underreporting frequency of participation and
overreporting frequency of participation (Catania et al. 1990). These other errors are
difficult to detect, however, because of the absence of any reliable form of external
validation (Catania et al. 1990; Saltzman et al. 1987). Although examination of
concordance or divergence of reported sexual behaviour on a number of measures
may prove insightful (Coxon 1999), methods of validating self-reported sexual
behaviour are limited to test-retest studies, independent replications within the same
population and comparison of reports by regular partners (Turner et al. 1997). A
review of the literature from 1990 to 1995 found that reliability of self-reported
sexual behaviour was most often examined using test-retest equivalence and internal
consistency within the questionnaire and the authors suggest that congruent findings
from different methods may also be used as an indicator of reliability (Weinhardt et
al. 1998).
Whatever means are used to test reliability, however, replication does not necessarily
confer validity upon the measures. Thus, the test-retest reliability of reported sexual
behaviour might be partially attributed to memory of the estimates rather than
memory of the actual behaviour.
Item nonresponse as a measure of data quality has the advantage of being easily
quantifiable and has been used as a measure of data quality in a number of studies
(eg Kwak & Radler 2002). Furthermore, refusal rates are the most frequently
reported index of measurement error in sexuality surveys (Catania et al. 1993).
While recognising that respondents may not always provide the optimal response and
that "lack of missing data does not necessarily imply better data quality" (Couper &
Rowe 1996: 97), it is certainly the case that an excess of item nonresponse is an
The source of item nonresponse may lie with the respondent, the interviewer, the
questionnaire, the mode of data collection or an interaction between these influences
(Catania et al. 1993; de Leeuw 2001). The following review will therefore examine
how each of these influences has been found to impact item nonresponse in order to
set the context for the modal comparison undertaken here. As the analysis is
concerned with the web and pen-and-paper mode, the review will focus on item
nonresponse and related issues of measurement error in the context of
self-completion, although the broader differences between response to
interviewer-administered and self-completion surveys will be identified.
7.1.2 Sensitive content
A key issue for the present analysis is that of response to questions of a sexual
nature. Such questions are commonly labelled "sensitive" and are said to elicit
socially desirable responses to the extent that they conform to the respondent's
concept of what is socially acceptable. Although Catania (1997) argues that
questions of sexual behaviour may be considered to fall at one extreme of the
sensitivity distribution, I have argued that question sensitivity is a more imprecise
measure than is often assumed and depends on a number of factors. Even though at
least some questions of sexual behaviour will be sensitive for at least some
respondents, it does not mean that they will result in item nonresponse. Thus, 34%
of respondents considered sexual behaviour to be an overly personal research subject
but only 6% and 7% of respondents skipped questions about sexual intercourse and
masturbation respectively in the same study (Bradburn et al. 1978). The authors
concluded that the proportion of item nonresponse was a poor indicator of the
potential threat of these questions.
Low levels of item nonresponse have been similarly found in a number of surveys of
sexual behaviour. 90% of Natsal 1990 respondents omitted less than 6% of
questions in this combined interviewer- and self-administered survey. This was
"the vast majority of respondents to this survey complied with the questionnaire" (Kupek 1998: 593).
Very little item nonresponse has been found in the National AIDS Behavioral
Survey, an RDD survey of sexual behaviour (Catania et al. 1993; Peterson & Catania 1997). Only 1.5% of 18 to 29 year olds and 2.9% of 60 to 75 year olds refused to
answer at least one question and it was concluded that once cooperation had been
engaged, respondents were generally willing to answer the questions posed (Catania
et al. 1993). Item nonresponse was also low for questions of sexual behaviour in an
experiment investigating the impact of four survey modes (lobe et al. 1997) and
comparatively low in the self-completion section of a survey of sexual behaviour and
attitudes (Johnson & Delamater 1976). The latter study found that item nonresponse
was highest for questions about age at first masturbation (19%) and at first sexual
intercourse (20%) and not meaningfully related to sociodemographic profile. The
authors suggest that the sensitivity of respondents to questions of sexual behaviour
may be overestimated and that of researchers and interviewers may be
underestimated.
Singer (1978) found that most sensitive questions in an interviewer-administered
questionnaire were skipped by less than 2% of respondents but questions on
masturbation (10%) and income (11 %) produced the highest item nonresponse.
Indeed, questions on income commonly produce the highest levels of item
nonresponse in surveys (Catania 1997; Shoemaker et al. 2002). Kahon (1983) also
reports that simple sociodemographic questions are likely to produce little
nonresponse, whereas questions about expenditure may result in item nonresponse of
more than 10%. This is reflected in a postal survey of health issues which obtained
low item nonresponse for age (2%), marital status (1 %), ethnicity (1 %) and
education (1 %) but a higher rate for annual household income (9%) (Gilbert et al. 1992).
The above has shown that we should not expect particularly high levels of item
nonresponse because of the sexual content of the Internet and HIV surveys or in
questions on income. The following will examine other factors that have been found
to impact item nonresponse.
7.1.3 Respondent influences
As discussed earlier, item nonresponse may be influenced by the respondent, the
interviewer, the questionnaire, the mode of data collection or an interaction between
these influences (Catania et al. 1993; de Leeuw 2001). What follows is an
exploration of the influence of the respondent beginning with a descriptive account
of respondent influences before moving on to a cognitive model.
In an early investigation of item nonresponse in a postal survey, over one third of
respondents filled out the questionnaire completely, one quarter failed to answer one
question with the remainder missing at least two questions (Ferber 1966). Item
nonresponse was higher for women than men, for older than younger and for the less
educated. Indeed, age and education have been found to correlate consistently with
item nonresponse (de Leeuw 2001). For example, despite the fairly low levels of
item nonresponse reported in a postal survey of health issues, questions on sexual
orientation and income were more likely to be skipped by females, older respondents
and those with less education. Age was also associated with skipping one or more
questions in another postal health survey where 58% of respondents provided a
complete set of answers (Gilbert et al. 1992) and item nonresponse for questions on
income was particularly marked among older white respondents (9%) compared to
older black respondents (5%) (Peterson & Catania 1997).
Other respondent factors were also implicated in an interviewer-administered survey
of elderly respondents which found that item nonresponse was associated with
differences in engagement with the interview, interest in the topic, task-related
commitment and the respondents' cognitive and physical capacities (Couper & Rowe
1996).
Age and education are also among respondent characteristics related to item
responses in Natsal 1990 was associated with lower education, lower social class,
non-white ethnicity and difficulties with literacy or language but was not associated
with age, religion, marital status or gender. (Kupek 1998). Older age was, however,
associated with refusal to complete the most detailed sensitive questions in the
self-completion section, where ethnicity and comprehension problems were again
implicated (Copas et al. 1997). Those who did not respond to one of the
self-completion questions about lifetime sexual partners were likely to be older, of lower
social class and education and of Asian extraction (Kupek 1999). They were also
more likely to skip questions on STD clinic attendance and drug injecting.
Analysis of response to the nine self-completion sexual behaviour questions in the
US General Social Survey over three years, found that 5 of these questions had at
least 96% completion rates (Wiederman 1993). Although males were more likely
than females to respond to 3 out of the 4 remaining questions, item nonresponse for
both sexes was more common among older respondents, those on lower income and
those with lower educational attainment. No differences were found in relation to
religious affiliation or the size of the city where respondents lived but there was a
tendency for nonresponders to be less sexually experienced than responders.
Peterson and Catania (1997) found that the effect of increasing age on item
nonresponse to sexual questions in the National AIDS Behavioral Survey was more
pronounced for white than black respondents and, in contrast to Wiederman, females
were generally more likely to respond to sensitive questions. Ethnicity has also been
associated with questions about sexual orientation which were more likely to be
skipped by minority ethnic than white respondents (Gruskin et al. 2001).
The above studies indicate that older age, lower education, lower social class and
non-white ethnicity are likely to be associated with item nonresponse in the Internet
and HIV surveys. These studies are, however, of a descriptive nature and do not
address the processes that underlie these associations. An attempt by Bosnjak (2001)
to uncover the underlying process made little progress in the area. He tested whether
Ajzen's Theory of Planned Behaviour (1985 cited in Bosnjak 2001) could be applied
performing a particular behaviour depends on the individual's attitude towards doing
so, the social pressure to do so and their ability to do so. These three elements
impact upon the individual's intention to perform the behaviour which determines
whether or not they will actually perform it. It was found, however, that
self-reported measures of respondents' attitudes, social pressure and abilities did not
predict the number of answers that they gave to closed questions, although they had
limited predictive power for the number of open questions answered.
Work on the psychological aspects of response has also been undertaken by survey
methodologists Roger Tourangeau and Kenneth Rasinski who defined a four-step
cognition model of response to attitude questions (Tourangeau & Rasinski 1988). According to this model, the respondent first interprets the question, then seeks to
retrieve the necessary information, which is followed by a process of judgement and
finally reporting of the response. Tourangeau and Rasinski highlight the importance
of context effects which may be complex and difficult to predict.
As described earlier in this chapter, Beatty and Herrmann (2002) found that the
effects of item nonresponse had been well documented but that little work had been
done on the psychological underpinnings. They therefore devised a decision model
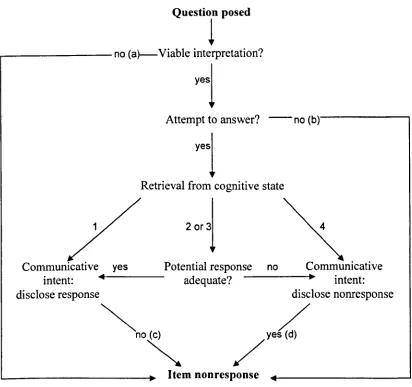
for item nonresponse (Figure 7.1 on the following page), which builds on the original
response model proposed by Tourangeau and Rasinski.
According to this model, item nonresponse is the likely outcome of the following
responses which occur at points (a) to (d) in the diagram:
(a) inadequate understanding or comprehension of the question;
(b) low motivation or effort;
(c) withholding available information even though it would meet the
objectives of the question;
(d) belief that item nonresponse is the more accurate response given the
Figure 7.1: Beatty and Herrmann's decision model of item non response
Question posed
1
,..-_ _ _ _ _ _ _ no (a)-Viable interpretation?
yesl
Attempt to answer? - -no ( b ) , - - - ,
Retrieval from cognitive state
Communicative yes Potential response no Communicative intent: ... - - - adequate? - - - . . intent:
disclose response disclose nonresponse
~
no (c)~
/
yes (d)
/
Item non response
Retrieving the information requested from the cognitive state is also an important
part of the process. Cognitive states are classified into the following four categories,
labelled 1 to 4 on the diagram, whereby the requested information is:
1 available and can be retrieved with minimal effort
2 accessible and can be retrieved with effort or prompts
3 generatable and not exactly known but may be estimated
When respondents were asked to rate their cognitive states with regard to particular
questions, the findings indicated that item nonresponse was associated with but not
completely determined by cognitive state. It was also found that respondents were generally willing to estimate unknown information but not to the point where such
estimations were clearly wild guesses.
Given the potential response burdens that the model implies, Beatty and Herrmann
argue that respondents may be taxed to a point where cooperation with further
requests for information is purely nominal. They argue that data quality varies along
a continuum and researchers need to decide on the minimum level of response
certainty that is acceptable to them.
The following uses Beatty and Herrmann's model as a framework for examining the
empirical evidence with regard to respondent influence on item nonresponse. As
previously described, this source of item nonresponse cannot be isolated from the
influence of interviewer, questionnaire or survey mode, which will necessarily be
included in the discussion. I will, however, return to the independent influence of
questionnaire design, the interviewer and the computerised versus pen-and-paper
mode later in this section.
7.1.3.1 Inadequate understanding or comprehension
Belson (1981) has shown a significant potential for respondents from all sectors of
the population to misunderstand survey questions and Beatty and Hermann suggest
that this may result in item nonresponse. Although the following provides evidence
that the understanding of questions of sexual behaviour may indeed be inadequate.
there is little to support a hypothesis that this results in item nonresponse.
In addition to the words and phrases used, the respondent's understanding of the
question is shaped by their impression of the purpose of the survey. the context of the
question and, where interviewer-administered. the interviewer's delivery
(Eisenhower et al. 1991). Understanding the terminology is clearly important,
be magnified for questions of sexual activity. This is not only because words used in
the vernacular often double as terms of abuse which may give offence in the research
setting but also because of the abundance of sexual terms - both formal and
colloquial- with which respondents may not be familiar (Wellings et al. 1994).
Although the majority of respondents (95%) reported that the terms "anal
intercourse" and "vaginal intercourse" were easily understood, one quarter of
respondents with the lowest level of education said that they had difficulty
understanding these terms (Binson & Catania 1998). This study also found that respondents who had difficulty with terminology may report "zero" when asked
about incidence of such activity and the authors concluded that the provision of a
response does not necessarily mean that the respondent understood the question.
Even where respondents are familiar with the terminology used, however, they may
not interpret such terms uniformly or in the way intended by the researcher. The
pilot work undertaken for Natsal 1990, revealed a number of differences in
interpretations of sexual terminology (Spencer et al. 1988). A minority of
respondents confused oral sex with vaginal sex because they understood the word
"oral" to mean "ordinary". A "sexual partner" might be considered too casual a
description of a marriage partner whereas it might be considered as relating to steady
partners rather than casual ones among the unmarried. The association of "partner"
with long-term relationships was also found in cognitive interviews undertaken by
Miller (2002).
Whereas heterosexual men and women are found to associate "having sex" with
penetrative vaginal sex, it may be used as a more general term for acts of sexual
arousal among gay men and lesbians (Spencer et al. 1988). Studies of young adults
have found that men are also more likely to have a broader interpretation of "sexual
intercourse", "sleeping with" (Jeannin ef al. 1998) or "having sex" (Pitts & Rahman
2001). Such differences between the sexes may contribute to the over-reporting and
under-reporting by males and females respectively of sexual activity that were
Some interesting findings emerged from Miller's (2002) study which used cognitive
interviews to explore respondent understanding of questions from a survey of sexual
behaviour. Although a definition of sex as vaginal, oral or anal was provided, it
failed to establish a consistent frame of reference for the following questions. Thus,
respondents had "preconceived narratives" about their first sex that were not based
on the definition. One of the gay male respondents exemplified the lack of
consistency in his thoughts on the question about number of lifetime sexual partners:
"I thought of everyone I had anal sex with first, and then I thought okay, well, there's anal sex and there's oral sex, throw that in there. So, I did remember in that question, but I didn't in the previous" (Miller 2002: 17).
Miller's cognitive interviews also revealed that when questions become more
conceptual, respondents may have additional difficulties. Thus, some respondents
were unable to fully articulate a conceptualisation of "sexual attraction" when asked
about this in relation to members of the same and opposite sex. She gives the
following example from one of her female respondents:
"If you like ... when you're around him, you know, ...
if
you liked somebody when you're around them. It's just something that you ... I forgot what they call it ... something that you get inside you. I forgot what they call it though" (Miller 2002: 42).The above findings tend to imply that respondents are generally able to interpret
carefully worded questions about sexual behaviour although they may apply their
own framework of interpretation.
An
examination of the effectiveness of standardsurvey pretest techniques however indicated that respondents were often confident
about their interpretation of the questions even when these interpretations were
mistaken (Oksenberg et al. 1991). It is therefore possible, indeed probable, that the Internet and HIV respondents did not interpret the questions in a unifonn manner but
the evidence indicates that it is unlikely that this was a major cause of item
7.1.3.2 Low motivation or effort
Beatty and Hermann's second cause of item nonresponse is low motivation or effort.
The effort that the respondent may give to answering the question may be best
understood in the context of the theory of satisficing (Krosnick 1991; Krosnick &
Alwin 1987). This theory proposes a continuum of responding with optimising at
one end, whereby respondents expend the necessary effort to provide an optimal
answer, and strong satisficing at the opposite end, whereby respondents expend such
little effort that their response may be arbitrary. In between are intermediate levels
of satisficing where instead of seeking to generate the optimal answer, respondents
may choose one that is merely satisfactory. The level of satisficing is believed to be
a function of task difficulty, respondent ability and respondent motivation. Thus, a
well-written introduction and interesting questions can motivate the respondent and
lead to improved data quality (Dillman 1978), whereas respondents with low
motivation may give less thoughtful answers or skip questions altogether (Catania et
al.1990).
Couper et af. (2004) agree that item nonresponse may be "the ultimate form of
satisficing" (Couper et al. 2004: 119) but believe it is likely to be rare in view of the
fact that those with extreme lack motivation would not have started the survey in the
first place. In support of this, Martin (1994) found that manipulation of respondent
motivation had only a minimal impact on item nonresponse. His study compared
response to thirty identical questions that were placed in two surveys that were of
high or low interest to respondents, with the high interest group providing marginally
but significantly more answers than the low interest group (29.7 vs 28.8 responses).
A financial motivation for completing the survey seems to have even less of an effect
on item nonresponse. An investigation of the effects of monetary incentives on
response to postal surveys found that once respondents had made the decision to
participate, they answered the same percentage of questions regardless of monetary
Compliance techniques may, however, impact differentially on data quality (Groves
& Couper 1998) and respondents motivated by more altruistic concerns may be less
likely to skip questions. Thus, item response in both open and closed questions was
related to perceptions of survey value as well as survey enjoyment (Rogelberg et al.
2001) and the presence of the researcher or appealing to altruism elicited lower levels
of item nonresponse than egotistic or no appeals in a self-completion survey
(Webster 1997). The most complete replies were also obtained in a postal survey
when the social utility of the study and university sponsorship were highlighted
(Houston & Nevin 1977).
Those who respond early to surveys or volunteer for them may do so because of a
greater motivation to participate. They are also likely to provide a more complete
response. Late respondents to a Danish postal survey of sexual behaviour were less
likely to provide such complete data as early respondents, although they were also
likely to be less educated (Biggar & Melbye 1992). Volunteers were less likely to
give incomplete responses than randomly selected respondents in a computer
network survey (5% vs 12%) although this may be confounded with a mode effect of
replying electronically instead of by post (Walsh et al. 1992). The HIV positive
participants who volunteered for an email survey about barebacking completed it
thoroughly with less than 1 % item nonresponse (Halkitis & Parsons 2003) and those
who volunteered for a web survey supplied most of the personal sociodemographic
information requested (Basi 1999).
An analysis of establishment questionnaires which are often completed out of duty,
found that just 5% of respondents answered all the questions, although 90% skipped
less than a quarter and only 1 % skipped more than one half (Tomaskovic-Devey et
al. 1995). By comparison, respondents who went to the trouble of manually logging
in to a web survey supplied income data that was 10% more complete than those who
were automatically connected to the survey (Heerwegh & Loosveldt 2002b).
Although the effects of motivation on item nonresponse do not appear to be large,
and HIV surveys are likely to provide reasonably complete data and that this may be
increased among those who respond early to the survey request and who are
motivated by more altruistic causes. Catania
et aZ.
(1993) have suggested thatrespondents who are at the highest risk for HIV transmission may be those who are
most highly motivated to respond and somewhat more complete data might also be
expected for this group.
7.1.3.3
Retrieval olin/ormation
Beatty and Herrmann (2002) found an association between cognitive state and item
nonresponse which supports the proposition that respondents may fail to provide an
answer if they are unable to retrieve an appropriate response. Thus, respondents'
retrieval processes were aided when questions about particular websites were
accompanied by the relevant logotypes, resulting in reduced item nonresponse (Lozar
Manfreda
et aZ.
2002a).Although factors relating to retrieval of information are most likely to be implicated
in response to non-threatening behavioural questions (Sudman & Bradburn 1974), questions of sexual behaviour are similarly subject to issues of memory. As with
other information, the recall of past sexual behaviour is likely to be influenced by the
length of the recall period, the vividness of the event, difficulty of recalling the event
and motivation to do so (Catania et
aZ.
1993). It is thereby subject to the malleability of memory (Croyle & Loftus 1993).More distant sexual events are more difficult to recall unless they have high personal
salience such as sexual milestones or negative experiences (Catania et
az.
1990).When experiences have high personal salience they are also perceived as having
occurred more recently and this may lead to erroneous inclusion of such events in
responses which specify particular reference periods. This is known as forward
telescoping (Sudman & Bradburn 1973) and it is also possible for backward
telescoping to occur if the event is perceived as having occurred longer ago than was
actually the case. More frequent acts, by comparison, are more difficult to retrieve.
one of these events decreases (Eisenhower et al. 1991). In the light of this,
respondents who have larger numbers of lifetime sexual partners are unable to
provide accurate responses when asked about them and report that they resort to
estimation (Miller 2002). Such estimation is evident in studies which have found
that reliability of reporting sexual behaviour decreases over longer recall periods and
with more frequent behaviours (Catania et al. 1993; Fenton et al. 2001).
When HIV positive gay men were asked about sexual activity in the past two weeks,
three months and twelve months, higher frequency of activity was reported over the
shorter periods than over the twelve-month period (Kauth et al. 1991). The greatest
consistency in reporting was for infrequent practices. Recall of sexual activities
among a group comprising mainly of sex workers was also more reliable for
infrequent practices such as receptive and insertive unprotected anal sex (0.95 and
0.98 respectively) and less reliable for more frequent practices such as masturbation
of the partner (0.35) (McLaws et al. 1990). When HIV negative gay men were asked
about sexual risk behaviour, their self-reported sexual behaviour was considered to
be moderately reliable in a test-retest study although questions relating to the
previous 5 years had the lowest reliability (Saltzman et al. 1987). The data also
indicated that reports were less likely to be reliable where respondents had greater
numbers of partners.
In Natsal 1990, item nonresponse on questions about dates when previous sexual
encounters took place and numbers of paid sexual partners was 8% and 10%
respectively (Wadworth et al. 1993). The authors conclude,
"it seems more likely that item non-response in self-completion was associated with difficulty of recall or completion of a fairly complex form rather than unwillingness to disclose sensitive information" (Wadsworth et al. 1993: 412).
A more detailed investigation of item nonresponse in Natsa11990, found that very
few of the questions with high nonresponse were those that were considered to be of
a more sensitive nature, whereas the highest levels ofnonresponse were found for
Similarly, questions in a postal survey that required more thought were found to
produce higher item nonresponse whereas the simpler questions used in respondent
classification had few omissions (Ferber 1966).
Age is the key variable associated with memory (Sudman & Bradburn 1973) and
respondents' abilities to perform the necessary information processing tasks required
to respond to more complex questions may also decline with increasing age. Thus,
as respondents got older they were more likely to provide incomplete data on
questions that required ranking, rating and behavioural reporting (Kaldenberg et al.
1994).
The above findings suggest that respondents are willing to estimate responses but
that item nonresponse may result if the task of recall becomes too burdensome. They
also indicate that respondents in the Internet and HIV surveys are more likely to skip
questions because of difficulties with recall rather than apparent sensitivity and that
this is likely to increase as the salience of the experience decreases, its frequency
increases and with increasing age. With this in mind, the following will examine the
extent to which the respondent's sense of privacy is implicated in item nonresponse.
7.1.3.4 Withholding available information
One of the judgements that a respondent makes when faced with a question is an
assessment of how their response might compare to a socially acceptable norm. In
the light of such judgement,
"sometimes the respondents' censorship will result in responses that are edited to provide socially acceptable answers, but in many cases respondents will cope
with sensitive questions by simply refusing to answer them" (Shoemaker et al. 2002: 194).
The issue, as discussed, is that of which questions are more or less sensitive to whom
and under what circumstances. The literature has therefore tended to concentrate on
how the question or survey mode may influence whether the respondent withholds
One of the circumstances that may influence a respondent's likelihood of divulging
information is that of privacy. Thus, a higher proportion of incomplete responses to
Natsal 1990 was associated with the presence of others at the interview and apparent
embarrassment (Kupek 1998) whereas telling respondents that their answers will
remain completely confidential has been found to produce lower item nonresponse
(Singer 1978).
A review of the experimental literature found that assurances of confidentiality
affected item nonresponse to sensitive questions but not to questions of a more
general nature (Singer et al. 1995) which indicates that there is an interaction
between question sensitivity and the respondent's sense of privacy. Ong and Weiss
(2000) suggest that a sensitive question is one for which a privacy manipulation
yields a difference in response proportions. They administered a range of sensitive
questions, including cheating at college work, to a student sample to examine the
difference in response where respondents were completely anonymous compared to
where confidentiality was assured. Respondents produced significantly more
socially desirable responses in the confidential condition. Thus, the respondents'
belief in their anonymity may be an important factor in divulging certain
information.
Ong and Weiss' study shows that confidentiality assurances may not be sufficient to
engender the optimal sense of privacy. Indeed, it has been shown that highlighting
the issue of confidentiality may raise respondent concerns. When more detailed
confidentiality assurances were given prior to survey administration, respondents
were both less likely to agree to participate and more likely to consider that the
survey would contain sensitive questions (Singer et al. 1992) and when a
confidentiality reminder was given during the process of an interviewer-administered
survey, it generated higher item nonresponse in the following questions (Frey 1986).
Care must therefore be taken be taken when forming confidentiality assurances.
Although computer mediated communication has been found to enhance
may continue to withhold certain information in a computer environment. Thus,
female students who completed online coital diaries generally provided complete
responses whereas a question which asked them to provide partner initials produced
more than 10% missing data (Baer et al. 2002). The issue of the extent to which use
of Internet enables respondents to provide more complete answers in surveys of
sexual behaviour will be examined below under mode influences on response, but the
evidence here indicates that respondents in both the web and pen-and-paper Internet
and HIV surveys are likely to provide more complete answers when they feel more
assured of their privacy.
7.1.3.5 Belie/in tlte adequacy o/response
There appears to be little literature exploring respondent belief in the adequacy of
response. This may be due to the apparently weak or negligible effect of such belief
on item nonresponse, as described below. As we saw earlier, respondents are
unlikely to doubt their interpretation of the questions (Oksenberg et al. 1991) and are
willing to estimate if they do not have an exact response in mind (Miller 2002).
One of the strategies that may be adopted in estimating frequencies of particular
behaviours is that of decomposing (Catania et al. 1990). Use of this strategy
involves estimation of the frequency of occurrence of the behaviour over a short
period of time followed by multiplication of this total to derive an estimation for the
required, longer period of time. Where response options are available, respondents
may also use these categories to help in their estimations, as described below under
questionnaire influences on response. Although respondents may engage in similar
inference strategies when attempting to recall sexual behaviours (Croyle & Loftus 1993), decomposing may be problematic where large numbers of sexual partners are
involved (Catania et al. 1990).
Even if such strategies are problematic, however, it seems that respondents actively
"when in doubt, the respondent prefers to give too much rather than too little information" (Sudman & Bradburn 1973: 806).
This desire to provide an answer may override any uncertainty about the adequacy of
the response even when it falls short of what the researcher intended. It therefore seems that, having reached this point in the response process, respondents aim to
provide an answer where at all possible. We can infer from this that the volunteers in
the Internet and HIV surveys are unlikely to intentionally skip a large proportion of
the questions.
7.1.4 Interviewer influences
Having considered the influence of the respondent on item nonresponse, we now tum
to an examination of interviewer influences. Although there is an extensive literature
on the differences between self-completion to interviewer administration, only a brief
summary of the relevant issues is provided here because both of the Internet and IIlV
surveys analysed here were self-administered.
Both telephone and face-to-face interviewer-administered surveys typically have less
item nonresponse than postal surveys (Dillman 1978). One of the most important
reasons for this is the role that the interviewer plays in effecting the administration of
the survey. He or she takes responsibility for reading the materials, following the
instructions and recording the answers, leaving the respondent free to concentrate on
the task of providing the answers. The issue of interviewer training is of key
importance in this respect (Groves 1989).
In the context of Beatty and Herrmann's framework, interviewers may help the
respondent who has problems with understanding or comprehension and they may
increase motivation through maintaining interest and giving positive feedback. They
may also encourage responses that may be otherwise deemed inadequate because of
the expectation of response that the personal interaction engenders. On the other
hand, the respondent may withhold or modify information to the extent that the
Given the extensive impact of the interviewer on data quality, it is important that he
or she has the appropriate skills to fulfil this role. Whereas good interviewers may
reduce item nonresponse through following instructions appropriately and recording
responses accurately, bad interviewers may fail to follow instructions and make
mistakes in recording responses. Good interviewers may tum "don't know"s into
substantive responses where appropriate, whereas bad interviewers may fail to probe
adequately (de Leeuw 2001). The impact of interviewer probing on response can be
seen in a comparison of responses to the American Nation Election Survey and the
General Social Survey. The higher level of "don't know" responses found in the
former was attributed to interviewer instructions to acknowledge where respondents
did not appear to have an opinion on the issue in question rather than pressing them
for an answer (Smith 1982).
It has generally been found that the presence of the interviewer is likely to increase socially desirable reporting. As it is likely to compromise the validity of the
response if the respondent is required to disclose personal information directly to an
interviewer, the only way to ensure against this is to use the self-completion mode.
Use of the self-completion mode may therefore represent a trade off between the
greater likelihood of reporting socially censured behaviours and the likely increase in
item nonresponse (Wadsworth et al. 1993).
The evidence with regard to the mode effect on item nonresponse in surveys of a
sensitive nature is mixed. de Leeuw's (1992 cited in de Leeuw 2001) meta-analysis
of data quality across survey modes indicated that the trend for interview surveys to
result in less item nonresponse than postal surveys was reversed for sensitive
questions where more item nonresponse was found in interviews. However, another
comparison of interviewer and self-completion modes found that item nonresponse
was never greater than 3% per respondent but the proportion of respondents
providing complete responses to questions about alcohol consumption was
significantly less in the self-completion mode (82% vs 93%) (Mangione et al. 1982).
In Natsal 1990, item nonresponse was no more than 2% for sensitive questions in the
self-completion booklet (Kupek 1998; Wadsworth et al. 1993). Although
interviewer training may be implicated where disparities have been found in item
nonresponse to sensitive questions, it should also be noted that the Natsal
self-completion questions were those of the most sensitive nature which may have
contributed to the higher level of nonresponse.
By comparison, the research clearly indicates that the presence of the interviewer
tends to reduce the candour of reporting in surveys of sexual behaviour. Gay men
were twice as likely to report unprotected anal sex with a non-primary partner when
surveyed by postal questionnaire as opposed to telephone (Acree et al. 1999). The
use of ACASI has been associated with reporting more HIV risk behaviour and less
protective behaviour than in the face-to-face mode (Des larlais et al. 1999; Macalino
et al. 2002) and T-ACASI was found to produce higher reports of a number of sexual
behaviours in comparison to interviewer administration by telephone (Turner et al.
1996). In Natsal 1990, the two most common inconsistencies were greater reporting
of multiple heterosexual partners and homosexual experiences in the self-completion
section compared to the face-to-face (Fenton et al. 2001). The self-administration
mode has also been associated with a reduction in the disparity between males and
females on the number of sex partners reported (Tourangeau & Smith 1996).
Another aspect of the respondent-interviewer relationship was highlighted in an
examination of response to open-ended questions. Although the mean number of
responses to open-ended questions did not diminish over the course of the survey
administration, the variance in the number of responses was found to increase
(Burchell & Marsh 1992). This was attributed to the "subtle process of negotiation,
compromise and accommodation between two individuals" (Burchell & Marsh 1992: 242) which occurs over the course of the survey interview and impacts differentially
on respondent verbosity.
7.1.5 Questionnaire influences
order and data checking on item nonresponse. Such features are likely to be
particularly pertinent to this comparison of web and pen-and-paper surveys given
that computer-assisted modes can reduce or eliminate routing errors, randomise
presentation of questions or response options and check data at the time of inputting
(de Leeuw et al. 1995). Before considering these influences, however, I will begin
with consideration of some of the more general impacts of the questionnaire on item
nonresponse.
As described earlier, under 7.1.3.1 Inadequate understanding or comprehension,
people may refer to their own conceptual framework in order to interpret the
meaning of the question. They also seek clarification in the clues provided by the
form and context of the question. In closed questions, therefore, the response options
provide respondents with significant information on how to respond. This is because
they are said to provide information about the underlying assumptions of the
question and reflect the researcher's understanding of the distribution of responses
(Schwarz & Hippler 1991). Respondents are thereby likely to use the categories
provided as a frame of reference with which to assess their own behaviour,
interpreting the middle alternative as representing that which is average or typical.
Thus, respondents reported fewer sex partners when response categories emphasised
the lower end of the distribution, an intermediate number in open questions and the
highest number where response categories emphasised the higher end of the
distribution (Tourangeau & Smith 1996).
It is possible that respondents may skip questions if the categories available do not
match their intended response, especially in self-completion surveys (Bradburn &
Sudman 1991). However, Schuman and Presser (1981) have argued that respondents
not only utilise the framework provided by the question in formulating responses to
attitude questions but they earnestly seek to work within it:
"Jfwe do not provide a particular substantive alternative to a closed question, people rarely give it. Jfwe omit a don't know category or a middle alternative, people ordinarily do not volunteer one ... Jor most questions people accept the
This supports the argument that respondents are unlikely to skip closed questions on
purpose and item nonresponse is likely to be low when respondents are not explicitly
[image:33.535.21.525.24.769.2]told that they can skip questions (Couper et al. 2004).
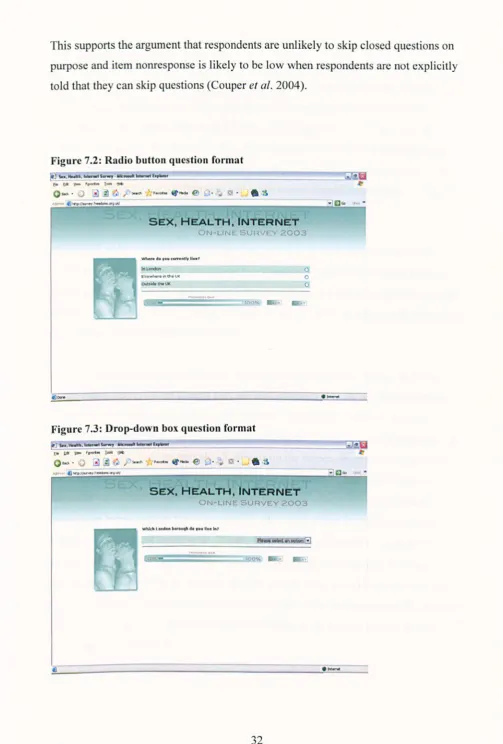
Figure 7.2: Radio button question format
SEX, HEALTH. INTERNET
01' LIN ~u .E.'t ,,>003
. . . -_ _ _ When d. 'tou~ntly lin?
In london
eluwner. if, the Uk
OUtside the UK
100%
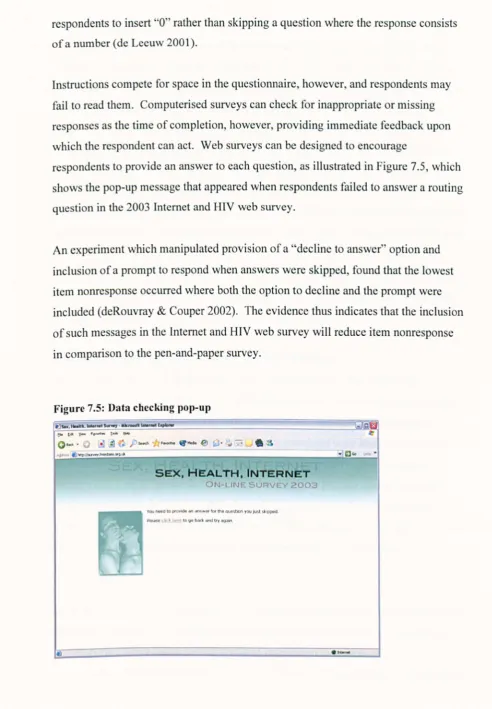
Figure 7.3: Drop-down box question format
o o
o
.
..
--
"
0""" ~~~---~vm~
"
.
SEX. HEALTH. INTERNET
ON-LINE. SU~VI:..Y 2003
-Schuman and Presser's position also indicates that respondents are less likely to
provide a "don't know" response ifit is not explicitly provided. As previously
discussed, a "don't know" response can be likened to item nonresponse (Groves
1989) and is often taken to be so in the analysis of item nonresponse. In order to
reduce this type ofnonresponse, de Leeuw (2001) suggests that a "don't know"
response should not be explicitly offered but respondents should be instructed that
they may skip questions in pen-and-paper surveys or use a particular key for "don't
know" in computer-assisted surveys and interviewers should be instructed to accept
"don't know" as a valid response.
Heerwegh and Loosveldt (2002a) examined whether the question format would
affect item nonresponse, by comparing two question formats that are used in web
surveys but are not technically possible in pen-and-paper surveys: radio buttons and
drop-down boxes (Figures 7.2 and 7.3 show examples of these question formats from
the Internet and HIV 2003 web survey).
As discussed earlier, respondents tend to work within the framework provided in
paper-based surveys even though they are not constrained to do so. Radio buttons
and drop-down boxes illustrate one of the constraints that the web survey may
introduce. Use of these formats forces the respondent to select a single response but
whereas the radio buttons provide all options on the screen, drop-down boxes hide
the response options until the respondent clicks into them. Thus, radio buttons
resemble paper-based input more closely with options openly presented whereas
drop-down boxes require the respondent to take some action in order to view the
response categories (Couper et al. 2004). Heerwegh and Loosveldt found that
neither format was associated with higher levels of item nonresponse, however,
providing further evidence that once they have started the survey, respondents are
likely to comply with the framework presented and again suggesting that the Internet
and HIV volunteers will tend to provide a response to each of the questions with
7.1.5.1 Question routing
One of the key influences of the questionnaire on item nonresponse is its capacity to
guide respondents through it and direct them to the questions that they need to
answer. The effect is especially notable where branching instructions are involved.
Thus, Redline et al. (2004) have shown that modifications in the design of
pen-and-paper questionnaires can reduce the likelihood that respondents will supply answers
to questions which they should have skipped (errors of commission) and skip
questions which they should have answered (errors of omission). Messmer and
Seymour (1982) also found that item nonresponse was significantly higher in the
questions immediately following branching instructions (4.38% vs 2.13%).
Dillman (1978) recommends the insertion of short, clear instructions in the
appropriate place to reduce the effects of branching nonresponse. Figure 7.4
illustrates acceptable and unacceptable ways of instructing respondents in a one-page
scrollable web survey in order to reduce item nonresponse where respondents do not
have any children of 15 and under living with them.
Figure 7.4: Unacceptable and acceptable survey instructions
Unacceptable:
30. Do you have any children age 15 and under that currently live with you?
o Yes
o No -If no, skip to question #42
Unacceptable:
30. Do you have any children age IS and under that currently live with you?
o Yes
o No -If no, click here to skip to question #42
A revision:
30. Do you have any children age 15 and under that currently live with you?
o Yes
o No -+ After clicking "No," CLICK HERE to skip to question #42
Although Dillman and Bowker (2001) argue that single-page web surveys like the
above produce the best results by echoing conventional questionnaire layout,
appropriate use of computerisation can automate progression through the
questionnaire, virtually eliminating the errors that occur when questions are
inadvertently missed and substantially decreasing the overall amount of item
nonresponse (de Leeuw 2001; Tourangeau et ai. 2000). Surveys with more complex
routing patterns are therefore likely to benefit from a page-by-page web survey
design which enables researchers to ask highly contingent questions without
confusing the respondent (Moon 1998). Such automatic skip and branch patterns
have a similar effect to that of the interviewer described earlier in taking the
responsibility away from the respondent. At the same time, self-completion has the
additional benefit of allowing the respondent to stay in control and determine the
pace of the completion (de Leeuw 2001).
The literature therefore suggests that the automatic routing of the Internet and HIV
web survey is likely to reduce item nonresponse in comparison to the pen-and-paper
survey.
7.1.5.2 Question order
Respondent motivation has been shown to have an impact on response behaviour and
it is possible that such motivation may subside over the course of the survey leading
to increased item nonresponse. For example, a lengthy survey conducted in the work
place resulted in fewer "not applicable" responses when questions were placed
towards the beginning of the questionnaire than when placed towards the end (Wang
& Fan 2004). Another study found that the position of the question within the survey accounted for 44% of the variance in item nonresponse (Dickinson & Kirzner 1985)
and a survey of elderly respondents found increased item nonresponse for later
questions but no correlation between age and item nonresponse (Vance et ai. 2003).
Less item nonresponse was found among demographic questions placed at the
beginning ofa pen-and-paper questionnaire (4.7%) compared to the end (7.2%)
was requested at the beginning of a web survey and 20.5% failed to do so if it was
requested at the end (Frick et al. 2001). Respondent willingness to provide personal
information at the beginning of the survey has been interpreted in terms of
reciprocity:
"One might assume a give-and-take model: Participants are more likely to
provide personal information if they are curious to see the experiment. After the experiment, when their curiosity has been satisfied, they are no longer willing to disclose the information" (Frick et al. 2001: 217).
In contrast to the above findings, the likelihood of answering a question did not
appear to be influenced by its position within the survey in Ferber's (1966)
investigation of item nonresponse to a postal survey.
The issue arises as to whether measurement error, including item nonresponse, is
reduced if question sensitivity is increased over the course of the survey, permitting
respondent desensitisation, or whether it is increased due to weakening of respondent
motivation towards the end of the survey (Catania et al. 1993). The two contrasting
hypotheses state that (i) rapport develops over the course of the interview leading respondents to perform better or (ii) fatigue sets in leading to declining performance
(Sudman & Bradburn 1973). In interviewer-administered surveys, respondents expressed a preference for beginning with more neutral questions leading to more
intimate questions when rapport had been established (Spencer et al. 1988).
Although it is not clear how modifying the question order will affect item
nonresponse in self-completion surveys of sexual behaviour, it is possible that
Internet and HIV respondents will skip more questions towards the end of the survey.
7.1.5.3 Data checking
Traditional pen-and-paper self-completion surveys rely on clear instructions in an
attempt to ensure that respondents complete the questions appropriately. The
importance of clear routing instructions has been shown to be important in reducing
respondents to insert "0" rather than skipping a question where the response consists
ofa number (de Leeuw 2001).
Instructions compete for space in the questionnaire, however, and respondents may
fail to read them. Computerised surveys can check for inappropriate or missing
responses as the time of completion, however, providing immediate feedback upon
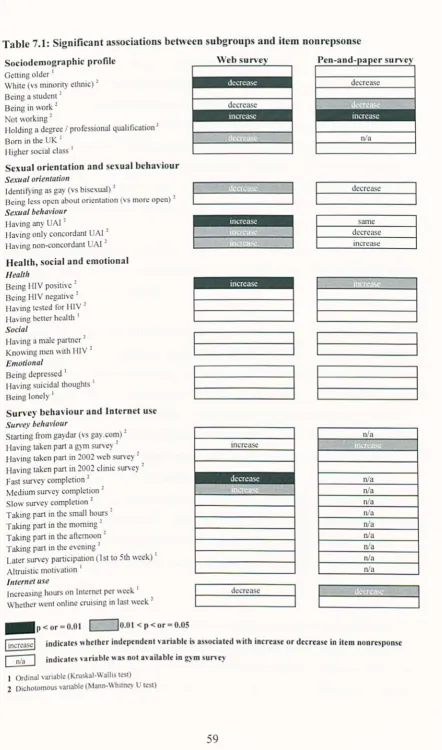
which the respondent can act. Web surveys can be designed to encourage
respondents to provide an answer to each question, as illustrated in Figure 7.5, which
shows the pop-up message that appeared when respondents failed to answer a routing
question in the 2003 Internet and HIV web survey.
An experiment which manipulated provision of a "decline to answer" option and
inclusion of a prompt to respond when answers were skipped, found that the lowest
item nonresponse occurred where both the option to decline and the prompt were
included (deRouvray & Couper 2002). The evidence thus indicates that the inclusion
of such messages in the Internet and HIV web survey will reduce item nonresponse
in comparison to the pen-and-paper survey.
Figure 7.5: Data checking pop-up
o-.~·-=~~~~
__
~____________________ __
SEX, HEALTH, INTERNET
ON I E':;U v 20
, . . . - _ _ _ You need to provide an ans ... Qf for the QU8sbon you JUSt fJelpped.
Please ~ Ill" I,f'''' to go bad: and try aQ<l1l"l
[image:38.535.24.517.46.756.2]