M. M. Hatlo, R. A. Curtis, and L. Lue
Citation: J. Chem. Phys. 128, 164717 (2008); doi: 10.1063/1.2908738
View online: http://dx.doi.org/10.1063/1.2908738
View Table of Contents: http://jcp.aip.org/resource/1/JCPSA6/v128/i16
Published by the American Institute of Physics.
Additional information on J. Chem. Phys.
Journal Homepage: http://jcp.aip.org/
Journal Information: http://jcp.aip.org/about/about_the_journal
Top downloads: http://jcp.aip.org/features/most_downloaded
Electrostatic depletion forces between planar surfaces
M. M. Hatlo,a兲 R. A. Curtis, and L. Lueb兲
School of Chemical Engineering and Analytical Science, The University of Manchester, P.O. Box 88, Sackville Street, Manchester M60 1QD, United Kingdom
共Received 9 January 2007; accepted 17 March 2008; published online 29 April 2008兲
The interaction between two dielectric plates immersed in an electrolyte solution is examined by using a variational perturbation approximation for the grand partition function. This approach differs from previous treatments in that the screening length between the plates is treated as a variational parameter. A key finding is that adjacent to each plate is a layer of ion depletion with thickness given by about one-half of a Bjerrum length. Consequently, for plate-plate separations less than the Bjerrum length, nearly all the electrolyte is excluded from between the plates, and the interaction is given by the sum of a van der Waals interaction and an attractive osmotic depletion force. In contrast to the predictions of previous theories, the interaction between the plates at short range increases with increasing electrolyte concentration and may provide an important contribution to the salt-induced attraction, commonly referred to as salting out. Because the range of the osmotic depletion force is roughly equal to the Bjerrum length, it increases with the square of the valency of the electrolyte. At larger plate-plate separations, the van der Waals interaction is screened as electrolyte enters the space between the plates, leading to an exponential decay of the interactions, as has been previously observed. However, this interaction is slightly stronger than that previously predicted, due to ion depletion from the surface of the interface, also this effect increases with increasing electrolyte concentration. ©2008 American Institute of Physics.
关DOI:10.1063/1.2908738兴
I. INTRODUCTION
Understanding the interactions between macromolecular structures in aqueous electrolyte solutions is of great impor-tance in biology and colloid science, with applications to, among others, membrane biology, protein interactions, elec-trochemistry, and polymers. Our current intuition about these systems is mainly based on the traditional Poisson– Boltzmann equation combined with a van der Waals interac-tion关Derjaguin–Landau–Verwey–Overbeek共DLVO兲theory兴. However, DLVO theory suffers from many inadequacies, and improvements have incorporated effects of ion size and ion-dependent dispersion interactions,1 ion-ion correlations,2,3 variations in surface charge density, and the effect of salt on the zero-frequency van der Waals interaction.4–6In many in-stances, DLVO theory either overpredicts the repulsion 共or underestimates the attraction兲 between surfaces. A good ex-ample is given by the observed electrostatic attraction be-tween similarly charged surfaces in solutions containing di-valent ions, an effect which has been rationalized by considering correlations in ion distributions.2,3,7 However, other questions remain unsolved such as determining the mo-lecular origin of the salt-enhanced attraction between sur-faces in moderately concentrated electrolyte solutions,8often referred to as salting out.
One possible mechanism for electrostatic enhanced at-traction between surfaces is due to depletion forces. This idea can be traced back to Asakura and Osawa,9who showed
that an effective attraction between colloids is induced by the addition of polymers to the solution. The attraction arises from the depletion of the polymers from between the colloids due to excluded volume forces. The effect of excluded vol-ume forces on ion distributions about surfaces leads to a depletion layer due to the finite ion size.10 More significant ion depletion can occur for other reasons, such as repulsive image forces which arise between ions and low dielectric boundaries. Wagner11 and Onsager and Samaras12 demon-strated that the image-force induced exclusion of ions from an air-water interface was the molecular origin for the posi-tive surface tension increment of salt solutions. In the ab-sence of a dielectric boundary共i.e., where the surfaces have the same dielectric constant as the solution兲, ions will be excluded from around surfaces due to a solvation effect where the ions prefer to be in a fully screened environment far from the surface.13,14 The effects of ion depletion on surface-surface interactions have been shown to lead to en-hanced attraction in some cases.10,15 More specifically, within the primitive model, image forces enhance the effects of ion-ion correlations and can lead to either enhanced attrac-tion or repulsion over the predicattrac-tions of mean field theories.16–19
In this work, we attempt to elucidate the salt-induced interactions between colloidal particles by examining the in-teraction between two, uncharged semi-infinite dielectric plates. These plates are immersed in an electrolyte solution of point ions with charge⫾qcontained in a continuum sol-vent of dielectric constant⑀. The confined solution is in equi-librium with a bulk reservoir. The force between the plates is determined by using a variational field theoretic approach a兲Electronic mail: [email protected].
b兲Electronic mail: [email protected].
which has been previously used to study electrolytes near planar and spherical dielectric interfaces as well as the forces between these interfaces.6,13 Ion-ion correlation effects, im-age forces, and the zero-frequency van der Waals interaction by the ions4are all self-consistently included in the model. Here, the theory differs from previous field theoretic approaches,6,13in that the screening effectiveness of the con-fined electrolyte solution is taken as a variational parameter and, consequently, is not the same as that in the bulk reser-voir and varies with plate separation. A significant result is that an ion-depletion layer with thickness of about one-half to one Bjerrum length is adjacent to each plate. The reduced electrolyte concentration between the plates leads to a short-ranged force with a range of one Bjerrum length and with a magnitude proportional to the osmotic pressure of the bulk solution.
The paper is organized as follows. In Sec. II, the basic theory behind the variational approach is reviewed. In Sec. III, this theory is applied to study the properties of electro-lytes next to a single dielectric interface. The mechanisms for the formation of the electrolyte depletion layer are examined, as well as the dependence of its properties on the electrolyte concentration, and the dielectric constant of the interface and its influence on the surface tension. In Sec. IV, we examine the forces between two dielectric plates that are immersed in an electrolyte solution. In this case, the properties of the depletion layers depend on the spacing between the plates. These properties, in turn, affect the forces between the plates. The implications of this study on the salting-out effect are discussed. Finally, the main findings of this work are sum-marized in Sec. V.
II. THEORY
In this work, we consider a system of ions immersed in a continuum solvent with dielectric constant⑀. The absolute temperature of the system isT, and the chemical potential of ion species␣ is ␥␣ 共in units ofkBT, where kB is the
Boltz-mann constant兲. In addition, there is a spatially varying di-electric⑀共r兲through the system due to the possible presence of dielectric bodies. This inhomogeneous dielectric constant gives rise to zero-frequency dispersion interactions between the dielectric bodies.4,6 By the use of the Hubbard– Stratonovich transformation,20,21the grand partition function ZG for this system can be expressed as a functional
integral,14,22–24
ZG关␥兴=
1
N0
冕
D共·兲⫻exp
再
− 12
冕
drdr⬘
共r兲G0−1共r,r
⬘
兲共r⬘
兲+ lnZGref关␥−qi+ese兴+ ln
N0
Nfree
冎
, 共1兲 where=共kBT兲−1,ZGref
is the grand partition function of the reference system共i.e., the system without electrostatic inter-actions兲, G0 is the Green’s function of the electrostatics problem,25
− 1
4ⵜ ·⑀共r兲ⵜG0共r,r
⬘
兲=␦d共
r−r
⬘
兲, 共2兲Gfree is the Green’s function in the absence of spatial varia-tions of the dielectric constant 共i.e.,⑀is a constant兲,
Gfree共r,r
⬘
兲= 1⑀兩r−r
⬘
兩, 共3兲and
Nfree=
冕
D共·兲⫻exp
冋
− 12
冕
drdr⬘
共r兲Gfree−1共r,r
⬘
兲共r⬘
兲册
.The quantitye␣serepresents the self-energy of an ion, which is the direct interaction of the ion with the field generated by its own charge, and is given by
e␣se=q␣ 2
2Gfree共r,r兲.
The term lnN0/Nfree represents the zero-frequency disper-sion interaction caused by an inhomogeneous dielectric.4,6
The expression forZGgiven in Eq.共1兲is formally exact.
Physically, it states that the grand partition function of a system with electrostatic interactions is equal to the grand partition function of a system without electrostatic interac-tions in the presence of a fluctuating external field. This ex-ternal field varies according to a Gaussian distribution, with a spatial correlation given byG0共r,r
⬘
兲. Unfortunately, it is not possible to analytically evaluate the functional integral for any except the simplest systems. However, a number of different approximation methods can be used. One such method is the loop expansion, which has recently been ap-plied to several problems involving electrolyte solutions at interfaces.6,26,27In the present work, the partition function is approxi-mated by using the variational method,28,29 an approach which has previously been successfully applied to a wide variety of electrolyte problems.14,24,30,31 In this method, av-erages are taken with respect to the Gaussian Hamiltonian,
HK关兴= − 1
2
冕
drdr⬘
关i共r兲−i ¯共r兲兴GK
−1共r,r
⬘
兲⫻关i共r
⬘
兲−i¯共r⬘
兲兴.The functioni¯共r兲represents the mean value of the electric potential in the system. The Green’s functionGKcontrols the strength of the fluctuations of the electric potential and is given by
GK−1共r,r
⬘
兲=G0−1共r,r⬘
兲+K共r,r⬘
兲,GK共r,r兲=GKbulk共r,r兲+␦GK共r,r兲, 共4兲
where the second term is directly related to the potential of mean force between the ions and the dielectric bodies. Within the first order variational approximation, the grand partition function is
lnZG关␥兴艌
1
2
冕
drdr⬘
i ¯共r兲G0 −1共
r,r
⬘
兲i¯共r⬘
兲−1 2
冕
01
dTrK共GK−GK兲+ ln N0 Nfree
+具lnZG
ref关␥
−qi−qi¯ +ese兴典K, 共5兲
where the averages具¯典Kare defined as 具共¯兲典K=
1
NK
冕
D共·兲共¯兲e−HK关兴, NK=冕
D共·兲e−HK关兴,and
N0=
冕
D共·兲exp冋
− 12
冕
drdr⬘
共r兲G0 −1共r,r
⬘
兲共r⬘
兲册
.This approximation provides a rigorous lower bound to the grand partition function so that the exact value of the grand partition function must be greater than the approximate value calculated by using Eq.共5兲.
The approximated partition function depends on the form of the arbitrary functions ¯ andK, whereas the exact grand partition function must be independent of these choices. The idea of the variational method is to make some approximation to the grand partition function and to choose the functions¯ andK such that the conditions
␦ ␦i¯共r兲
lnZG关␥兴= 0, 共6兲
␦
␦K共r,r
⬘
兲lnZG关␥兴= 0, 共7兲are satisfied.
For a system of point charges, the only forces between the ions are due to electrostatic interactions. In the absence of these interactions, the system behaves as an ideal gas. Therefore, the partition function of the reference system is
ZG
ref关␥兴 =
兺
␣ ⌳␣
d
冕
dre␥␣共r兲
, 共8兲
where⌳␣ is the thermal wavelength and␥␣ is the chemical potential of an ion of type␣. The density of the ions in the system is given by the relation
⫾共r兲=␦
lnZG关␥兴
␦␥⫾共r兲
. 共9兲
Applying Eq.共6兲to the approximation for lnZGgiven in Eq. 共5兲yields
− 1
4ⵜ关⑀共r兲ⵜi
¯共r兲兴=
兺
␣ q␣␣共r兲, 共10兲
which is the Poisson equation. Solving Eq.共7兲gives an ex-pression for the screening function,
K共r,r
⬘
兲=␦共r,r⬘
兲兺
␣q␣2␣共r兲, 共11兲
where the spatially varying density␣共r兲of ion species␣is given by
␣共r兲=␣bulkexp
冋
− q␣22 ␦GK共r,r兲−q␣i
¯共r兲
册
. 共12兲In the general case, this result gives two coupled equations to solve forK共r,r
⬘
兲andi¯共r兲. The electrostatic potentiali¯共r兲 will be nonzero if there are preferential ion-surface interac-tions, as occur for systems with asymmetric electrolytes or ion-specific forces. In the following sections, we restrict the analysis to symmetric electrolytes, in which case Eq. 共12兲yieldsi¯共r兲= 0.
III. SINGLE-PLATE GEOMETRY
In this section, we consider a system with a single planar interface separating two regions. The first region contains electrolytes immersed in a solvent of uniform dielectric con-stant ⑀. The second region consists of a dielectric body 共of uniform dielectric constant ⑀
⬘
兲 which excludes the electro-lytes. The electrolyte solution is in equilibrium with a bulk reservoir, in which the number density of ions of type␣ is␣bulk. This system could represent an interface formed be-tween a salt solution and a solid substrate or a bulk vapor phase.
A. Uniform screening
The simplest form for the screening function is given by
K共r,r
⬘
兲=␦共r,r⬘
兲 ⑀ 4再
2 inside electrolyte 0 inside dielectric body.
冎
共13兲
The screening function vanishes inside the dielectric body due to the absence of electrolytes in this region. Outside the dielectric body, the screening is assumed to be uniform, and the strength of the screening is used as a variational param-eter to be found by maximizing the grand partition function, i.e.,
lnZG
= 0. 共14兲
The Green’s function corresponding to the screening function given by Eq. 共13兲 can be determined analytically and is given by32
GK共r,r
⬘
兲= e −兩r−r⬘兩⑀兩r−r
⬘
兩+␦GK共r,r⬘
兲, 共15兲where
␦GK共r,r
⬘
兲= −2⑀
冕
p⌬共p;,兲
共p2+2兲1/2
⫻e−共p2+2兲1/2共z+z⬘兲e−ipx共x−x⬘兲−ipy共y−y⬘兲, 共16兲 where z is the distance from the dielectric interface, and ⌬共p;,兲is given by
⌬共p;,兲=p−共
2+p2兲1/2
p+共2+p2兲1/2, 共17兲
in which=⑀⬘/⑀is the dielectric constant ratio.
The first term of Eq. 共15兲is the Green’s function for a bulk electrolyte, while the second term on the left side ac-counts for the influence of the dielectric interface. The quan-tity␦GK共r,r兲is equal to the potential of mean force between an ion of unit charge located at positionrand the dielectric interface,
␦GK共r,r兲= −1
⑀
冕
0 ⬁dpp⌬共p;,兲
共p2+2兲1/2e
−2共p2+2兲1/2z
= −
冉
− 1+ 1
冊
e−2z2⑀z
− 2
+ 1
⑀
冕
1⬁ dx
冑x
2− 1 −x
冑x
2− 1 +xe −2xz. 共18兲
The first term on the right side of Eq.共18兲gives the screened interaction energy between a charge and its own image. This term is attractive when ⬎1, as occurs in the case of an electrolyte-metal interface, or repulsive for ⬍1, which is the case for the electrolyte-air interface or electrolyte-colloid interface. The second term results from the exclusion of ions about the dielectric body and always gives a repulsive con-tribution to the potential of mean force. This repulsion arises from the fact that ions prefer to be surrounded by other ions
to screen their own charge and, consequently, lower the en-ergy of the system. The charge of an ion located near the interface is less completely screened relative to that of an ion in the bulk solution due to the presence of the electrolyte-free body. Consequently, ions are repelled from the interface. We refer to this phenomenon as the solvation effect.
Because we are using a point particle model 关see Eq.
共8兲兴, excluded volume effects are not included, and the theory as such is only valid for low packing fractions. When the packing fraction of the ions becomes significant, ions feel an effective attraction toward the wall, an effect that may dominate the solvation force discussed above. Monte Carlo simulation studies show that excluded volume effects start to dominate the electrostatic solvation effect at concentrations above about 1.0M. Simulations at 0.1 共Ref. 33兲 and 0.5M
共Ref. 34兲 show ion depletion, while simulations at 1.0M show a slight absorption of the ions,33 for = 1.0 共i.e., no mismatch in the dielectric constants兲. Thus, the point ion treatment is expected to qualitatively describe the behavior of ions at interfaces for systems with ion concentrations be-low 1M. What is more interesting is the case when ⬇0; there, the ions are found to be depleted even for ion concen-trations up to 2.0M,34 indicating that the electrostatic inter-actions are the most important factor determining the density profile of the ions. However, at such high densities, the electrostatic interactions are strongly affected by the hard core, and a simple point ion treatment is expected to be insufficient.
The grand partition function is given by
lnZG=V
冋
−3
24+
兺
␣ ␣ bulk册
+A 2⌬¯
32
+
兺
␣ ␣bulk
冕
dz关e−共q␣2/2兲␦GK共z,z兲− 1兴+ ln N0 Nfree,
[image:5.612.333.539.47.199.2]where ⌬¯=共− 1兲/共+ 1兲 andA is the area of the interface. By applying the variational condition for关see Eq.共14兲兴, we find that=bulk, wherebulk2 = 4兺␣␣bulkq␣2/⑀, as expected. The corresponding density profiles are shown as thin lines in Fig. 1. Within this approach, the ions are desorbed from the dielectric interface when ⬍1. This depletion of
FIG. 1. The density as a function of position for= 0 and共i兲bulklB= 1.5
共solid line兲 and 共ii兲 bulklB= 0.5 共dotted line兲 The thin lines are for 1
ions near the dielectric interface is predominantly driven by repulsive image charge forces but also occurs as a result of the solvation effect. The latter effect is the cause of electro-lyte exclusion from an interface separating regions of the same dielectric constant.
The excess surface tension is given by the difference between the grand partition function of the confined system and that of a bulk system with the same, temperature, and volume. That is,
= − 1
A关lnZG− lnZG
bulk兴. 共19兲
The resulting expression for the excess surface tensionis
= −bulk 2 ⌬¯
32 −
兺
␣ ␣ bulk冕
0 ⬁
dz关e−共q␣2/2兲␦GK共z,z兲
− 1兴
− ln N0
Nfree. 共20兲
This expression was previously obtained by Curtis and Lue14 and is similar to the expression obtained by Wagner11and by Onsager and Samaras.12 The first term on the right side of Eq. 共20兲 is due to electrostatic fluctuation effects, whereas the second term is linked to the interfacial electrolyte density profile, in which depletion of ions gives a positive contribu-tion to the surface tension. We are primarily interested in the change in surface tension due to the addition of ions, which implies that the last term can be neglected as it contributes only to the surface tension of the pure water-air interface. The predictions of Eq.共20兲for the excess surface tension are plotted as thin lines in Fig.2. The surface tension increases with decreasing values of due to the enhancement of re-pulsive image forces leading to greater electrolyte depletion.
B. Incorporation of a depletion layer
The results of the previous section indicate that for ⬍1, there is a depletion of ions near an interface due to a combination of image forces and the solvation effect. How-ever, because of the simplistic choice of the form of the screening function关see Eq. 共13兲兴, this variation of ion
den-sity near the interface is not reflected by the screening pa-rameter, which is a constant in this region. By allowing the screening parameter to vary, a better approximation to the partition function can be obtained. In the following ap-proach, we use a screening function of the form
K共r,r
⬘
兲=␦共r,r⬘
兲 ⑀ 4冦
0, inside dielectric body
12, 0⬍z⬍h
22, h⬍z,
冧
共21兲
where h is the thickness of the depletion layer, 1 is the inverse screening length inside the depletion layer, and2is the inverse screening length outside the depletion layer. As before, the variational parameters 共i.e., h, 1, and 2兲 are obtained by maximizing the grand partition function. Dean and Horgan13have used a similar approach in which1is set to 0 over a region next to a planar interface, the thickness of which is chosen to reflect the finite ion size. This approach differs from the one given here in that the values ofhand1 are treated as variational parameters and, consequently, the parameters will reflect the ion exclusion which is predomi-nantly driven by image forces. In this case, the widthhof the depletion layer is mainly dependent on the Bjerrum length lB=q␣2/⑀, which represents the distance at which two free
共in absence of other ions兲ions interact with an energy equal to kBT. Further, the differences between these approaches
will be enhanced for systems with multivalent ions, in which case, the values of lB are larger.
For the screening function given by Eq.共21兲, the corre-sponding Green’s function, for 0⬍z⬍h, is
␦GK,1共z,z兲= − 2
⑀
冕
p⫻⌬32e−2
K1共h−z兲+⌬12e−2zK1− 2⌬12⌬32e−2hK1
K1共1 −⌬12⌬32e−2hK1兲 ,
共22兲
[image:6.612.313.559.48.231.2]where
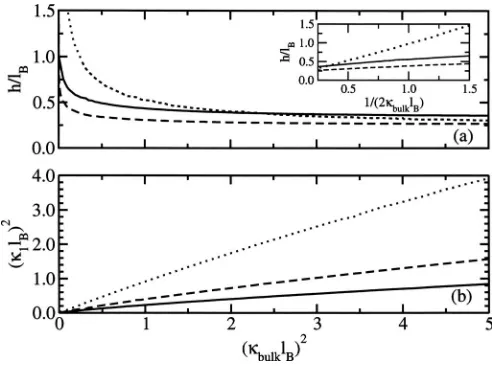
FIG. 3. The variation of the共a兲thicknesshand共b兲inverse screening length
1of the depletion layer with the reduced electrolyte concentration共bulklB兲2
for共i兲= 0共solid line兲,共ii兲= 0.5共dashed line兲, and共iii兲= 1共dotted line兲. The inset is for the case where= 1.0.
FIG. 2. The surface tension as predicted by the variational theory:共i兲 = 0.0共solid line兲,共ii兲= 0.5共dashed line兲, and共iii兲= 1.0共dotted line兲. The thin lines give the result when1=bulk, and the thick lines are from the full
[image:6.612.69.280.49.198.2]⌬12=p−
冑
1 2+p2
p+
冑
12+p2, ⌬32=冑
22+p2−
冑
1 2+p2冑
2 2+p2+
冑
12+p2,andKi=
冑
p2+i2. Forz⬎h, the Green’s function is given by␦GK,2共z,z兲= − 2
⑀
冕
pe−2K2共z−h兲 ⌬32−⌬12e −2hK1
K2共1 −⌬12⌬32e−2hK1兲
. 共23兲
The full expression for the surface tension when including a depletion layer is
=h1 3−
2 3
24 +
22 8
冕
01 d
冕
0 ⬁
dpp
冋
⌬32共p;,冑
2,冑
1兲共p2+22兲 −
⌬32共p;,1,2兲
共p2+22兲
册
−12 8
冕
01 d
冕
0 ⬁
dpp
冋
⌬32共p;,冑
1,冑
2兲共p2+12兲
−⌬32共p;,1,2兲
共p2+12兲
册
−12 32
− 1
+ 1+ 1 4
冕
0⬁
dp pln关1 −⌬12⌬32e−2h
冑
p2+1 2兴
+ 1 2
16
冕
0 ⬁dppe
−2h
冑
p2+12冑
p2+12共p2+12兲−1/2共⌬12+⌬32兲共⌬12⌬32− 1兲− 4h⌬12⌬32 1 −⌬12⌬32e−2h
冑
p2+12
− 2 2
16
冕
0 ⬁dpp e
−2h
冑
p2+12⌬12共⌬ 32 2− 1兲
共p2+22兲共1 −⌬12⌬32e−2h
冑
p2+1 2兲− bulk2
4
再
冕
0h
dz关e共q␣2/2兲共1−bulk兲−共q␣2/2兲␦GK,1− 1兴
+
冕
h
⬁
dz关e共q␣2/2兲共2−bulk兲−共q␣2/2兲␦GK,2
− 1兴
冎
. 共24兲The first term in Eq.共24兲represents the change in the bulk electrostatic term due to the variation in ion density, while the next four terms give the fluctuation contribution to the free energy of formation of the interface. The next two terms originate from the change in self-energy of the ions due to the presence of the interface. The final term gives the entropic contribution due to changes in ion density near the interface.
As mentioned earlier, the values of the parametersh,1, and2need to be determined to evaluate the thermodynamic properties. The value of the inverse screening length2 out-side the depletion layer is set to that of the bulk electrolyte
共i.e.,2=bulk兲as found in Sec. III A. The values of1andh are numerically found by maximizing the grand partition function. In Fig.3, the variation of the size of the depletion layer and the screening within the depletion layer with elec-trolyte concentration is presented. For dilute elecelec-trolyte so-lutions, the thickness of the depletion layer h rapidly de-creases with increasing electrolyte concentration up to a concentration corresponding to bulklB= 1. For moderately
concentrated electrolyte solutions, h remains relatively con-stant and approximately equal to 0.3lB. Thus, we find a
cross-over region nearbulk=lB, below which the depletion layer is
linked to the bulk screening length, and above which, h is independent of electrolyte concentration and is relatively in-sensitive to the value of.
In contrast, as shown in Fig. 3共b兲, the value of 1 de-creases with decreasing values of, indicating a concomitant decrease in the screening effectiveness. This effect is linked
to the larger electrolyte exclusion arising from the enhanced repulsive image forces. For the case where= 0, the screen-ing effectiveness next to the surface is about 0.2 times the corresponding bulk value, whereas for the case where= 1,
1is only slightly less thanbulk.
In the case where there is no dielectric interface 共i.e.,
= 1兲, the size of the depletion layer is only dependent on the bulk screening length and is well approximated by h
⬇共2bulk兲−1, as can be seen from the inset of Fig.3共a兲. In this case, depletion is mainly driven by the solvation effect and, therefore, one might expect that the width of the depletion layer is of the size of the screening length.
In Fig.1, the ion density profile is plotted as thick lines for different values of the bulk concentration. We see that the inclusion of the depletion layer induces more depletion of the electrolyte in the vicinity of the plate. This enhanced exclu-sion is induced by the extended range of the image charge and solvation forces caused by a discontinuity in the screen-ing ability.
By including the depletion layer with an associated re-duced screening, several additional terms appear in the ex-pression for the surface tension. These extra terms are due to electrostatic fluctuation effects associated with the depletion layer. Figure2shows the surface tension as predicted by Eq.
共24兲. The result of the full variational theory gives a lower surface tension as compared to Eq.共20兲. This extra negative contribution can be mainly attributed to the first term in Eq.
density near the plates. As a result of the variational principle, the surface tension predicted by this theory gives an upper bound to the actual surface tension of a point charge electrolyte.
C. Comparison with simulation
To quantitatively validate the theory developed in this section, we compare predictions with recent Monte Carlo simulations by Hendersonet al.34of an electric double layer near an uncharged electrode. In this simulation, the ions are modeled as charged hard spheres confined to a region z⬎␦ with constant dielectric coefficient⑀3. For 0⬍z⬍␦, there is an ion free layer of dielectric constant ⑀2; this layer is com-monly known as a Helmholtz or Stern layer and accounts for exclusion of ions from the surface due to effects not directly included in the theory, normally related to the solvent or specific properties of the surface. The electrode is located in the regionz⬍0 and has a dielectric constant⑀1. The size of the depletion layer共Stern layer兲is for simplicity taken to be the same as the ion diametera共i.e.,␦=a兲; consequently, the distance of closest approach of an ion center to the electrode is 3a/2. The theory developed in the previous sections can be extended to include a third dielectric layer that is inacces-sible to electrolytes. The only change in the theory is to let
⌬32=
冑
22+p2−⬘p
冑
2 2+p2+⬘p,
where⬘=⑀2/⑀3. Since the ions are excluded from the deple-tion region,1= 0.
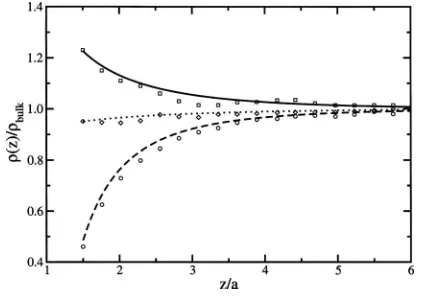
In Fig.4, the ion density profiles predicted by this work are compared to the simulation results of Hendersonet al.,34 for a bulk electrolyte concentration of bulk= 0.05M; corre-sponding to a bulk screening bulklB= 0.52. The theoretical
results are in good agreement with the Monte Carlo simula-tions. Better agreement could be obtained if a more sophis-ticated form for the screening function was used.
IV. TWO-PLATE GEOMETRY
In this section, we examine an electrolyte solution of dielectric constant ⑀ that is confined between two semi-infinite plates separated by a distance dfrom each other. As before, the plates have a dielectric constant⑀⬘and occupy a region which is inaccessible to electrolytes. The confined electrolyte solution is considered to be in equilibrium with a bulk electrolyte solution at ion concentration ␣bulk.
To account for regions of ion exclusion near the inter-faces, we use a screening function of the form
K共r,r
⬘
兲=␦共r,r⬘
兲 ⑀ 4冦
0, inside dielectric body
12, 0⬍z⬍h
2 2
, h⬍z⬍d−h
12, d−h⬍z⬍d.
冧
The difference between the Green’s function corresponding to the confined electrolyte and that of the bulk electrolyte,␦GK, is given by
␦GK共z,z兲= −2
⑀
冕
p⌰共h−z兲
⫻⌬12⌬3e−2
K2z
+⌬4e−2K2共h−z兲− 2⌬4⌬12e−2hK2 ⌬3−⌬4⌬12e−2hK2
+⌰共z−h兲⌰共d−h−z兲⌬1⌬2e −2K3共z−h兲
+⌬1⌬2e−2K3共d−h−z兲− 2⌬ 1
2e−2共d−2h兲K3
⌬2 2
[image:8.612.333.540.46.198.2]−⌬12e−2共d−2h兲K3
FIG. 4. Comparison between this work共lines兲and simulation data by Hend-ersonet al.共Ref.34兲 共symbols兲. Note thatlB/h= 2.32 and1= 0.共i兲⑀1=⬁,
⑀2= 80, and⑀3= 80共solid line and squares兲,共ii兲⑀1= 80,⑀2= 80, and⑀3= 80
共dotted line and circles兲, and共iii兲⑀1=⬁,⑀2= 6, and⑀3= 80共dashed line and
diamonds兲.
FIG. 5. The density in the middle of the plates as a function of plate sepa-ration for 共i兲 bulklB= 1.5,= 0 共solid line兲,共ii兲bulklB= 0.5,= 0 共dotted
line兲, 共iii兲 bulklB= 0.5, = 1 共dashed line兲, and 共iv兲 bulklB= 0.1, = 0
共dashed-dotted line兲. The thin lines are for1=bulk, and the thick lines give
[image:8.612.68.286.49.197.2]+⌰共z−d+h兲⌬12⌬3e −2K2共d−z兲
+⌬4e−2K2共z−d+h兲− 2⌬4⌬12e−2hK2 ⌬3−⌬4⌬12e−2hK2 ,
where
⌬1=⌬12e−2hK2−⌬32,
⌬2= 1 −⌬12⌬32e−2hK2,
⌬3= −⌬32⌬1e−2K3共d−2h兲−⌬2,
⌬4= −⌬1e−2共d−2h兲K3−⌬32⌬2.
Here, d is the distance between the two plates andh is the size of the depletion layer. In this work, we set2=bulkand optimize the partition function with respect to the depletion layer screening1and the size of the depletion layerh. This case, referred to as the full variation treatment, is compared to a less accurate approach in which the screening between the plates is assumed to be uniform共i.e.,1=bulk兲.
Within the first order variational approximation, the grand partition function is given by
lnZG关␥兴艌−V
bulk3
24 +V
兺
␣ ␣ bulk− 2Ah1 3−
bulk 3
24 + 2A
兺
␣ ␣ bulk冕
0
h
dz
冉
exp冋
q␣ 22 共1−bulk兲−
q␣2
2 ␦GK共z,z兲
册
− 1冊
+A兺
␣ ␣ bulk
冕
h d−h
dz
冉
exp冋
− q␣ 22 ␦GK共z,z兲
册
− 1冊
− 1 2冕
01
dTrK共␦GK−␦GK兲+ ln N0
Nfree. 共25兲
The first two terms on the right side of Eq.共25兲represent the contribution to the grand partition function of an unconfined electrolyte solution. The third term accounts for the shift in the bulk electrostatic contribution due to the reduced screen-ing abilities of the depletion layers. The next two terms are the same as those that appear in the grand partition function for a dielectric plate surrounded by electrolyte solution, as studied in Sec. III A, except that the Green’s function corre-sponds to the confined electrolyte. The last two terms are due to fluctuation effects, where the first term arises from ion correlations, and the last term is the static van der Waals energy in the absence of electrolyte.
In Fig.5, the midplane electrolyte density is plotted as a function of plate-plate separation. The thick lines refer to the full variational theory; the thin lines are for the case 1=2 =bulk. For large plate-plate separations共i.e.,bulkdⰇ1兲, the midplane density exponentially approaches the bulk value with a length scale given by bulk. In the full variational theory, the depletion layer is larger, an effect that is due to electrostatic correlation effects; an enhanced repulsion is felt by the ions near the dielectric surface due to the low screen-ing layer. This extra repulsion is the result of the solvation effect where the ions would like to be in an environment where they are maximally screened. For these large separa-tions, the thicknesses of the depletion layers are roughly half a Bjerrum length. The layers overlap at a plate-plate separa-tion of about one Bjerrum length, a result that is relatively insensitive to bulk salt concentration. For plate-plate separa-tions of less than one Bjerrum length, the electrolyte density
approaches 0 when ⑀⬘/⑀= 0. This effect is predominantly driven by image charge forces, as much less ion exclusion is observed for the case where there is no dielectric boundary, as depicted in Fig. 5 共i.e., ⑀⬘/⑀= 1兲. In the latter case, ion depletion occurs due only to a solvation effect, in which ions prefer to be in the fully screened bulk environment versus near the impenetrable plates which have no screening ability. The variation of the thickness and the associated screen-ing length of the depletion layer with plate-plate separation are plotted in Fig. 6. For = 0 共thick lines兲 and plate-plate separations of less than approximately one Bjerrum length, the depletion layer corresponds to the entire solution 共i.e., h=d/2兲 as reflected by a linear relation between h and d. Also, over these separations, the depletion layer have little ability to screen charge 共i.e., 1⬇0兲. For plate separations larger than one Bjerrum length, the thickness of the depletion layer exponentially decays toward the value corresponding to a single plate共see Sec. III兲. Similarly, the screening factor1 rapidly increases from 0 to a finite value atd⬇lBafter which
the value exponentially decays toward the single plate value
共see Sec. III兲. In contrast, when image charge forces are ab-sent as given by the case where = 1共thin lines in Fig. 6兲, the length scale governing the behavior of the depletion layer thickness and the associated screening is the bulk screening lengthbulk, rather thanlB. Here, the depletion of ions is due
thick-ness of the ion-depleted layers共for lB⬎bulk−1 兲and to reduce the screening effectiveness within these regions.
The net pressurepint共force per unit area兲acting between the plates is given by the difference between the 共osmotic兲 pressure of the bulk electrolytepbulk, which pushes the plates together, and the共osmotic兲 pressurep of the electrolyte be-tween the plates, which pushes the plates apart,
pint=p−pbulk.
The pressure of the electrolyte solution between the plates can be directly obtained from the grand partition function through the relation
p=
VlnZG关␥兴. 共26兲 The force between the two plates, as predicted by the grand partition function given in Eq.共25兲, is plotted in Fig.7. The thick lines correspond to the full variational treatment, and the thin lines correspond to setting1=2=bulk. For the latter case, when ⑀⬘⬍⑀, the interaction is dominated by the van der Waals force, which exponentially decays for medium to large plate-plate separations due to screening by the elec-trolyte according top⬀e−2bulkd/d. In the absence of a
dielec-tric boundary, the van der Waals force is absent; the interac-tion is due, instead, to electrolyte depleinterac-tion which causes an imbalance of the osmotic pressure between the plates and in the bulk solution. This interaction also has an exponential decay with distance, although the magnitude of the force is much smaller than that of the van der Waals interaction. The results presented here are similar to the predictions of the loop expansion and other previously developed theories.6,13,35
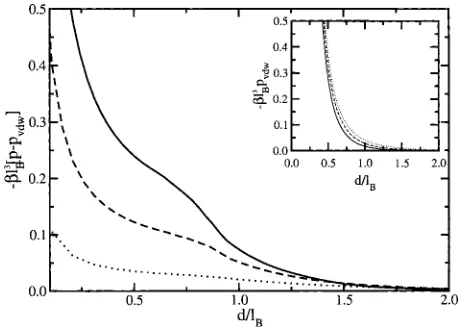
[image:10.612.321.550.48.212.2]The differences in the predictions of the two treatments are best exemplified when considering the case of = 0 for two regions of plate-plate separation: One region corre-sponding to separations less than the Bjerrum length and one greater than the Bjerrum length. The former case is depicted in the inset of Fig.7; in this case, the attraction between the plates is greater when using the variational treatment, an ef-fect that is enhanced with increasing electrolyte concentra-tion. The extra attraction is due to two separate types of effects. Both of these arise from the almost complete exclu-sion of electrolytes within this region, an effect that has re-cently been experimentally observed in a study of forces be-tween neutral lipid membranes.36 For short separations, within the variational treatment, the plates are attracted to each other through a van der Waals interaction4 that decays as 1/d3 共i.e., it is unaffected by the electrolytes兲. Superim-posed upon the van der Waals force is an attractive, electro-lyte depletion force which is enhanced within the variational treatment due to the greater electrolyte exclusion. To clearly show the predictions of the variational theory as compared to the standard screened van der Waals interaction, as derived by Mahanty and Ninham4and later by Netz,6 the difference between the two forces is plotted in Fig. 8. As shown, the difference between the two forces increases with increasing electrolyte concentration, while the standard screened van der Waals interaction has the opposite trend 共i.e., the force becomes weaker with increasing bulk electrolyte concentra-tion, see the inset of Fig.8兲. The difference between the two treatments becomes comparable or even greater than the standard van der Waals interaction for moderately concen-trated solutions 共bulk⬇0.01– 1.0M, bulklB⬇0.1– 2兲. At
FIG. 6. The variation of the共a兲thicknesshand the共b兲inverse screening length1of the depletion layer as a function of plate separationdand共i兲
bulklB= 1.5共solid line兲and共ii兲bulklB= 0.5共dotted line兲. The thin lines are
[image:10.612.68.277.49.197.2]for= 1, and the thick lines give the result when= 0.
FIG. 7. The pressure as a function of plate separation for:共i兲bulklB= 1.5,
= 0共solid line兲,共ii兲bulklB= 0.5,= 0共dotted line兲, and共iii兲bulklB= 1.5,
= 1共dashed line兲. The thin lines are for1=bulk, and the thick lines give
the result when1andhare optimized.
FIG. 8. The difference between the pressure and the screened van der Waals pressure as a function of plate separation for:共i兲bulklB= 1.5共solid line兲,共ii兲
bulklB= 1.0共dashed line兲, and共iii兲bulklB= 0.5共dotted line兲. The inset gives
[image:10.612.69.278.562.711.2]separations larger than the Bjerrum length, the intraplate electrolyte concentration increases, and the van der Waals interaction is screened within either treatment, as shown in Fig.7. However, in the variational approach, the interaction becomes slightly stronger due to the layer of ion depletion about each of the plates.
As mentioned earlier, in the absence of image charge forces, the short-ranged force between the plates is attractive due to the exclusion of ions from between the plates leading to an attractive osmotic depletion force, similar to the one studied by Bratko and Henderson.18The exclusion of ions is greater when a low dielectric boundary is present, leading to a much stronger attraction between the plates. For low bulk electrolyte concentrations, the depletion-induced attraction is much smaller than the van der Waals interaction felt at the same distance. However, if the screening length becomes smaller thanlB 共e.g., at high electrolyte concentrations兲, the
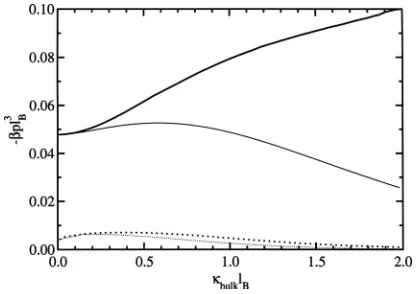
osmotic pressure force becomes comparable to the van der Waals interaction, as shown in Fig.9. Here, the pressure for the case where1=bulkis plotted together with the pressure when h and 1 is optimized. The difference between the pressures in the two cases can be attributed to the attractive osmotic depletion force and the change in the van der Waals interaction. Since the van der Waals interaction at d =lB is
almost unaffected by the electrolytes, a good approximation for the magnitude of the osmotic depletion force at this sepa-ration is the difference between the total pressure共solid line in Fig.9兲and the van der Waals interaction in the absence of electrolytes关−lB3pvdWbulk=0共d=lB兲= 0.0477兴.
At plate separations larger than one Bjerrum length, the electrolyte begins to enter the region between the plates and effectively screens the interaction. This can be seen by con-sidering the case whend= 2lBin Fig.9, where the interaction
between the plates decreases with increasing electrolyte con-centration 共dotted line兲. Note that because we use a point charge model for the electrolytes, the resulting predictions are limited to low packing fractions and bulklB⬍4, where
the mean spacing between the ions is larger than the Bjerrum length.14
The results of the variational treatment provide insights into salting-out effects which have been observed for a broad range of solutions containing, for example, micelles,37
un-charged polymers,38 or proteins.39 In these systems, a salt-induced, short-ranged attraction occurs between the macro-molecules in moderate to high ionic strength solutions, where double layer interactions are screened out. In this work, we find that the salt-induced attraction becomes pro-portional to the osmotic pressure of the salt solution at higher ionic strengths. This result is consistent with recent measure-ments of the forces between arrays of hydroxypropylcellu-lose molecules immersed in various aqueous cosolvent systems.38 In these studies, the measured force is linked to the exponential decay of the confined cosolvent concentra-tion as the interlayer separaconcentra-tion decreases; the range of this interaction was found to be independent of the concentration. The characteristic range for this force has previously been associated with the range of hydration forces or with the screening length. We identify this distance as the Bjerrum length, which corresponds to the separation from the dielec-tric boundary where the interaction energy of an ion with its image charge is equal to kBT. The finding that the range is
constant with added salt is an important feature of the model; without the variational treatment, the decay length of the depletion interaction would be given by bulk−1 , and the interaction would be screened at medium to high ionic strength, as shown in Fig.9. Further, in the case where there is no dielectric boundary, the exclusion of the confined electrolyte is only a small fraction of the bulk value, in dis-agreement with the experimental findings. Thus, we expect that image forces play a significant role in determining the forces between surfaces in moderately concentrated electrolyte solutions.
V. CONCLUSIONS
We have developed a variational theory for electrolyte solutions that explicitly accounts for the ion depletion and reduced screening near dielectric interfaces. This theory was used to examine the force between two uncharged dielectric plates immersed in an electrolyte solution. The force be-tween the plates is composed of a contribution from a van der Waals interaction and from an osmotic depletion force. The van der Waals interaction at short range is nearly unaf-fected by the electrolyte, as the ion density is very small and, consequently, remains strongly attractive even in moderate to high electrolyte concentrations. The osmotic depletion force is analogous to the depletion forces due to excluded volume, and it becomes proportional to the osmotic pressure of the surrounding bulk solution. This osmotic depletion interaction increases with increasing electrolyte concentration and may contribute to salting-out effects. The force between plates at large separation also increases with increasing electrolyte concentration, a result which is mainly due to ion correlation effects caused by the low screening ability of the depletion layers. At these distances, the force exponentially decays, with a characteristic length scale given by the bulk screening length. Consequently, it rapidly decays in moderately con-centrated electrolyte solutions.
[image:11.612.69.278.48.195.2]Currently, we are working to include excluded volume, induction, and dispersion interactions between the ions them-selves, as well as between the ions and the surfaces. The
FIG. 9. The variation of the pressure as a function of bulk screening length at constant plate-plate separation for= 0.共i兲d=lB共solid line兲and共ii兲d
= 2lB共dotted line兲. The thin lines are for1=bulk, and the thick lines give
theory as such would then be applicable to more concen-trated electrolyte solutions and would provide insight into ion-specific forces, an understanding of which, has so far remained elusive.
ACKNOWLEDGMENTS
M.M.H. acknowledges support from an EC Marie Curie Fellowship No.共MEST-CT-2004-503750兲.
1B. W. Ninham and V. Yaminsky,Langmuir 13, 2097共1997兲.
2L. Guldbrand, B. Jönsson, H. Wennerström, and P. Linse,J. Phys. Chem.
80, 2221共1984兲.
3J. P. Valleau, R. Ivkov, and G. M. Torrie,J. Chem. Phys. 95, 520共1991兲. 4J. Mahanty and B. W. Ninham,Dispersion Forces共Academic, London,
1976兲.
5P. Attard,J. Phys. Chem. 93, 6441共1989兲. 6R. R. Netz,Eur. Phys. J. E 5, 189共2001兲.
7J. Z. Wu, D. Bratko, H. W. Blanch, and J. M. Prausnitz,J. Chem. Phys.
111, 7084共1999兲.
8T. Ghosh, A. Kalra, and S. Garde,J. Phys. Chem. B 109, 642共2005兲. 9S. Asakura and F. Oosawa, J. Chem. Phys. 22, 1255共1954兲. 10M. N. Tamashiro and P. Pincus,Phys. Rev. E 60, 6549共1999兲. 11C. Wagner, Phys. Z. 25, 474共1924兲.
12L. Onsager and N. T. Samaras,J. Chem. Phys. 2, 528共1934兲. 13D. S. Dean and R. R. Horgan,Phys. Rev. E 69, 061603共2004兲. 14R. A. Curtis and L. Lue,J. Chem. Phys. 123, 174702共2005兲. 15E. Allahyarov, I. D’Amico, and H. Löwen,Phys. Rev. Lett. 81, 1334
共1998兲.
16D. Bratko, B. Jönsson, and H. Wennerström,Chem. Phys. Lett. 128, 449
共1986兲.
17D. Bratko, D. J. Henderson, and L. Blum,Phys. Rev. A44, 8235共1991兲. 18D. Bratko and D. Henderson,Phys. Rev. E 49, 4140共1994兲.
19G. M. Torrie, J. P. Valleau, and C. W. Outhwaite, J. Chem. Phys. 81,
6296共1984兲.
20R. L. Stratonovich, Dokl. Akad. Nauk SSSR 115, 1097共1957兲. 21J. Hubbard,Phys. Rev. Lett. 3, 77共1959兲.
22A. L. Kholodenko and A. L. Beyerlein,Phys. Rev. A 34, 3309共1986兲. 23L. Lue, N. Zoeller, and D. Blankschtein,Langmuir 15, 3726共1999兲. 24L. Lue,Fluid Phase Equilib. 241, 236共2006兲.
25J. D. Jackson,Classical Electrodynamics共Wiley, New York, 1975兲. 26A. G. Moreira and R. R. Netz,Phys. Rev. Lett. 87, 078301共2001兲. 27G. Tellez,Phys. Rev. E 70, 011508共2004兲.
28R. P. Feynman, Statistical Mechanics: A Set of Lectures 共
Addison-Wesley, Redwood, CA, 1972兲.
29H. Kleinert,Path Integrals in Quantum Mechanics, Statistics, and
Poly-mer Physics, 2nd ed.共World Scientific, Singapore, 1995兲.
30R. R. Netz and H. Orland,Eur. Phys. J. E 11, 310共2003兲.
31A. Diehl, M. C. Barbosa, and Y. Levin,Phys. Rev. E 56, 619共1997兲. 32R. R. Netz,Eur. Phys. J. E 3, 131共2000兲.
33L. B. Bhuiyan, C. W. Outhwaite, D. Henderson, and M. Alawneh,Mol.
Phys. 105, 1395共2007兲.
34D. Henderson, D. Gillespie, T. Nagy, and D. Boda,Mol. Phys. 103, 2851
共2005兲.
35P. Attard, D. J. Mitchell, and B. W. Ninham,J. Chem. Phys. 89, 4358
共1988兲.
36H. I. Petrache, T. Zemb, L. Belloni, and V. A. Parsegian,Proc. Natl.
Acad. Sci. U.S.A. 103, 7982共2006兲.
37Y. X. Huang, G. M. Thurston, D. Blankschtein, and G. B. Benedek,J.
Chem. Phys. 92, 1956共1990兲.
38J. Chik, S. Mizrahi, S. Chi, V. A. Parsegian, and D. C. Rau,J. Phys.
Chem. B 109, 9111共2005兲.
39R. A. Curtis, J. Ulrich, A. Montaser, J. M. Prausnitz, and H. W. Blanch,