• No results found

Quantitative operational risk analysis for dangerous goods transportation through cut and cover road tunnels

N/A
N/A
Protected

Academic year: 2019

Share "Quantitative operational risk analysis for dangerous goods transportation through cut and cover road tunnels"

Copied!
6
0
0

Loading.... (view fulltext now)

Full text

Figure

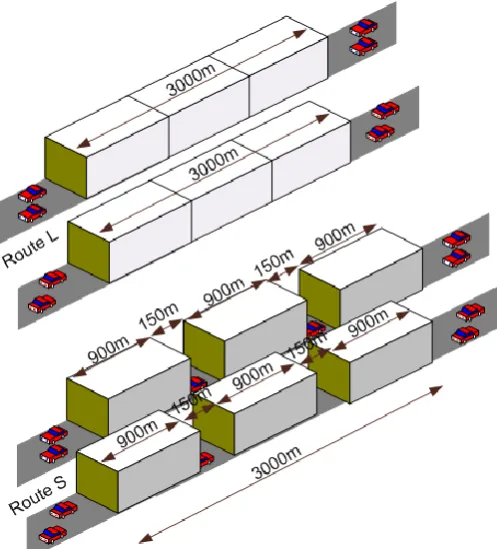
Figure 1. The two alternatives routes.
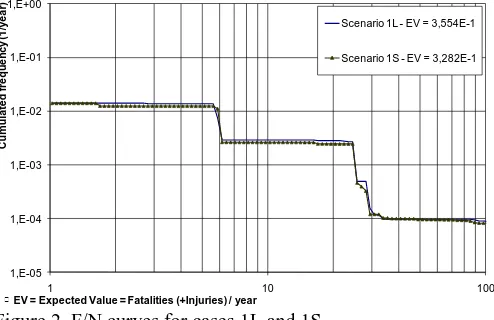
Figure 2. F/N curves for cases 1L and 1S
Figure 4. F/N curves for cases 3L and 3S  EV = Expected Value = Fatalities (+Injuries) / year

References

Related documents