Influences of Design tools on the Original and Redesign process
Concept generation plays a vital role in establishing a broader foundation in the design process to create novel products. In the globalized, collaborative, designing scenario, the unambiguous representation of captured ideas to explicate the designer’s thoughts is important in the sharing and reuse of concepts. Various design studies have noted the impact of design tools on concept generation. However, the results did not detail the influences of a variety of tools on the representation and reinterpretation of concepts through captured design documents. The goal of this paper is to understand the influence of conceptual design tools: Mobile e-Notes TakerTM, Wacom® Tablet, and Rhinoceros® CAD with MS Word/PowerPoint on concept representation and reinterpretation, during the original and redesign phases. Eighteen design experiments, involving six individual student designers’ solving three design problems each, were conducted in the original and redesign phases. The analyses of twenty six variables from captured documents and video protocols reveal that the design tools had a statistically significant impact on four key variables: the total time taken to solve each problem, the time spent on detailed design activity, the textual representation of structural requirements and the graphical representation of the structure of detailed concepts. Irrespective of the design tool used, novice designers generated a low number of redesign concepts. This makes us conclude that designers might require training for reinterpretation and extracting necessary information from the concepts originally captured, rather than working with poor understanding, ambiguity and assumptions about the original designer’s intent.
Keywords: concept generation, design tools, representation, reinterpretation
1. Introduction
Innovation is a key factor in sustaining this competitive globalized industrial
scenario. Designers are increasingly being encouraged to create quality innovative
products in faster cycles. Typically, designers are trained and motivated to be creative,
and creativity is often expressed through fluency, flexibility and originality (Renzulli et
al., 1974). According to a common definition of creativity, “Creativity occurs through a
novel and valuable” (Sarkar and Chakrabarti, 2011). It has been shown that there is a
positive correlation between the number and variety of ideas produced during the design
process, and the novelty of the design concepts (Srinivasan and Chakrabarti, 2010a).
There are many factors that influence this concept generation process. The concept
generation process is currently under extensive study by the engineering community [e.g.
Nagai and Taura, 2006; Srinivasan and Chakrabarti, 2010a, 2010b], with various support
tools under development [e.g. Liu et al. 2000; Chakrabarti, 2001a, 2001b, 2004;
Chakrabarti et al. 2005; Sarkar and Chakrabarti, 2007, 2008; Sartori et al. 2010]. Notably,
people, products, processes, tools, and the organization and environment in which
designing takes place (Blessing et al. 1995) have a significant impact on the concept
generation process. Among these facets, design tools play a vital role in capturing
designers’ thought processes and in facilitating the sharing and reuse of design outcomes.
Design tools support the externalization process, which not only stores a record of design
activities, but also serves as a tool to support reasoning between these sequential acts
(Bilda and Gero, 2005). It has been argued that the designer should not be constrained by
the tool and should be made free to express his or her intent on the design (Robertson and
Radcliffe, 2009). Even though the impact of time pressure on tool selection is observed
in real design practices (Elsen et al. 2010), it is a designer’s responsibility to choose the
appropriate design tools in the design process, based on an understanding of the ability
of each tool alternative available. Stones and Cassidy (2010) argue that it is vital to equip
students with the ability to make well-informed decisions about tool choice and tool use
during design ideation. However, studies have shown that although CAD is less
frequently used for immature designs (i.e. at the conceptual stage), it is still the most
frequently used mode of working (Robertson and Radcliffe, 2009). They argue that a
analysis and process integration. Ibrahim and Paulson (2008) pointed out that the
transitional and iterative conceptual phase is a potential knowledge-loss period that is
identified in the product development lifecycle process.
This research stems from the question whether designers really understand the influence
that design tools have on the design outcomes generated. While Cham and Yang (2005)
cited a number of good examples of successful integration of CAD and design education,
this situation is hardly universal. The influence of design tools on creative outcomes is
widely discussed in the literature. Most of the current literature has focused on original
design where a designer solves a design problem for the first time. The focus of this paper
is also to cover design as well as redesign processes in which the documents captured by
the original designer are supplied to the re-designer (a different designer) to improve
design solutions.
Ibrahim and Rahimian (2010) demonstrated that neither manual sketching tools nor CAD
software are the better media for current conceptual design communications. They found
that the design semantic gets lost when manual design fails in articulating an explicit
design idea, while design creativity diminishes when using arduous CAD software. As
the importance of the digitalization of design outcomes should be stressed along with the
creativity elements, we have chosen three tools (Mobile e-Notes TakerTM, Wacom®
Tablet, and Rhinoceros® CAD with MS Word/PowerPoint ) to study their impact on both
original and redesign processes. These tools have the potential to capture design outcomes
digitally to facilitate the redesign process.
Content-oriented studies have been carried out to study which aspects of the utilised
media improve or hamper design quality. A fundamental question that this paper raises
process but also the redesign process carried out by a different designer (as is typically
the case)? The rest of the paper consists of sections discussing the related literature,
hypotheses and methodology framed, the results obtained, and a discussion and
conclusions.
2. Related Literature
Various design studies have been conducted to understand the differences between
pencil-and-paper-aided-designing and CAD designing, especially for their impact related
to creativity in design. Elsen et al. (2010) compared the pros and cons of a free-hand
sketch and CAD. In this section, we summarize the results of various comparative case
studies involving pencil-and-paper and CAD. Most of the studies conclude that CAD is
not suitable during the conceptual stage, as it exerts a negative influence on creative
design. It is commonly concluded that the creativity of designers is more effective with
paper-and-pencil tools than with CAD software. The foremost reason for this conclusion
is that CAD software provides inadequate I/O systems to support intuitive idea creation
(Whitefield, 1986; Kwon et al. 2003; Lawson, 2002; Stones and Cassidy, 2007). The
capabilities of I/O systems are focused on the intuitive sketching capabilities offered by
pencil-and-paper tools that are limited in CAD software (Kwon et al. 2005). Also the
perception of visual–spatial features is high with paper-and-pencil tools (Bilda and
Demirkan, 2003).
Beside inadequate I/O systems, the support offered by paper-and-pencil tools to enrich
the creativity process is emphasised. Paper-and-pencil tools facilitate lateral
transformations, partly due to the qualities of denseness and ambiguity found within the
mark itself (Goel, 1995). Paper-and-pencil tools, through sketches, lighten the load on
(Stones and Cassidy, 2007). Also misinterpretations of the sketches could trigger novel
ideas in using paper-and-pencil tools (Stacey and Eckert, 2003).
Other factors that can influence CAD suitability in the conceptual stage are the
requirements for a high degree of specialisation from the users (degree of skills) (Levet
et al. 2006). Designers judge their work using a different set of criteria in using different
tools, e.g. a high level of finish with design proficiency in CAD software (Black, 1990).
A CAD conception of the design problem is high with paper-and-pencil tools (Bilda and
Demirkan, 2003). Also, CAD software uses highly structured rules leading to restriction
in the early stages of design (Stones and Cassidy, 2007).
In opposition to the above conclusion, a few studies have pointed out the merits of CAD
features in particular problem types. Fish and Scrivener (1990) argue that CAD software
supports creativity in well-structured problems. It fosters new patterns, relationships, or
aesthetics, and expands, rather than reduces the designer’s creative options (Jonson,
2005). The playfulness of digital forms is evident and the fluidity of manipulation leads
to new ideas (Kelly, 2001; Stones and Cassidy, 2010). Elsen et al. (2010) argue that CAD
tools could be considered potentially effective also in the preliminary design process, if
considered jointly with sketches.
The influencing factors generally used to assess creativity are levels of ambiguity,
frequency of reinterpretation and the number and variety of concepts. Schön (1983)
argues that design tools assist a ‘reflective conversation’ between designers and design
outcomes (e.g. external representations of requirements and solutions) which help
generate a mental image that, in turn, may produce more sketches (ideas) which may,
again, generate another mental image, and so on and so forth (Fish and Scrivener, 1990).
cognitive process that occurs as the designer sketches. Reinterpretation is important since
it is a valuable source of new, unexpected ideas, and could generally be described as the
outcome of a lateral thinking process (De Bono, 1970). Goldschmidt (1994, p. 164)
describes reinterpretation through stating that ‘one reads off the sketch more information
than was invested in its making’. It should be noted that the context of these arguments
are during the phase of original design rather than the redesign process. There are
contradictory opinions on the influence of tools on the reinterpretation process. Goel
(1995) observed that the number of reinterpretations was higher with paper-and-pencil
tools than with CAD software. The reason cited for this reinterpretation is that the
designer ‘sees’ new ideas in the existing sketches. In opposition to the above conclusion,
Won (2001) noted that the frequency of reinterpretation is higher with CAD software due
to the speed of digital working i.e. the ability to ‘move-see-move-see’ and the facilitation
of rapid transformations.
Stones and Cassidy (2010) argued that reinterpretation is linked to the quality of
ambiguity. Ambiguity can be defined as ‘interpretable in two or more distinct ways’ or
as ‘vague or imprecise’ (Stacey and Eckert, 2003, p. 153). They pointed out that
ambiguity can lead to the discovery of useful alternative ideas, when the sketches or other
communicative objects are interpreted as a different set of objects and relationships from
those intended. The hypothesis is that ambiguity can be beneficial when the gain from
actively clarifying shared understanding is greater than the cost of exploring unacceptable
paths. Commonly, it is concluded that the level of ambiguity is higher with
paper-and-pencil tools than with CAD software. This is due to the visual qualities of marks in CAD
which appear decisive and are notably precise, concrete and certain in finished
appearance (Stones and Cassidy, 2010; Goel, 1995; Robertson and Radcliffe, 2009; Won,
Hannah et al. (2012) argued that designers are more confident and correct in making
conclusions about whether a design meets requirements when using high-fidelity
representations and physical representations, specifically high-fidelity prototypes.
Low-fidelity representations (sketches and drawings) are not effective in helping to answer
questions related to whether the requirements are met or not. Robertson and Radcliffe
(2009) noted that the illusion of completeness offered by CAD could be a distracting
factor influencing the level of ambiguity. Also, they pointed out that designers often aim
for ‘perfection’ while using CAD and this influences the reinterpretation process and
develops a false sense of reality.
Notably, many studies have pointed that the number of concepts is higher with
paper-and-pencil tools than with CAD software. Tool features such as simplicity, ease of use
and ease of learning are instrumental in increasing concept generation (Stones and
Cassidy, 2010; Rahimian et al. 2008). The designer’s tool use also affects concept
generation. Won (2001) observed that the frequent interchange between the focus on
details and the focus on the whole, influences concept generation. In CAD, the switching
time is much more frequent than in the traditional way. Rahimian et al. (2008) observed
that maintaining the design idea during the design process, provides the ability to see all
documents together and to compare them. This facilitates concept generation. Also, they
pointed that ease of changing and reforming the design alternative influence this process.
As discussed in the paragraphs above, ambiguity and reinterpretation play a vital role in
generating concepts. Stones and Cassidy (2010) argued that the use of symbolic systems
such as fonts during synthesis tasks may restrict the scope of design ideas. Robertson and
Radcliffe (2009) noted that a large amount of detail and interconnectedness is built too
quickly in CAD leading to premature fixation. Premature fixation develops a resistance
argued that the constant use of CAD under stressful conditions and circumscribed
thinking interferes too strongly in the design process, either by limiting what can be
created, or by encouraging the designer to over-reach the requirements of the task.
Stones and Cassidy (2010) concluded that the number of diverse concepts is higher with
paper-and-pencil tools than with CAD software. They observed that CAD software is less
likely to create a synthesis where shapes contribute form to each other. Also, in using
CAD, designers are more likely to select a shape, rather than create it from scratch or
overly manipulate it to suit the purpose (Hewson, 1994).
As predicted, the literature states that the visualization of concepts is higher with CAD
software than with paper-and-pencil tools. CAD has capabilities for zooming and panning
for easier walkthroughs, while temporarily omitting an object or group of objects.
(Robertson et al. 2007; Robertson and Radcliffe, 2009). It also provides more detailed,
realistic, and elaborated perspectives (Rahimian et al. 2008).
It is clear from these literature results, that for the conceptual stage, current CAD software
is not yet a better alternative to replace conventional sketching tools, even though CAD
provides enhanced visualization and speedy manipulation of objects. However, the
importance of the capture and reuse of digitalized design outcomes forces us to develop
enhanced novel design tools that retain the merits of both media. For developing such
tools, it is vital to understand the behaviour of designers in using various advanced
conceptual tools in terms of the textual and graphical representations of captured design
documents. Also, the behavioural changes of designers in the reinterpretation of the
captured design documents during the redesign process need to be studied across the use
of various conceptual tools. The literature does not report, in any detail, the behavioural
the literature, various design studies have been conducted to understand the differences
between pencil-and-paper-aided-designing and CAD designing, especially for their
impact on creativity in design. However, substitute tools for
pencil-and-paper-aided-designing are not studied in the literature. The key gap in the literature is that the influence
of a variety of tools on the representation and reinterpretation of concepts through
captured design documents, is not studied. The focus of this paper is to understand the
influences of three conceptual design tools – Mobile e-Notes TakerTM, Wacom® Tablet,
and Computer with Rhinoceros® CAD and MS Word/PowerPoint – on concept
representation and reinterpretation during the original and redesign processes. The unique
feature of these three tools is their capability to digitalize design during the creation
process itself. They aid designing by the capture, share and reuse of design knowledge.
3. Research objectives and methodology
This section provides a description of chosen design tools and the rationale for their
selection, framed research hypotheses with parameter definitions, experimental design
and the results of a valid coding scheme.
3.1. Description of chosen design tools and rationale
The aim of this paper is to study the impact of conceptual design tools on the behavioural
changes of designers in (1) the representation of design concepts in design documents
captured during both original and redesign processes, and (2) the reinterpretation of
captured concepts during the redesign process. A concept is defined as an entity that
satisfies an overall function (Srinivasan and Chakrabarti, 2010a). We have chosen Mobile
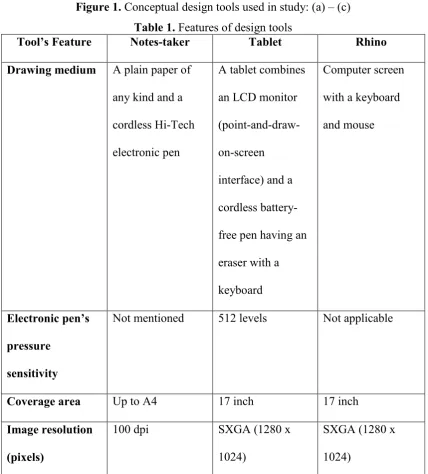
e-Notes TakerTM, Wacom® Tablet, and Rhinoceros® CAD with MS Word/PowerPoint
(Figure 1) as the set of conceptual tools to be examined in this study. From hereafter,
these tools are used with the help of a computer. The Notes-taker and the Tablet were
selected for their potential to replace the pencil and paper tool (the most commonly used
aid for conceptual design currently), and also for their ability to support the capture and
reuse, in digitalized formats, of design concepts. For comparison with CAD tools, Rhino
was chosen as it has been widely used in our design centre as a conceptual CAD tool. The
Tablet and Rhino are widely used in design, whereas the Notes- taker is commonly used
as a digital notebook for documentation purposes.
The Notes-takeris a portable handwriting capture device based on natural handwriting as
an input. A plain paper of any kind can be attached to the tool and the Hi-Tech’s electronic
pen can be used to capture, store and share handwritten drawings, sketches and notes. In
this study, we used the Wacom® DTU-710 tablet. The DTU-710 Interactive Pen display
combines an LCD monitor with a tablet. This gives a direct point-and-draw-on-screen
interface that can be used with a computer. Rhino is widely used during conceptual
designing. Rhino offers uninhibited free-form 3-D modelling, extreme precision,
unrestricted editing, 2-D drafting, annotation, illustration, compatibility, and a short
learning curve. More details about these tools are provided in Appendix 1. The web links
to access all appendixes of this paper are provided at the end of the references section.
Table 1 summarizes the important tool-features considered in our study, which are likely
to have influenced the behaviour of the designers. While using Rhino, the designers were
allowed to use other word processing software such as MS Word or PowerPoint to support
their designing. Since Rhino supports predominantly graphical features of designing, we
provided MS word or PowerPoint to support designers in expressing textual elements. In
contrast, in the Notes-taker and the Tablet, both textual and graphical elements can be
represented with the same user interface. So MS word or PowerPoint was not provided
(a) Mobile e-Notes TakerTM (b) Wacom® DTU-710 Tablet
[image:11.595.84.513.240.715.2](c) Rhinoceros® CAD
[image:11.595.88.511.256.722.2]Figure 1. Conceptual design tools used in study: (a) – (c)
Table 1. Features of design tools
Tool’s Feature Notes-taker Tablet Rhino
Drawing medium A plain paper of any kind and a
cordless Hi-Tech
electronic pen
A tablet combines
an LCD monitor
(point-and-draw-on-screen
interface) and a
cordless
battery-free pen having an
eraser with a
keyboard
Computer screen
with a keyboard
and mouse
Electronic pen’s pressure
sensitivity
Not mentioned 512 levels Not applicable
Coverage area Up to A4 17 inch 17 inch
Image resolution (pixels)
100 dpi SXGA (1280 x
1024)
SXGA (1280 x
Tool Inclination (degrees)
900 from vertical Incline 180 - 740
from vertical
00 from vertical
3.2. Parameter Definition and Research Hypotheses
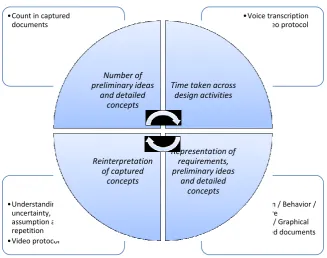
A map of the set of hypotheses explored in this work is shown in Figure 2. The parameters
used for the investigation are identified and these are the ‘Number of preliminary and
detailed concepts’, ‘time taken across the design activities’, ‘representation of
{requirements, preliminary ideas and detailed concepts}’, and ‘reinterpretation of
captured documents’. In addition to the four parameters detailed in Figure 2, ‘designer
adaptability to design tool’ is also studied. The effect of all these five parameters is
studied in detail using the procedure discussed in subsequent paragraphs. Representation
is studied through textual and graphical formats. Textual contents are analysed by
counting the number of words used to express function, behaviour and structure elements;
whereas graphical contents are analysed using the number of distinguishable components
represented through sketches and diagrams. For the distinguishing function, behaviour
and structure elements, the definitions used by Chakrabarti et al. (2005) are used.
Function: Descriptions of what a system does: it is intentional and generally at a
higher level of abstraction than behaviour.
Behaviour: Descriptions of how a system performs its function. This is generally
at a lower level of abstraction than function.
Structure: Structure is described by the elements and interfaces with which the
system and its immediate interacting environment are constructed.
The reinterpretation of captured concepts is analysed by the understanding, ambiguity,
assumptions and repetitions made by the designer working in the redesign phase.
imprecise’ (Stacey and Eckert, 2003). Video protocols have been analysed to segment the
ambiguous portions expressed by each designer. Adaptability with design tools has been
studied through the comfort of the designer. Video protocols and audio transcripts have
been used to understand and segment portions of uncomfortable behaviours. The time
taken across the design activities is noted by using timestamps in the video protocols. The
formulated hypotheses which are verified in this study are given below:
(H1) Conceptual design tools have a significant impact on the number of concepts
generated.
(H2) Conceptual design tools have a significant impact on the amount of time spent by
the designers across design stages in both the original and redesign phases.
(H3) Conceptual design tools have a significant impact on the representation (wider
variation possible in the expression of design elements through textual (the
number of words) and graphical (distinguishable components) format) features of
captured requirements and concepts in terms of functional, behavioural and
structural elements.
(H4) The amount of time taken to capture requirements and concepts has a significant
impact on the representation of captured documents.
(H5) Formats of the representation of captured documents have a significant impact on
reinterpretation in the redesign phase.
(H6) Designer adaptability to a design tool has a significant impact on the
representation and reinterpretation of captured documents.
The significant term in these hypotheses represents the statistical significance of the
results. Since the results represented in this work are from the descriptive studies,
discussed above, the data has been analyzed without any expectations. In doing so, the
Figure 2. Research hypotheses map
3.3. Design of Experiment
To verify the formulated hypotheses, in-house experiments were conducted in a
laboratory setting. To study the capture and reuse aspects, original and redesign
experiments were conducted in a systematic manner. The experiments were structured
taking into account the variation necessary to enable a comparison of the use of the three
design tools, by multiple people, in both the capture and reuse aspects. The present
problem involves three principal effects: design tools, design problems and designers.
The experimental treatment combinations are generated by taking the help of the design
of experiments approach. The design of experiments approach helps in reducing the
number of experiments to be conducted to test the significance of the identified
hypotheses. The factors used for the experiments are fixed. The levels are three, six and
six for design tools, design problems and designers respectively. A constrained 6
(designer) x 6 (design problems) Latin square is shown in Table 2. It should be noted in
Table 2 that every (numbered) level of the factor of interest appears once in each row and
•Function / Behavior / Structure Textual / Graphical •Captured documents •Understanding, uncertainty, assumption and repetition •Video protocol •Voice transcription and video protocol •Count in captured
documents
Number of preliminary ideas
and detailed concepts
column of the table. Three different original design problems and three corresponding
redesign problems were used through the 18 experiments. The main aim for conducting
each of the nine experiments in the original and redesign process was to overcome and
understand the variation possible in solving different design problems through different
tools. It was not aimed at finding an equivalent problem in each set. The constraints
applied while implementing this 6 x 6 Latin square design are discussed below.
A designer should NOT solve the same problem with different tools (repetition is
not allowed).
Original and redesign problems (e.g., P1, P1’) should not be solved by the same
designer.
Each designer should solve three different design problems, each with a different
tool.
In order to maximize the randomization of the designer’s problem assignment, it
is suggested that each designer should solve at least one original design problem
or one redesign problem. That is, each designer will get either two original and
one redesign problem, or one original and two redesign problems.
Due to these constraints, the experiments mentioned in the crossed three rows in Table 2
were not conducted. The analyses were based only on the results derived from the first
three rows. The response variable under study is represented using the basic statistical
model for the Latin square design:
𝑦𝑖𝑗𝑘 = 𝜇 + 𝛼𝑖 + 𝛽𝑗+ 𝛾𝑘+ ∈𝑖𝑗𝑘 {where 𝑖 = 1,2,3; 𝑗 = 1,2. .6; 𝑘 = 1,2, . .6
Where 𝑦𝑖𝑗𝑘 is the response measure for observation in a set of a ‘𝑖’ design tool, a ‘𝑗’
design tool 𝑖, 𝛽𝑗 the effect of the design problem 𝑗, 𝛾𝑘 the effect of the designer 𝑘 and ∈𝑖𝑗𝑘 the error factor. Assuming simple additivity of the effect of design tools, design
problems and designers is a good approximation for the small range of observations, and
this design permits an independent and unbiased estimation of all the three effects. (𝛼𝑖, 𝛽𝑗, 𝛾𝑘) ~ N (0, 𝜎𝑖 𝑗𝑘2 ) is a nominal offset for set N (𝜃, 𝜎2) denoting ‘distributed as a normal
distribution with mean 𝜃 and variance 𝜎2. The extraction of the main effects and relevant
variance components from a Latin square design is derived using general linear modelling
functions in Minitab® (version 15.1) software. The level of significance considered in all
hypothesis testing is 0.05.
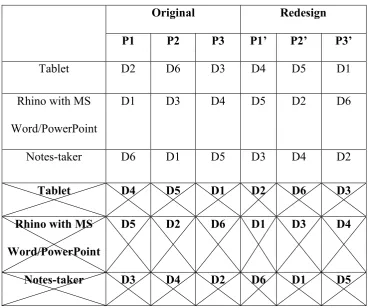
Table 2. Structure of the design of experiments (D1 – D6: Designers, P1 – P3: Original problem; P1’ – P3’: Redesign problem) (crossed experiments were not conducted due to
experimental constraints)
Original Redesign
[image:17.595.113.483.66.374.2]P1 P2 P3 P1’ P2’ P3’
Tablet D2 D6 D3 D4 D5 D1
Rhino with MS
Word/PowerPoint
D1 D3 D4 D5 D2 D6
Notes-taker D6 D1 D5 D3 D4 D2
Tablet D4 D5 D1 D2 D6 D3
Rhino with MS Word/PowerPoint
D5 D2 D6 D1 D3 D4
Notes-taker D3 D4 D2 D6 D1 D5
Overall, 18 experiments were conducted with four Master of Design students and two
design researchers. These designers are involved in nine experiments each involving
original design and redesign. These eighteen experiments were conducted because,
It was planned to conduct more than one experiment in each set involving an
original or redesign experiment using a specific tool (e.g., Notes-taker and
Original) because the results are better validated with multiple experiments each
involving different problems and designers using the same tool.
Conducting two experiments in each set does not provide symmetry to the design
of experiments because the number of tools considered for this study is three. This
would result in a designer solving the same problem twice using different tools.
This would create problems while carrying out comparisons for the same tool
across original and redesign experiments. Hence three experiments in each set
Also, three experiments in each set provide a confirmation of the results produced
in these analyses.
Since the three experiments in each set provide symmetry to the designed
experiments, three different design problems were framed for the original, and
three corresponding ones for the redesign experiments. Six designers participated
in these experiments. Each designer solved three different problems using three
different tools. This set-up tally with the symmetry developed in the design of
experiments.
All the captured original design documents (in the same captured format) were given
to the re-designer (designer involved in redesign) along with the redesign problem.
The re-designer was given freedom to explore and reinterpret the original design
documents at his leisure. Details about the participants/subjects who participated in
these experiments are given in Table 3. The time limit mentioned in the problem sheet
was approximately one hour. The reasons for this approximate time are:
Designers wanted to solve the given problem completely to their satisfaction.
Forcing designers to work compulsorily for 1 hour might have changed their
behaviour significantly.
The challenge is to allow designers to work as naturally as possible while enabling the
use of the tool. The three design problems and their corresponding three redesign
problems are described in Appendix 2. The designers were given adequate training to use
the tool before conducting the experiments. Every experiment was started after getting
the ‘go-ahead’ signal from the participating designer, when he felt competent to solve the
problem with the given tool. However, their competence levels were not judged before
each experiment. During the designed experiment, each subject was asked to ‘think aloud’
from the experiments. It should be noted that to nullify the effects of the ‘sequence in
which tools were used’, the experiments were conducted in a randomized fashion. All the
experiments were video recorded. Voice protocols, captured documents and video
recordings provided the material to test the hypotheses framed.
Table 3. Details about the subjects who participated
Designers Current studies Educational background
Years of industrial experience
Number of products designed
D1 1st year student– Master
of Design (M.Des)
B.E. Mechanical 2.5 ~5
D2 1st year student – M.Des. B.Tech.
Electronics and
Communication
0 ~3
D3 2nd year student - M.Des B.E. Production 1 ~10
D4 Research Fellow - Ph.D.
Completed
M.Des. 2.5 ~10
D5 4th year student - Ph.D. M.Tech.
Mechanical
0 0
D6 Ist year student – M.Des. B.E. Mechanical 2 ~4
3.4. Coding scheme validation
The lead researcher of this paper carried out all of the categorisation of the data using the
parameter definitions and documented procedure set out in Appendix 3. A complete
experiment was categorized by two engineers working together using Appendix 3 as
trained for two weeks using other coding materials. The transcripts of the coder for the
two experiments were compared to that of the researcher. Appendix 3 documents a
sample of the reported transcript. The overall agreement percentage is 96%. The
disagreements which took place in misinterpretation between function and behaviour
arose because of a misunderstanding of the context, negligence in choosing all the
captured words, difficulties in splitting function, behaviour and structure in a sentence,
differentiating text and graphical elements separately, merging of two concepts due to
improper labelling, and the exclusion of dimensions in structural elements. Appendix – 3
provides clarification for the feedback received in this testing process.
4. Results
H1. Conceptual design tools have a significant impact on the number of concepts
generated.
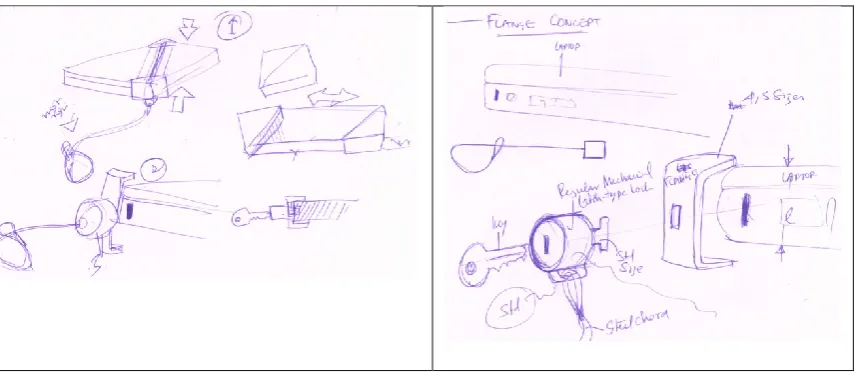
Tables 4 and 5 give the number of preliminary and detailed concepts generated in the
original and redesign experiments across the three design tools. The captured documents
are analysed to count the number of captured concepts. A preliminary concept is defined
as an idea to solve a given design problem, whereas a detailed concept is taken as one
that is elaborated. Figure 3 illustrates an example of a preliminary and detailed concept.
Designers using Rhino chose MS PowerPoint or Word to explore preliminary concepts,
and Rhino to elaborate and detail the design. To identify the statistical significance of the
effect of design tools, design problems and designers on the number of concepts
generated, we have used general linear modelling (GLM) in an Analysis of Variance
(ANOVA) (discussed in Section 3.3). The results reveal that the influence of design tools
on the preliminary concept (F (2, 5) = 0.50, p = 0.636) and detailed concept (F (2, 5) = 4,
design tools, the impact of the design problem and the designer is not discussed unless
any significance is noted in the statistical analyses. However, the complete results along
[image:21.595.94.523.151.337.2]with the data sets are documented and presented in Appendix 4.
Figure 3. An example of preliminary and detailed concepts generated for laptop security issues
Table 4. Number of preliminary concepts generated in the original and redesign experiments
Tools P1 P2 P3 P1’ P2’ P3’
Tablet 0 1 1 1 0 0
Rhino with MS
Word/PowerPoint (number
0 2 (2) 10
(10)
of concept generated in MS
Word/PowerPoint in
bracket)
Notes-taker 7 7 0 1 0 0
Even though the influence of design tools on concepts generation is insignificant, in Table
4, we derived two critical observations (bold numbers): (1) The number of preliminary
concepts generated through the Tablet tool is substantially lower than with the other two
tools and (2) Irrespective of the design tools, the number of preliminary concepts
generated in the redesign process is substantially lower. The reason for the fewer number
of preliminary concepts in the Tablet tool could be the designers’ intention to detail every
concept in the Tablet tool. This behaviour could be due to the ‘point-and-draw-on-screen’
interface provided by the Tablet tool which might have led to design fixation. This
behavioural change could have had a severe impact on the design outcomes, based on the
argument of Srinivasan and Chakrabarti (2010) that variety in the concepts increases the
novelty of the design outcomes. We will discuss the redesign outcomes along with the
[image:22.595.87.511.626.769.2]factors discussed in the following hypotheses.
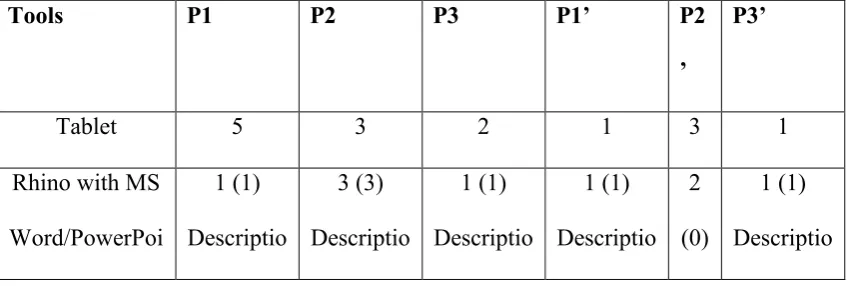
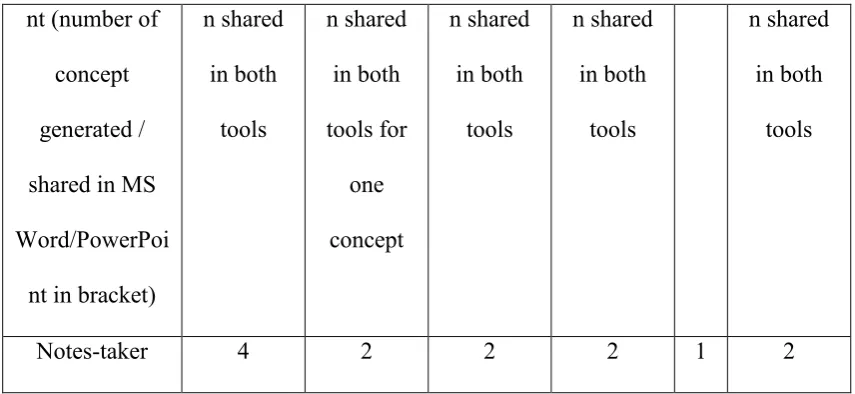
Table 5. Number of detailed concepts generated in the original and redesign experiments
Tools P1 P2 P3 P1’ P2
’
P3’
Tablet 5 3 2 1 3 1
Rhino with MS
Word/PowerPoi
1 (1)
Descriptio
3 (3)
Descriptio
1 (1)
Descriptio
1 (1)
Descriptio 2
(0)
1 (1)
nt (number of
concept
generated /
shared in MS
Word/PowerPoi
nt in bracket)
n shared in both tools n shared in both tools for one concept n shared in both tools n shared in both tools n shared in both tools
Notes-taker 4 2 2 2 1 2
For the detailed concepts, it is good to note that the Tablet tool dominates the other tools
in the number of detailed concepts, since producing fewer concepts both in the
preliminary and detailed concepts might have a significant impact on the design
outcomes. The number of detailed concepts in Rhino is lower compared to the other tools.
This trend could be due to the individual or combined influences of premature fixation,
as pointed out by Robertson et al. (2007), the one hour approximate experiment timing,
and the designers’ skills in using Rhino software. However, it has been observed that
using other word processing software such as MS PowerPoint or MS Word along with
Rhino reduced the influence of these factors. The total number of concepts generated in
the Notes-taker is substantially higher than when using other tools. This trend could be
due to the natural paper and pencil interface which provides fluidity in designing without
any limitations from software features. Overall, the statistical results indicate that the
three conceptual design tools chosen do not have a significant impact on the number of
design concepts generated. So the first hypothesis (H1) is rejected.
H2. Conceptual design tools have a significant impact on the amount of time spent
[image:23.595.84.512.69.266.2]by the designer across design stages.
the three different tools, in the original and redesign experiments. The overall time spent
with Rhino with MS Word/PowerPoint is much higher than with the other tools. It is
interesting to see the variation of the overall time taken. The Notes-taker tool has both
extremes of minimum and maximum time taken. The trend of overall reduction in the
time taken in the redesign, rather than the original experiments, is observed clearly with
the Notes-taker tool. Figures 4 and 5 show the distribution of time taken across the design
stages combining all original and redesign experiments, respectively. Video protocols
have been used to segment and record the amount of time spent on each design stage.
From Figures 4 and 5 it can be inferred that the Notes-taker tool had took the maximum
time in the original design process due to the significant amount of time spent on the
requirement generation process compared to the other two tools. The Notes-taker tool got
very little time in the redesign process because of less time spent on requirement
generation and detailing processes on the concept chosen.
Table 6. Total time taken by the designers in original and redesign experiments (in minutes)
Tools P1 P2 P3 P1 ’
P2 ’
P3 ’
Mi n
Averag e origina
l time
Averag e redesig n time
Ma x
Tot al
Rhino with
MS
Word/Power
Point (time
spent MS
Word/Power
Point in
bracket)
93
(40
) 52
(20
)
75
(23) 93
(4
8) 46
(7) 69
(4
5)
46 73.3 69.3 93 428
Notes-taker 64 66 103 39 14 26 14 77.7 26.3 103 312
In the original experiments, the distribution for Rhino with MS Word/PowerPoint varied
significantly as compared to the other two tools, especially in the ‘conceptual elaboration’
and ‘detailing the concept chosen’ stages. The fixation highlighted in the previous
hypothesis in using Rhino is indicated by the amount of time spent on detailing chosen
concepts. However, in the redesign experiments, the difference between the amount of
time spent in the ‘conceptual elaboration’ and ‘detailing chosen concept’ stages is
substantially reduced (10% compared to 32%) in using Rhino with MS
Figure 4. Distribution of time spent on design activities in original experiments (all nine combined)
Figure 5. Distribution of time spent on design activities in redesign experiments (all nine combined)
With the available data, ANOVA is carried out using GLM. The results revealed
statistically significant differences among the design tools and designers in relation to the
total time taken to solve design problems (FDesign_tool (2, 5) = 6.85, p = 0.037; FDesigner (5,
5) = 15.02, p = 0.005). A very high R2 value (R-Sq = 95.69%) indicates how well the
model predicts responses. Figure 6 represents the mean plot for the total time with
reference to the design tool, design problem and designer. Compared to the other tools,
[image:26.595.86.342.577.748.2]Figure 6. Mean plot for total time with reference to design tool, design problem and designer
The test results revealed statistically insignificant differences among the design tools in
relation to the time spent on requirement generation activity (F (2, 5) = 0.56, p = 0.603).
However, the influence of the designer on the time spent on requirement generation
activity is statistically significant (F (5, 5) = 7.38, p = 0.023). Out of 18 experiments, in
nine experiments, the designers did not spend much time on preliminary idea generation
activity. So, no influence of design tools on preliminary idea generation is observed. Also,
the influence of the design tools on the time spent in concept elaboration and evaluation
activity are statistically insignificant (Fconcept_elaboration (2, 5) = 0.17, p = 0.849); (FEvaluation
(2, 5) = 0.38, p = 0.699). The ANOVA test results revealed statistically significant
differences among the design tools in relation to the time spent on detailed design activity
(F(2,5)=5.93, p=0.048).
In redesign experiments, the designers spent an average of 30-35% of the time, while
using the Notes-taker and the Tablet tools in understanding, evaluating and selecting
previous designs. This shows that the designers are keen to understand previous designs
from the captured documents. However, with Rhino with MS Word/PowerPoint, the
designers on average spent only 16% of the time in understanding previous work. The
reasons for this time variation are discussed along with the design representation
elaborated in the next hypothesis. The significant amount of time spent in the ‘concept
elaboration’ stage with Notes-taker could be one reason for the higher number of concepts
generated, as explained in the previous hypothesis. These results indicate that conceptual
design tools have a significant impact on the total time spent by the designers on solving
design problems and the time spent in the detailed design activity. Also, the influence of
requirement generation activity are identified.
It is notable that the percentage of time spent by the designers in the ‘preliminary concept’
stage is low and did not vary considerably across different tools. Further research is
required to explore this phase in detail in order to understand the impact of this stage on
design outcomes.
H3. Conceptual design tools have a significant impact on the representation
(graphical and textual format) of captured requirements and concepts in terms of
functional, behavioural and structural elements.
H4. The amount of time taken to capture requirements and concepts has a significant
impact on the representation of captured documents.
Captured documents were analysed to segregate the number of words and distinguishable
components used to represent concepts. Figure 7 illustrates the textual and graphical
classification into function, behaviour and structure elements. It should be noted that the
words and diagrams were analysed as they were, and no further interpretation was carried
out in the analyses. Table 7 shows the textual and graphical content in terms of functional,
behavioural and structural elements in the captured requirements, in both the original and
From the Tablet
Textual (number of words in bracket)
Graphical (number of components in bracket) Function Trimming – less time, safety,
hygiene, control over cutting
height of hair (11)
-
Behaviour Adjustment knob; length adjustment screw;
Adjustment (6)
-
Structure Razors; handle (2) Handle, handle grip, two screws, razors, knob, supporting structure,
[image:29.595.99.500.68.589.2]comb (8)
Figure 7. Illustration of the textual and graphical classification into function, behaviour and structure elements
Tools Original Redesign
Textual Graphical Textual Graphical
Fun. Beh. Str. Fun. Beh. Str. Fun. Beh. Str. Fun. Beh. Str.
Tablet 80 36 31 0 0 0 85 48 8 0 0 0
Rhino with MS Word/Pow erPoint (MS Word/Pow erPoint representat ion is given in bracket) 43 (43) 32 (32) 80 (80 )
0 2 (2) 5
(5) 48 (48) 59 (59) 95 (95 )
0 0 0
Notes-taker
394 55 78 1 0 24 46 0 4 0 0 1
The influence of the design tools on the textual representation of functional and
behavioural requirements is statistically insignificant (Ftextual_function (2,5) = 1.97, p =
0.234; Ftextual_behavioural (2,5) = 1.65, p = 0.282). However, the influence of the designer on
the textual representation of behavioural requirements is statistically significant
(Ftextual_behavioural (5,5) = 15.19, p = 0.005). The influence of the design tools on the textual
representation of structural requirements is statistically significant (Ftextual_structure (2,5) =
6.30, p = 0.043). No statistical influence of the design tools on the representation of
the requirements graphically in any of these three tools. The observations from Table 7
are the following:
Overall, textual descriptions dominate, in representing problem analyses and
requirements, for all three tools.
The textual descriptions of functional requirements in the original experiments are
substantially higher in the Notes-taker than in the other tools. This could be due
to the substantial amount of time spent (about 32%) using this tool at the
‘requirements generation’ stage (Figure 4).
In the original experiments with the Notes-taker tool, graphical elements are used
primarily to represent the requirements of structural elements.
Table 8 shows the number of textual and graphical contents in terms of the functional,
behavioural and structural elements of the captured preliminary concepts in the original
and redesign experiments.
Tools Original Redesign
Textual Graphical Textual Graphical
[image:32.595.90.550.71.549.2]Fun. Beh. Str. Fun. Beh. Str. Fun. Beh. Str. Fun. Beh. Str.
Tablet 1 27 0 0 3 1 0 0 5 0 0 0
Rhino with
MS
Word/Pow
erPoint
(MS
Word/Pow
erPoint
representat
ion is
given in
bracket) 6
(6)
66 (66)
11
(11
)
0 0 0 0 85
(85)
0 0 0 0
Notes-taker
11 27 9 0 0 42 4 28 4 0 0 0
The influences of the design tools on the textual representation of functional, behavioural
and structural preliminary ideas is statistically insignificant (Ftextual_functional (2,5) = 0.95, p
= 0.448; Ftextual_behavioural (2,5) = 1.60, p = 0.29; Ftextual_structure (2,5) = 0.22, p = 0.812). With
all the three design tools, there is no graphical function and behaviour representation of
preliminary ideas. Also in the eighteen experiments conducted, in only two experiments
did the designer minimally uses the tool to the represent the graphical structure of
The results in Table 4 indicate that the number of preliminary concepts is higher
in Rhino with MS Word/PowerPoint and the Notes-taker tools. With reference to
this observation, it is surprising to note that Rhino along with word processing
software such as MS Word or Power Point provides more descriptions of
preliminary concepts both in the original and redesign experiments. This could be
due to the designer’s perception that there may be limitations in expressing the
design intent. This is because even in describing fewer concepts, the designers
had to put in a lot of effort to describe these concepts in Rhino.
As noted in the case of requirements, graphical elements are used to represent
mainly the structural elements of preliminary concepts in the original experiments
with the Notes-taker tool.
Table 9 shows the textual and graphical content in terms of the functional, behavioural
and structural elements of the captured detailed concepts in the original and redesign
experiments.
Tools Original Redesign
Textual Graphical Textual Graphical
Fun. Beh. Str. Fun. Beh. Str. Fun. Beh. Str. Fun. Beh. Str.
Tablet 6 60 70 27 4 101 18 86 32 0 3 70
Rhino with MS Word/Pow erPoint (MS Word/Pow erPoint representat ion is given in bracket) 9 (9) 137 (137 ) 34 (34 )
0 0 29
(4)
0 114
(114) 38
(38
)
0 1 (0) 14
(0)
Notes-taker
39 310 193 0 8 117 5 77 50 0 0 56
The influence of the design tools on the textual representation of functional, behavioural
and structural detailed concepts is statistically insignificant (Ftextual_functional (2,5) = 0.75, p
= 0.520; Ftextual_behavioural (2,5) = 2.40, p = 0.186; Ftextual_structure (2,5) = 0.59, p = 0.588). In
eighteen experiments, the function of the detailed concept is categorized only once, and
the behaviour of the detailed concepts is categorized only in six design experiments in
graphical representation. Hence, the statistical significance is not identified with these
parameters. The influence of the design tools on the graphical representation of structural
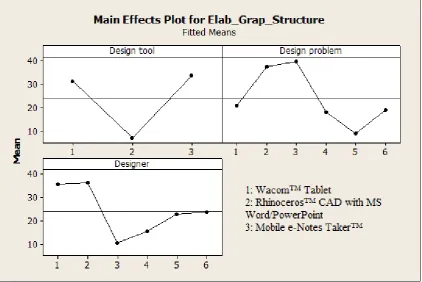
Figure 8 describes the mean plot for the graphical representation of the structure of
detailed concepts with reference to design tools, design problems and designers. Figure 8
points out that the number of graphical components to illustrate the structure of detailed
[image:35.595.87.510.182.464.2]concepts is very low with Rhino with MS Word/PowerPoint tool.
Figure 8. The mean plot for the Graphical Representation of the Structure of Detailed Concepts with reference to design tools, design problems and designers
The observations from Table 9 are the following:
The Tablet is the only tool in which functions are graphically represented in the
original experiments. Figure 9 illustrates this statement through the graphical
Figure 9. Illustration of graphical function representation (play, volume and skip functions)
Both in the original and redesign experiments, graphical structural components
are fewer in Rhino with MS Word/PowerPoint compared to those in the other
two tools. Since only a few distinguishable structural components with precision
are captured in Rhino with MS Word/PowerPoint, the factors mentioned by
Robertson et al. (2007) such as large amount of detail and interconnectedness and
the complexity of the model influencing premature fixation might be
questionable. Also, the fact that fewer distinguishable components were not
captured could be due to the designers finding it difficult to express them and felt
this might clash with thinking.
They are more textual descriptions of function, behaviour and structural elements
with the Notes-taker tool in the original experiments. However, in the redesign
experiments, the textual descriptions in all the elements are substantially reduced.
Comparing Table 9 with reference to Figure 4 reveals that even with a lower
proportion of 58% of time consumed in the elaboration and detailing of concepts
in the original experiments with the Notes-taker, the number of distinguished
elements captured is substantial. But with 72% of time consumed in the same
stages with Rhino with MS Word/PowerPoint, there are fewer distinguished
represent concepts does not necessarily have a higher impact on the wider
representations of function, behaviour and structure elements. The level of
precision necessary in articulating the concepts could be a reason for the resistance
to change and a wide representation with Rhino with MS Word/PowerPoint. In
other words, only precision in representation (especially structure elements) is
increased with more time spent, possibly at the cost of completeness.
The observations indicate that conceptual design tools have a significant impact on the
textual representation of structural requirements, and the graphical representation of the
structural elements of detailed concepts. Also, the influence of the designer on the textual
representation of behavioural requirements is statistically significant. The amount of time
taken to capture each concept does have an impact on the representation of the captured
concepts, but in varying levels of precision and expression elements.
H5. The formats of the representation of captured documents have a significant impact
on reinterpretation in the redesign phase.
Two parameters are used to test this hypothesis. These are: (i) the percentage of time
spent on the reinterpretation of all the original design documents and (ii) the issues
incurred during the reinterpretation process. Table 10 compares the percentage of time
spent in the reinterpretation of the entire original document with the total number of
concepts and the percentage of statements captured with reference to the designer’s
articulated statements in the original design experiments. The percentage values of the
statements captured in the original experiments with reference to designer articulated
statements are taken from Annamalai Vasantha and Chakrabarti (2010). Except with
Rhino with MS Word/PowerPoint, the amount of time spent by the designer in the
reinterpretation of the original captured documents is substantial in the redesign
with the Notes-taker could be lower in relation to the amount of content captured
textually. In Rhino with MS Word/PowerPoint, the time spent in reinterpretation could
be less due to the significantly lower percentage of statements captured in the original
experiments.
Table 10. Percentage of time spent in the reinterpretation of captured original documents in the redesign experiments
Tools Percentage of time spent in reinterpretation of all the original
documents
Total number of concepts
Percentage of statements captured in original design documents with
reference to designer articulated statements
(Annamalai
Vasantha and
Chakrabarti, 2010)
Preliminary Detail
Tablet 31 2 10 35.8
Rhino with MS
Word/PowerPoint
17 12 5 23.4
In order to identify issues with the reinterpretation process, video protocols were
analysed to find the problems mentioned and the symptoms expressed by the re-designers.
The original documents were thoroughly used by the designers in all the redesign
experiments, irrespective of the tools used. The designers spent considerable time in
understanding the work of the previous designers. Table 11 lists and groups issues in the
categories of understanding, ambiguity, assumptions and repetition. Observations from
Table 11 are the following:
There are more issues related to the understanding of original designs than for
ambiguity, assumption and repetition issues.
Understanding the original designer’s intention from drawings is a big issue noted
while using the Tablet.
Issue related to ‘didn’t understand fully the previous designer’s concept’ is
observed across all the tools. Most of the time, these kinds of concepts were
ignored during redesign.
Natural handwriting as an input provided by the Tablet and the Notes-taker
created problems in reinterpretation due to poor writing and sketches.
The improper labelling of concepts seems to be a problem during reinterpretation
across all the tools. There are a few times when the re-designers understood the
concept with the title alone. This designer-behaviour shows that the designers
were interested in understanding only the overall working principle of the
concepts, rather than looking into the details of the concepts.
Comparing Tables 9 and 11 shows that the use of more elements to describe the
detailed concepts in the original documents through the Notes-taker does not lead
With these observations and issues identified, we concluded that the formats of the
representation of captured concepts have a significant impact on reinterpretation in the
redesign phase.
Table 11. Issues identified during reinterpretation of original documents in redesign experiments
Issues with Aspects Number of instances
Tablet Rhino with
MS
Word/Power
Point
Notes-taker
Understandin
g
Designer’s intention from
drawing
11 3 0
Technical aspect of the
concepts from drawing
1 2 0
Didn’t understand fully the
previous designer’s concept
6 4 6
Poor hand writing 5 0 3
Poor sketch 0 1 (used MS
Word)
3
Terminology used 2 1 0
Not labelled the concept 2 3 2
Rationale of evaluation value 1 1 0
Evaluation criteria due to
poor labelling
1 0 1
Sub-total 29 16 19
Ambiguity Choosing previous concept
due to representation of tick
mark in all the concepts
1 0 0
About behaviour of a concept 0 0 1
Sub-total 1 0 1
Assumption About a task which might
have been done or not done
by the original designer
1 2 0
Behaviour of a concept 1 0 0
Evaluation method used 1 0 0
Similarity with the previous
concept
1 0 0
Sub-total 4 2 0
Repetition Derived the same function
done by the previous
designer
1 1 0
Redraw previous sketch for
better understanding
1 0 1
Sub-total 2 1 1
Overall total 36 19 21
H6. Designer adaptability to a design tool has a significant impact on the
To verify this hypothesis, video protocols are analysed to note explicit mention of a
designer’s comfort and discomfort during interaction with the design tools, both during
original and redesign experiments. Observations from these analyses are listed below.
Using the Tablet,
One designer requested for a mouse input device along with the Tablet pen.
One designer mentioned that he liked the tablet and said that it helped to design
sketches faster and better.
One designer could not modify the previous file because the layers used were
inaccessible due to the storage format.
One designer spent about two minutes for precisely drawing a single line and
expressed that it was difficult to draw a line.
Using Rhino with MS Word/PowerPoint,
One designer said that he could do conceptual designing better on paper.
Using the Notes-taker,
One designer expressed unhappiness about his sketches made using this tool.
One designer had problems with the pen interface because he had to apply
pressure to draw.
Other tool-features such as image resolution, working area size and tool inclination are
not mentioned as a problem by any of the designers. The aforementioned statements
indicate that the designers are conscious about the tools they use during the conceptual
design. However, only a few issues highlighted sporadically by the designers show that
the designers had become accustomed to the conceptual design tools in terms of the ability
Therefore, we argue that the representation and reinterpretation of the captured concepts
might not have been influenced by designer adaptability to these design tools; all the
designers became quickly accustomed to the tools so that there was no significant
variability in adaptation visible across tools.
5. Discussion
Figure 10 summarizes the statistically significant research findings in the influence
diagram from analyses of the experimental results. In this globalised competitive design
environment, designers are increasingly being pressured to create quality innovative
products in faster cycles. In this stressful environment, choosing the right tool could have
a strong influence on the amount of time spent by the designers to solve the given problem
without influencing the design outcomes (e.g. the number of preliminary and detailed
design concepts). The variation of time spent is largely accounted for in the detailed
design activity. As the design tools do not statistically influence the number of
preliminary and detailed design concepts, more in-depth investigations are required to
understand the influences of product, process and environment. The statistical influences
of design tools on the textual representation of structural requirements and the graphical
representation of the structure of detailed concepts show that the designers have to
understand these behavioural changes while using different tools, because it can
subsequently have an impact on the reinterpretation process during the redesign phase.
The results show that the generated redesign concepts are fewer, both in the preliminary
and detailed, compared to those in the original experiments; this is irrespective of the
design tool used. The potential causes for this designer-behaviour include the following:
The percentage of the capture of the designer’s articulation (23.4% - 40.5% in the
the designer’s articulation is the ratio of the ‘designer’s captured statements in
design documents to the ‘designer’s articulated (expressed explicitly) statements’.
Even though each designer went thoroughly through the original design
documents, due to this low capture of the designer’s intention in the original
document, the designer only acquired the overall working principle of the
concepts rather than their details.
A fixation with the original concepts is often noted in the experiments. This could
be due to the redesigners being overly impressed by the original concepts.
The redesign itself seems to be a restricted process due to the problems identified
in the originally chosen concept being the only ones addressed. The designers do
not take the opportunity of considering the extensive solution search space
available in the original design.
Also, many original concepts are ignored during redesign due to the lack of or
partial understanding of the concepts. The ambiguity of the concepts is also a
factor.
Low motivation on the part of the re-designer could be another reason for the