303
Benchmark of experimental techniques for measuring and controlling
suction
A . TA R A N T I N O1, D. G A L L I P O L I2, C . E . AU G A R D E3, V. D E G E N NA RO4, R . G O M E Z5, L . L A L O U I6,
C . M A N C U S O7, G . E L M O U N TA S S I R1, J. J. M U N O Z8, J. - M . P E R E I R A9, H . P E RO N6, G . P I S O N I1 0,
E . RO M E RO1 1, A . R AV E E N D I R A R A J1 2, J. C . RO JA S2, D. G . TO L L3, S . TO M B O L ATO1 0
a n d S . W H E E L E R2
The paper presents a benchmarking study carried out within the ‘Mechanics of Unsaturated Soils for Engineer-ing’ (MUSE) network aimed at comparing different tech-niques for measurement and control of suction. Techtech-niques tested by the eight ‘Mechanics of Unsaturated Soils for Engineering’ research teams include axis-translation (pressure plate and suction-controlled oedometer), high-capacity tensiometer and osmotic technique. The soil used in the exercise was a mixture of uniform sand, sodium bentonite (active clay) and kaolinite (non-active clay), which were all commercially available. Samples were pre-pared by one team and distributed to all other teams. They were normally consolidated from slurry under one-dimen-sional conditions (consolidometer) to a given vertical stress. The water retention characteristics of the initially satu-rated specimens were investigated along the main drying path. Specimens were de-saturated by applying suction through the liquid phase when using an axis-translation technique or osmotic method and de-saturated by air-dry-ing, when suction was measured using high-capacity tensi-ometers. In general, the same technique was tested by at least two teams. The water retention curves obtained using the different techniques are compared and discrepancies are discussed in the paper.
KEYWORDS: laboratory tests; partial saturation; suction
Cette communication pre´sente une e´tude comparative re´alise´e dans le cadre du re´seau MUSE, dans le but de comparer diffe´rentes techniques de mesure et de re´gula-tion de l’aspirare´gula-tion. Parmi les techniques teste´es par les huit e´quipes de chercheurs de MUSE, indiquons la trans-lation d’axes (plaque de pression et oedome`tre a` succion controˆle´e), un tensiome`tre a` capacite´ e´leve´e, et une tech-nique osmotique. Le sol utilise´ pour cette taˆche e´tait un me´lange de sable uniforme, de bentonite de sodium (argile active), et de kaolinite (argile non active), tous disponibles dans le commerce. Une e´quipe pre´parait les e´chantillons, qu’elle distribuait ensuite a` toutes les autres e´quipes. Ces e´chantillons e´taient ge´ne´ralement consolide´s a` partir de boues dans des conditions unidimensionnelles (consolidome`tre), jusqu’a` une contrainte verticale donne´e. On recherchait ensuite les caracte´ristiques de retenue de l’eau de spe´cimens initialement sature´s, le long du che-min de se´chage principal, et on proce´dait a` la de´satura-tion de spe´cimens par l’applicade´satura-tion d’une aspirade´satura-tion par se´chage a` l’air, succion e´tant mesure´e avec des tensio-me`tres a` capacite´ e´leve´e. En ge´ne´ral, la meˆme technique e´tait teste´e par un minimum de deux e´quipes. On proce´-da ensuite a` une comparaison des courbes de retenue d’eau obtenue avec les diffe´rentes techniques : les diver-gences sont discute´es dans la communication.
INTRODUCTION
Suction plays a key role in the mechanical and hydraulic behaviour of unsaturated soils and its measurement is there-fore an essential requirement for predictive purposes.
Differ-ent techniques are available for suction measuremDiffer-ent and control, which are based on equilibrium through either the liquid or vapour phase. Consistency among different techni-ques and reproducibility of suction measurements among different laboratories are crucial in the implementation of unsaturated soil mechanics into routine engineering practice. The paper tackles this problem by comparing four techni-ques for suction measurement and control, namely the pressure plate, the axis-translation oedometer, the high-capa-city tensiometer and the osmotic method, which fall into the category of liquid equilibrium. Eight different laboratories across Europe were involved in this ‘round robin’ benchmark study with the aim of estimating confidence level of suction measurement. To cross-check experimental results, tests using the pressure plate, the axis-translation oedometer and the high-capacity tensiometer were replicated by two differ-ent laboratories. Only the osmotic method was tested by a single laboratory.
The eight laboratories participating in this benchmark study were participants in the ‘Mechanics of Unsaturated Soils for Engineering’ (MUSE) project. This is a major research and training network funded by the European Union involving six European universities as full partners, three European universities as associated partners and five indus-trial partners. Details about the project can be obtained by visiting the MUSE website (2005). The academic institutions involved in this benchmarking study were: University of
Manuscript received 1 March 2010; revised manuscript accepted 29 November 2010.
Discussion on this paper closes on 1 September 2011, for further details see p. ii.
1Department of Civil Engineering, University of Strathclyde, UK
2Department of Civil Engineering, University of Glasgow, UK
3School of Engineering and Computing Sciences, Durham
University, UK
4Schlumberger, Pau, France
5Departament d’Enginyeria del Terreny, Cartogra`fica i Geofı´sica,
Universitat Polite`cnica de Catalunya, Barcelona, Spain
6E´ cole Polytechnique Fe´de´rale de Lausanne, EPFL, Switzerland
7Dipartimento di Ingegneria Idraulica, Geotecnica ed Ambientale,
Universita` di Napoli Federico II, Napoli, Italy
8Universidad Nacional de San Juan Instituto de Investigaciones
Antisı´smicas ‘Ing. Aldo Bruschi’, San Juan, Argentina
9Universite´ Paris-Est, Laboratoire Navier – CERMES, Ecole des
Ponts ParisTech, Marne-la-Valle´e, France
10
Dipartimento di Ingegneria Meccanica e Strutturale, Universita` degli Studi di Trento, Italy
11Geotechnical Laboratory, Departament d’Enginyeria del Terreny,
Cartogra`fica i Geofı´sica, Universitat Polite`cnica de Catalunya, Barcelona, Spain
Glasgow in the UK (MUSE coordinator), Durham University in the UK, Universita` di Trento in Italy, E´ cole Nationale des Ponts et Chausse´es in France, Universitat Polite`cnica de Catalunya in Spain, Universita` di Napoli ‘Federico II’ in Italy, E´ cole Polytechnique Fe´de´rale de Lausanne in Swizter-land (associated partner) and University of Strathclyde in the UK (associated partner). The acronyms used to identify the different academic institutions are given later in Table 2.
The soil used in this experimental programme was pre-pared by mixing sand, kaolinite and bentonite. To ensure that ‘identical’ specimens were tested, samples were prepared at UNITN and shipped to the MUSE teams, with the exception of one team that only produced samples in its own laboratory. Each laboratory was then requested to determine the water retention curve (WRC) starting from the saturated condition (main drying WRC).
MATERIAL AND SAMPLE PREPARATION
The soil used in the exercise was obtained by mixing three different geomaterials, a uniform sand (Hostun sand), an active clay (MX-80 sodium bentonite) and a non-active clay (Speswhite kaolin), which are all commercially avail-able (Tavail-able 1). The mixture made it possible to prepare a soil with a ‘suitable’ WRC by modifying the mass fraction of each component of the mixture. The mixture was required to generate a WRC having an air-entry suction not exceed-ing 100–200 kPa, as the suction range of several axis-trans-lation apparatuses used in the benchmarking exercise was limited to 500–600 kPa. It was also desirable that the slope of the WRC beyond the air-entry suction was not steep, as small errors in the values of suction controlled or measured would have produced very scattered data in the WRC. Finally, the mixture was expected to generate a WRC devel-oping over a large range of suction so that the same mixture could be used for matric suction measurement/control (equi-librium by way of liquid transfer) and total suction measure-ment/control (equilibrium by way of vapour transfer), even if this benchmark study essentially focuses on matric suction. Preliminary tests were carried out at UNITN by testing different mixtures and it was found that the following composition produced the mixture with the aforementioned features: 70% Hostun sand, 20% MX80 bentonite and 10% Speswhite kaolin.
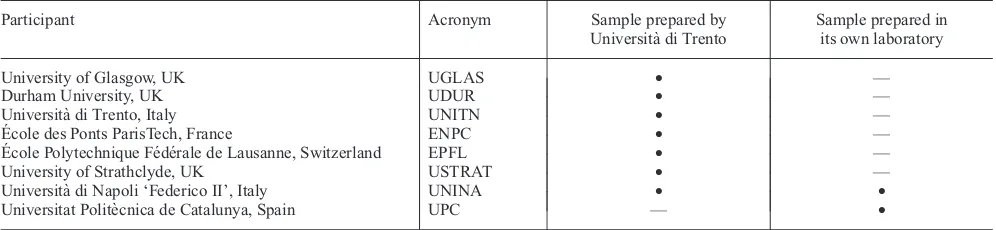
The majority of samples were prepared at UNITN and shipped to seven of the eight teams involved in this study. One team only produced the samples in its own laboratory (UPC), whereas UNINA tested samples produced both by UNITN and in its own laboratory. Samples used by the different partners are summarised in Table 2. In the follow-ing, the term ‘sample’ will be used only for the soil prepared within the oedometer/consolidometer and the term ‘speci-men’ will refer to the material used to determine the WRC.
The procedure for sample preparation at UNITN is briefly illustrated below. The detailed procedure is described in a MUSE document (Tarantino, 2007) and can be made avail-able on request. The three soils were first dry mixed using a spatula. A small amount of dry mixture was placed in a plastic bowl (60 g) and about 50 g of demineralised water was added. The soil and the water were mixed together using the spatula to squeeze lumps. This procedure was repeated six times until all the dry soil was mixed with water. At this stage, the soil–water mixture was quite dense and additional water was added to reach a water content of 128%. The slurry was poured into a one-dimensional con-solidometer about 110 mm in diameter and 150 mm high. Vertical pressure was increased at the rate of 3.3 kPa/h and, when the final vertical stress of 101 kPa was reached (after 31 h), the vertical pressure was maintained constant for 41 h. At the end of consolidation the sample was unloaded as fast as possible to limit swelling and a water content of 0.53 was recorded. The sample was finally put in a plastic bag, in turn put in an airtight plastic container and stored in a high-humidity room until shipping.
UPC consolidated the sample from slurry directly in the axis-translation oedometer subsequently used to determine the WRC. The slurry was consolidated by applying a ramp from 0 to 100 kPa over 1.5 days and by keeping the 100 kPa vertical pressure constant for the subsequent 4 days. UNINA, in addition to the sample prepared by the UNITN, tested a sample prepared in its own laboratory using the same procedure as adopted by UNITN.
APPARATUS AND EXPERIMENTAL PROCEDURES Teams using the same type of equipment (pressure plate, axis-translation oedometer and high-capacity tensiometer) were invited to use their own experimental procedure. There
Table 1. Index properties of soils used to prepare the mixture
Clay: % Silt: % Sand: % wp wl Gs d50: mm
Hostun sand (De Gennaroet al., 2004) — — 100 — — 2.65 0.38
MX-80 bentonite (Tang & Cui, 2005) 60 40 — 35 519 2.76 —
Speswhite kaolin (Tarantino & Tombolato, 2005)
[image:2.595.57.555.661.776.2]80 20 — 32 64 2.61 —
Table 2. Samples used by different teams
Participant Acronym Sample prepared by
Universita` di Trento
Sample prepared in its own laboratory
University of Glasgow, UK UGLAS • —
Durham University, UK UDUR • —
Universita` di Trento, Italy UNITN • —
E´ cole des Ponts ParisTech, France ENPC • —
E´ cole Polytechnique Fe´de´rale de Lausanne, Switzerland EPFL • —
University of Strathclyde, UK USTRAT • —
Universita` di Napoli ‘Federico II’, Italy UNINA • •
Universitat Polite`cnica de Catalunya, Spain UPC — •
is high variability between procedures adopted across geo-technical laboratories and this variability was therefore part of the benchmark study. All tests were carried out in tem-perature-controlled rooms.
Pressure plate (EPFL, UGLAS, USTRAT)
Pressure plate tests were performed by EPFL and UGLAS to determine the main drying WRC. USTRAT only applied a single level of suction to three ‘identical’ specimens to investigate the influence of contact pressure on the water retained at a given suction.
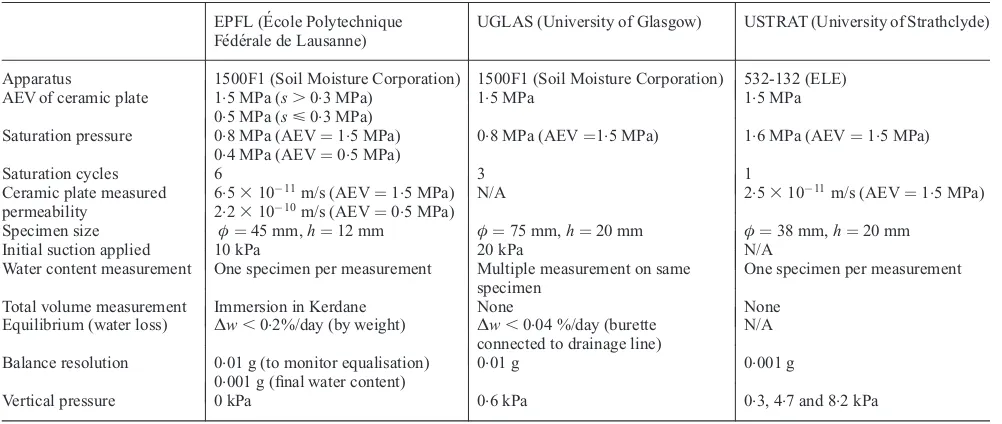
[image:3.595.42.543.566.778.2]Commercial equipment was used by all teams, as sum-marised in Table 3. The porous ceramic plate was saturated by filling the cell with de-aired water and then applying a positive pressure to force water to flow through the ceramic, while maintaining the pressure underneath the ceramic plate at atmospheric pressure. This procedure was repeated several times until the permeability of the ceramic attained a constant value. The applied pressures and the numbers of saturation cycles adopted by different teams are reported in Table 3.
Sizes of specimens, cut and trimmed from the samples provided by UNITN, are given in Table 3. EPFL placed eight specimens on the plate and no vertical pressure was applied. UGLAS and USTRAT placed three specimens on the ceramic plate, and a small vertical pressure was applied to improve contact (0.6 kPa for UGLAS and 0.3, 4.7 and 8.2 kPa respectively for USTRAT). In all pressure plate tests, a tray filled with water remained within the pressure cham-ber to increase the relative humidity and minimise moisture content losses due to evaporation.
Each level of suction was maintained for a sufficient time to allow for moisture equilibration, which was assessed using different approaches. EPFL regularly weighed speci-mens (twice a week for low suction steps, once a week for high suction steps) and equilibrium was considered to be reached once the rate of water content decrease was
˜w,0.2%/day. UGLAS monitored the burette connected to the water reservoir underneath the ceramic plate. An accep-table rate of burette water volume change was determined by weighing specimens on successive days during the first three suction steps and equilibrium was assumed to be reached when the rate of water content decrease was
˜w,0.04%/day. It should be noted that specimens tested at
EPFL and UGLAS have different heights, 12 and 20 mm respectively, and this results in different flow rates at a given ‘degree of suction equalisation’. For example, Terzaghi’s theory of consolidation for saturated elastic geomaterials (Atkinson, 1993) predicts that the flow rate per unit solid mass at the same degree of consolidation is inversely proportional to the square of specimen height. When speci-men height is increased from 12 to 20 mm, the flow rate decreases by 2.8 and this figure is not significantly different from the ratio between rates of water content decrease adopted by EPFL and UGLAS.
USTRAT did not monitor water content changes as the only purpose of this test was to investigate the effect of contact pressure. Suction was simultaneously applied to the three specimens uninterruptedly for 12 days.
At equilibrium at a given suction level, EPFL removed a single specimen from the pressure plate apparatus (with the exception of three specimens for the last suction steps) to determine water content and also air and total volume by immersion in Kerdane (Pe´ron et al., 2007). EPFL therefore adopted the approach of one-specimen–one-point. UGLAS used a single specimen to determine the entire WRC and water content at each suction level was back-calculated from the final water content. Measurement of the WRC at UGLAS was made in triplicate.
Axis-translation oedometer (UNINA and UPC)
The equipment used at UNINA is a Wissa oedometer (Wissa & Heiberg, 1969) modified to control matric suction (Rampino et al., 1999) and to measure water content changes (Rojas et al., 2007) whereas UPC used an oed-ometer designed and constructed in their own geotechnical laboratory (Hoffmann et al., 2005) (Table 4).
UNINA applied suction using the water-subpressure tech-nique (water pressure is maintained constant and air pressure is progressively increased to increase suction), whereas UPC applied suction using the air-overpressure technique (air and water pressure are initially increased simultaneously, then air pressure is maintained constant and water pressure is de-creased to increase suction) (Romero, 2001). To minimise air diffusion underneath the high-air-entry ceramic, the water pressure was raised to values greater than atmospheric (50 kPa for UNINA and in the range 100–490 kPa for UPC) according to Romero (2001).
Table 3. Summary of procedures adopted in pressure plate testing
EPFL (E´ cole Polytechnique
Fe´de´rale de Lausanne)
UGLAS (University of Glasgow) USTRAT (University of Strathclyde)
Apparatus 1500F1 (Soil Moisture Corporation) 1500F1 (Soil Moisture Corporation) 532-132 (ELE)
AEV of ceramic plate 1.5 MPa (s.0.3 MPa)
0.5 MPa (s<0.3 MPa)
1.5 MPa 1.5 MPa
Saturation pressure 0.8 MPa (AEV¼1.5 MPa)
0.4 MPa (AEV¼0.5 MPa)
0.8 MPa (AEV¼1.5 MPa) 1.6 MPa (AEV¼1.5 MPa)
Saturation cycles 6 3 1
Ceramic plate measured permeability
6.531011m/s (AEV¼1.5 MPa)
2.231010m/s (AEV¼0.5 MPa) N/A 2.5
31011m/s (AEV¼1.5 MPa)
Specimen size ö¼45 mm,h¼12 mm ö¼75 mm,h¼20 mm ö¼38 mm,h¼20 mm
Initial suction applied 10 kPa 20 kPa N/A
Water content measurement One specimen per measurement Multiple measurement on same
specimen
One specimen per measurement
Total volume measurement Immersion in Kerdane None None
Equilibrium (water loss) ˜w,0.2%/day (by weight) ˜w,0.04 %/day (burette
connected to drainage line)
N/A
Balance resolution 0.01 g (to monitor equalisation)
0.001 g (final water content)
0.01 g 0.001 g
The high-air-entry ceramic was saturated using two differ-ent approaches. At UNINA, water was forced to flow through the ceramic by increasing air pressure in the cham-ber while continuously flushing the water reservoir under-neath for 1 h. The water reservoir was then closed for another 1 h and this cycle was repeated until the measured permeability attained a constant value (Table 4). At UPC, de-aired water was forced to flow through the ceramic disc using a GDS Instruments pressure/volume controller (with no air–water interface) until permeability attained a value in the range between 1.0 and 7.031011m/s; that is the range of permeability of 1.5 MPa air-entry value (AEV) ceramics measured over 15 years at UPC. In addition, diffusion of air through the saturated ceramic disc was measured and it was checked that the coefficient of diffusion for air was lower than 531010m2/s (Romero, 1999; Airo` Farulla & Ferrari,
2005; Delageet al., 2008).
The pore-water volume change was measured by UNINA using a system of two double-walled burettes (Rojas et al., 2007), whereas a GDS pressure–volume controller was used by UPC to monitor the pore-water volume change. The saturation of the water drainage line was ensured by periodi-cally flushing the drainage line and the reservoir underneath the high-air-entry ceramic disc (every 1 h at UNINA and at 3-day intervals or when relatively high diffused air volu-metric rates were measured at UPC).
The specimen in the oedometer was initially loaded to 100 kPa net axial stress to avoid lateral shrinkage during drying. The procedure of air pressurisation at high degrees of saturation is discussed by Di Mariano et al. (2000), Romero (2001) and Delageet al.(2008).
Equilibrium was considered to be attained when no changes in volume were recorded and water content changed linearly with time. This is due to either air diffusion towards the water reservoir underneath the ceramic plate or water evaporation into the air pressure line (Airo` Farulla & Ferrari, 2005). In tests carried out at UNINA, the differential pres-sure transducer recorded a negative water-volume rate, sug-gesting that evaporation was the dominant mechanism, and a correction was made to account for evaporation effects according to Airo` Farulla & Ferrari (2005). In tests carried out at UPC, evaporation effects were negligible and no correction was made.
Osmotic method – ENPC
The WRC at ENPC was determined using the osmotic method (Cui & Delage, 1996; Delage et al., 1998). A partially saturated specimen was sealed in a tube-shaped cellulosic semi-permeable membrane having molecular
weight cut-off (MWCO) of 3500 (regenerated cellulose (RC) dialysis membrane, Spectra/Por 3, MWCO 3500) and im-mersed in an aqueous solution of PEG with molecular weight of 20 000. A magnetic stirrer was used in order to improve the kinetic exchange of water and ensure the homo-geneity of the PEG solution.
The value of PEG concentration was obtained by measur-ing the refractive Brix index (Br) of the PEG solution
cPEG¼ Br
90Br (1)
where cPEG is the PEG concentration in kg PEG/kg water.
To relate the PEG concentration to suctions, two relation-ships can be adopted. The first was proposed by Delage et al. (1998) based on data from Williams & Shaykewich (1969)
s¼11c2PEG (2)
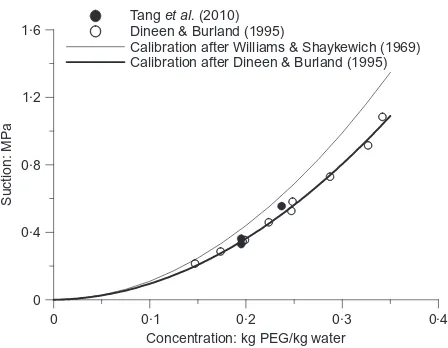
where s is the suction in MPa. The second relationship is based on calibration data by Dineen & Burland (1995) and was recently confirmed by Tanget al. (2010) using the same PEG and semi-permeable membrane used to desaturate the MUSE soil. The two calibration curves are shown in Fig. 1.
[image:4.595.144.468.71.228.2]A total of eight cylindrical specimens 19.5 mm in dia-meter and 261 mm high were cut from a sample prepared at UNITN. Each specimen was immersed into a PEG solu-tion for 4 days, removed from the tubular membrane to determine its mass and volume, and re-immersed in the PEG Table 4. Summary of procedures adopted in axis-translation oedometer testing
UNINA (Universita` di Napoli) UPC (Universitat Polite`cnica
de Catalunya)
Apparatus Rampinoet al.(1999),
Rojaset al.(2007)
Hoffmannet al.(2005)
AEV of ceramic plate 0.5 MPa (Soil Moisture
Corporation)
1.5 MPa (Soil Moisture Corporation)
Saturation pressure 0.65 MPa 2 MPa (AEV¼1.5 MPa)
Saturation cycles 6 1
Specimen size ö¼79 mm,h¼25 mm
(UNINA)
ö¼79 mm,h¼15 mm
(UNITN)
ö¼50 mm,h¼12 mm
Ceramic plate measured permeability
2.631010m/s 1 to 731011m/s
0 0·1 0·2 0·3 0·4
Concentration: kg PEG/kg water 0
0·4 0·8 1·2 1·6
Suction: MP
a
Tang (2010) Dineen & Burland (1995)
Calibration after Williams & Shaykewich (1969) Calibration after Dineen & Burland (1995)
et al.
Fig. 1. Calibration curve relating PEG concentration to the osmotically generated suction
[image:4.595.322.546.577.751.2]solution using a new membrane. Once the weight of speci-men attained a stable value, typically after 9 to 12 days, final water content was determined by oven-drying and the total volume was determined by immersion in Kerdane.
High-capacity tensiometer (UNITN and UDUR))
Trento high-capacity tensiometers (Tarantino & Mongiovı`, 2002; 2003) were used to measure matric suction at UNITN, whereas a tensiometer developed by Durham University and Wykeham Farrance Ltd (Lourenc¸oet al., 2006, 2008, 2011) were used for measurement at UDUR.
The tensiometers were first calibrated using the procedures outlined by Tarantino & Mongiovı` (2003) and Lourenc¸o et al. (2008) for the UNITN and UDUR tensiometer respec-tively. The saturation of the UNITN tensiometer porous ceramic was checked according to the procedure illustrated by Tarantino (2004).
The experimental procedure adopted at UNITN involved air-drying samples to a given water content and storage for at least 1 week to ensure moisture equilibration. Specimens 80 mm in diameter and 20 mm high were then cut from the air-dried samples and suction measurements were carried out in a suction measurement box (Tarantino & Mongiovı`, 2002). To improve contact with the specimen a paste made of Speswhite kaolin was applied on the porous stone of the tensiometer. Water content and degree of saturation were determined for each specimen at the end of the suction measurement.
At UDUR, a single specimen was cut and placed in an air-tight box (Lourenc¸o et al., 2011). The tensiometer was placed in a hole drilled in the top plate of the box over the centre of the specimen and was held in place by the ring sealing the hole. When measurement stabilised, the tensi-ometer was removed, the specimen was set on its side to allow air drying and the measurement was repeated. The water content at each drying stage was back-calculated from the final water content. As shrinkage was not uniform, that is the specimen ceased to be cylindrical, volume measure-ments required for the degree of saturation were unreliable and water retention data were processed only in terms of water content.
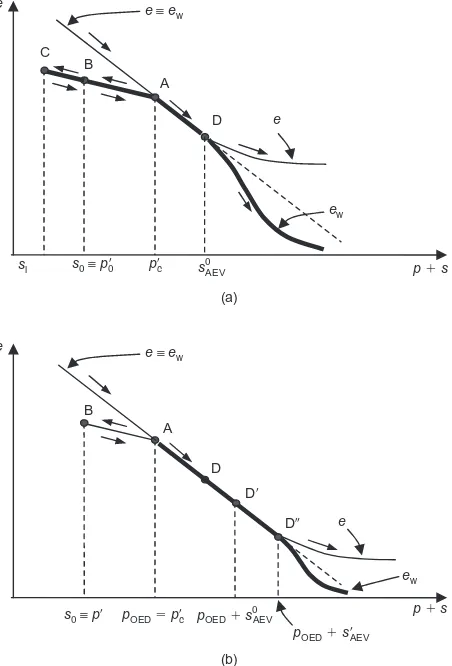
EVALUATION OF TECHNIQUES FOR SUCTION CONTROL AND MONITORING
To better discuss the experimental results, it may be convenient to examine the path followed by the specimens during one-dimensional loading and unloading and subse-quent drying. Upon loading in the consolidometer, the speci-men moves along the normal consolidation line. As the vertical stress is increased to its final value ó9vc, the mean
effective stress increases to the value p9c (point A in Fig. 2)
given by p9c¼
1þ2k0
3 óvc9 (3)
wherek0 is the coefficient of earth pressure at rest. At this
stage the specimen is saturated and the void ratio e equals the water ratioew (ew being the volume of water per volume
of solids). Even though the total vertical stress is reduced to zero very rapidly, some water enters the specimen and the mean effective stress reduces to p90 (point B in Fig. 2). After
removal from the consolidometer, the saturated specimen therefore has suctions0equal to p90.
When using the pressure plate and the osmotic method, an initial small suction si was applied to the specimen, which
brought the specimen to point C in Fig. 2(a) along the ‘saturated’ unloading–reloading line. Subsequent drying at
zero net stress (p ¼0) first brought the saturated specimen again to point A along the ‘saturated’ unloading–reloading line (path C–B–A) and then along the ‘saturated’ normal consolidation line. At a given suction, s0
AEV, the soil
desatu-rated (point D in Fig. 2(a)) and the water ratioew decreased
more rapidly than void ratio e. In Fig. 2, it is assumed that the AEV s0
AEV is higher than the preconsolidation pressure pc9, which is the case of the MUSE soil. Accordingly, all
specimens are expected to desaturate at the same suction, s0
AEV, irrespective of the initial suction applied si.
When measuring suction using the tensiometer, the speci-mens were directly desaturated from point B (the specispeci-mens are not resaturated) and therefore followed the path B–A–D. Again, since the AEV s0
AEV is higher than the
preconsolida-tion pressure pc9for the MUSE soil, the soil tested using the
tensiometer would be expected to desaturate at the same suction as the pressure plate and osmotic method (point D).
The case of the axis-translation oedometer is examined in Fig. 2(b). After removal from the consolidometer, net stress was increased at zero suction to match the preconsolidation pressure (pOED¼p9c, point A in Fig. 2(b)). Starting from this
point, suction was progressively increased from zero to the AEV s0
AEV recorded under zero net stress (point D9 in Fig.
2(b)). At this suction level, the soil was still saturated but the void ratio was lower than the void ratio recorded at the same suction under zero net stress (compare points D and D9in Fig. 2(b)). As a lower void ratio increases the air-entry suction (Gallipoli et al., 2003; Tarantino, 2009), the soil is therefore expected to desaturate at a higher suction, s9AEV
(point D99 in Fig. 2(b)).
Bearing in mind these paths, the results from the pressure plate tests (Fig. 3) are now examined. The WRC at UGLAS
A
s0≡p0⬘
s0≡p⬘
p⬘c s0AEV
e
pOED⫽ ⬘pc pOED s
0 AEV ⫹
pOED⫹ ⬘sAEV
si
B C
p⫹s
e e≡e
w
e≡ew
e
D
A B
e
ew
D (a)
D⬙ D⬘
p⫹s
(b)
[image:5.595.308.534.54.387.2]ew
was determined on three specimens simultaneously placed on the pressure plate. These three curves are nearly identi-cal, suggesting that the three specimens had similar suction at the beginning of the pressure plate test. This point is very important as the success of the benchmark exercise depends on the reproducibility of the initial state of the specimens.
The results from EPFL are also shown in Fig. 3(a) in terms of water content and in Fig. 3(b) in terms of degree of saturation. The soil remains quasi-saturated up to suctions of about 200 kPa. In the range 100–200 kPa, the specimen moves from the saturated unloading–reloading line (url) to the normal consolidation line, as discussed in Fig. 2(a). In the saturated and quasi-saturated range (s,200 kPa), EPFL data slightly overestimate water content with respect to UGLAS data. This may be associated with the different vertical pressure applied to improve contact, no pressure for EPFL and 0.6 kPa for UGLAS, as discussed later in the paper. The different water content may also arise from the water sucked out of the ceramic plate when releasing the air pressure. In contrast to UGLAS, EPFL did not close the water reservoir drainage valve before releasing the air pressure. However, the amount of water that could move into the specimen in the few minutes between reducing the air pressure and weighing the specimen is not expected to be significant because of the low permeability of the high-air-entry value (HAEV) ceramic (Noguchi, 2009). Beyond 200 kPa suction, EPFL and UGLAS data appear to be consistent.
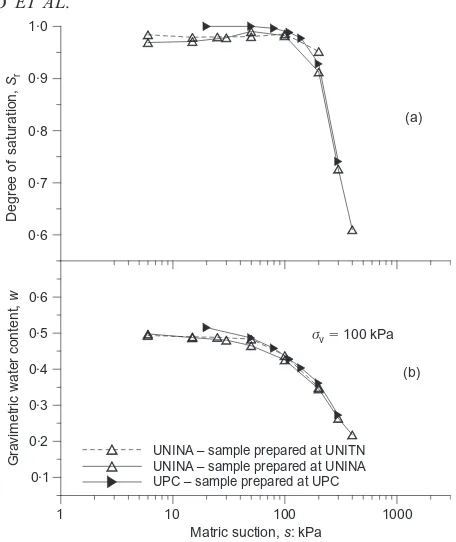
The results from the axis-translation oedometers are shown in Fig. 4. Concerning the tests carried out at UNINA, one curve refers to a sample prepared at the UNITN, and the other one refers to a sample prepared at the UNINA, following the same procedure adopted at the UNITN. The data obtained at UPC also refer to a sample prepared at UPC. It is interesting to observe that these three curves are very similar, demonstrating that samples tested in this exer-cise can be reproduced if the procedure for sample prepara-tion is carefully followed. Tests carried out within this benchmark exercise could therefore be potentially duplicated by other laboratories as the ‘ingredients’ of the MUSE mixture are all commercially available.
Water retention data from axis-translation oedometer can-not be directly compared to those obtained in the pressure plate because of the different total stress applied. However, as the specimens remain saturated at suctions lower than 100 kPa (Fig. 4), data in this range can be analysed in terms of mean effective stress p9¼p+s, p being the mean total stress ands the suction.
By using equation (3) and assuming k0¼1sinö9 (ö9
being the effective angle of friction), the axis-translation oedometer curves in the range 0–100 kPa in Fig. 4(b) can be re-plotted in terms of mean effective stress p9 in the plane (p+s, w) by tentatively assuming ö9¼208 or ö9¼308 (Fig. 5). Clearly the assumption k0¼1sinö9 is
only valid in the normally consolidated states, which are assumed to be reached as p9 exceeds 70–80 kPa . Data are consistent with those obtained using the pressure plate and this essentially confirms the hydraulic and mechanical paths figured out in Fig. 2, taking into account that the transition from overconsolidated to normal consolidated states was assumed to be sharp in Fig. 2 and is indeed smooth.
The water retention data obtained by using the osmotic 0·1
0·2 0·3 0·4 0·5 0·6
Gr
a
vimetric w
a
ter content,
w
UGLAS – pressure plate EPFL – pressure plate
url
10 100 1000
Matric suction, : kPas
0·6 0·7 0·8 0·9 1·0
Deg
ree of
sa
tur
a
tion,
Sr
EPFL – pressure plate 200 kPa
(a)
[image:6.595.320.548.44.315.2](b)
Fig. 3. Results from pressure plate tests (UGLAS and EPFL) in terms of (a) water content and (b) degree of saturation
1 10 100 1000
Matric suction, : kPas
0·1 0·2 0·3 0·4 0·5 0·6
Gr
a
vimetric w
a
ter content,
w
UNINA – sample prepared at UNITN UNINA sample prepared at UNINA UPC sample prepared at UPC
– – 0·6
0·7 0·8 0·9 1·0
Deg
ree of
sa
tur
a
tion,
Sr
σv⫽100 kPa (a)
(b)
Fig. 4. Results from axis-translation oedometer (UNINA and UPC) in terms of (a) degree of saturation and (b) water content
10 100
p⫹s: kPa 0·4
0·5 0·6
Gr
a
vimetric w
a
ter content,
w
UGLAS – pressure plate EPFL ressure plate– p
UNINA xis-translation oedometer– a
φ⬘ ⫽20°
[image:6.595.64.291.51.310.2]φ⬘ ⫽30°
Fig. 5. Comparison of axis-translation data (pressure plate and oedometer) in the saturated range
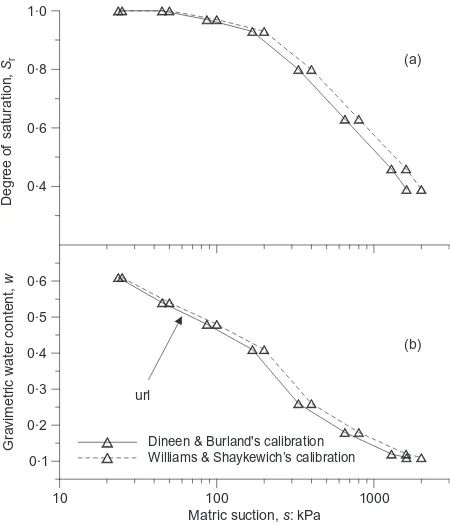
[image:6.595.317.550.598.751.2]method (ENPC) are shown in Fig. 6. Two curves are plotted based on the calibrations by Williams & Shaykewich and Dineen & Burland respectively. At a given water content, differences in the suctions predicted by the two calibration curves range from ˜s¼30 kPa at s¼200 kPa to
[image:7.595.49.274.184.447.2]˜s¼150 kPa at s¼800 kPa. These differences are relevant and, in the following, only the curve based on the Dineen & Burland calibration will be discussed. Again, the soil starts desaturating in the range 100–200 kPa.
Figure 7 shows the results obtained using the high-capa-city tensiometers (UNITN and UDUR). Apart from a UDUR
data point at s¼35 kPa and a significant difference in suction measured at a water content of about 0.2, the two data sets appear to be consistent. Once again, the soil appears to start desaturating in the range 100–200 kPa.
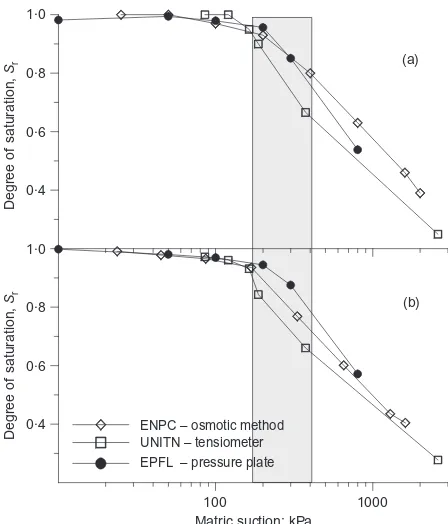
To compare the water retention data using the pressure plate, the osmotic method and the high-capacity tensiometer, experimental results obtained by EPFL, ENPC and UNITN were analysed respectively. These data allow the comparison to be made both in terms of water content and degree of saturation (water retention data from UGLAS and UDUR were only provided in terms of water content and were shown to be similar to those obtained by EPFL and UNITN respectively). The three WRCs are shown in Fig. 8 and are augmented by total suction measurements using the WP4 dewpoint potentiometer performed at UPC. Data are consis-tent at low suctions (in the range where the soil is saturated) and also at high suction (s.700 kPa). At high suctions, there appears to be continuity with the dewpoint potenti-ometer data. Discrepancies are observed in the medium range of suction (shaded area in Fig. 8). This range corre-sponds to the range where the soil starts desaturating as shown in Fig. 9 and in particular in the range where the air phase is present in occluded form in the pore space.
Inspection of Fig. 9 shows that data in terms of degree of saturation are not consistent with data in terms of water content (the ENPC water retention data lie between the UNITN and EPFL data in Fig. 8(a) and appear to bound the UNITN and EPFL data in Fig. 9). This is associated with errors in the estimate of total volume, as shown in Fig. 10, where the degree of saturation and void ratio are plotted against water content. There is an inevitable data scattering which causes the apparent discrepancy between water reten-tion data in terms of water content and degree of saturareten-tion shown in Fig. 8(a) and Fig. 9 respectively. If a unique function is used to relate the degree of saturation to water content, as shown by the thick curve in Fig. 10(a), data clearly regain consistency as illustrated in Fig. 9(b).
The discrepancy observed in the medium range of suction (shaded area in Fig. 8) is perhaps the most remarkable result of this exercise. It appears that suction in the pressure plate is overestimated with respect to suction measured by the high-capacity tensiometer and the osmotic technique (based on tensiometer calibration) in the range of degree of satura-tion above 0.7–0.8. The sucsatura-tion difference in this range of degrees of saturation appears to be significant. For example, suction measured by the tensiometer at w,0.3 is around 200 kPa, whereas the suction applied in the pressure plate is 400 kPa at the same water content.
Similar effects were previously observed by Chahal & Yong (1965) for both initially saturated and initially unsaturated specimens. These authors also observed greater discrepancies
10 100 1000
Matric suction, : kPas
0·1 0·2 0·3 0·4 0·5 0·6
Gr
a
vimetric w
a
ter content,
w
Dineen & Burland's calibration Williams & Shaykewich’s calibration 0·4
0·6 0·8 1·0
Deg
ree of
sa
tur
a
tion,
Sr
url
(a)
[image:7.595.50.274.480.742.2](b)
Fig. 6. Results from the osmotic technique (ENPC) in terms of (a) degree of saturation and (b) water content
10 100 1000
Matric suction, : kPas
0·1 0·2 0·3 0·4 0·5 0·6
Gr
a
vimetric w
a
ter content,
w
UDUR – tensiometer UNITN ensiometer– t 0·4
0·6 0·8 1·0
Deg
ree of
sa
tur
a
tion,
Sr
url
(a)
(b)
Fig. 7. Results from the high-capacity tensiometer (UNITN and UDUR) in terms of (a) degree of saturation and (b) water content
10 100 1000 10 000 100 000
Matric suction, : kPas
0 0·1 0·2 0·3 0·4 0·5 0·6
Gr
a
vimetric w
a
ter content,
w
ENPC – osmotic method UNITN – tensiometer EPFL – pressure plate UPC – dewpoint potentiometer
[image:7.595.304.534.610.742.2]url
as suction exceeded the air-entry suction, that is in the range where the soil starts desaturating and air is discontinuous. Lourenc¸o et al. (2006) also observed that suction in the pressure plate is overestimated with respect to the tensi-ometer.
A possible explanation of this effect was provided by Marinhoet al. (2008) considering the capillary tube concep-tual model. A capillary tube representing a quasi-saturated state contains an entrapped air cavity at some elevation
below the atmospheric air–water interface (Fig. 11(a)). If, in the laboratory environment, this same capillary tube is sealed and subjected to an elevated air pressure, the rel-atively high compressibility of the air cavity will lead to a significant reduction in the cavity’s volume. As the gas– liquid–solid junction of the outer meniscus initially remains fixed, the curvature of the air–water interface will increase because of the compression of the entrapped air cavity as shown in Fig. 11(b). As a result, the pressure differential between air and water, which is controlled by the meniscus curvature, will increase.
Another point to be addressed is the apparent discrepancy between the osmotic method and the high-capacity tensi-ometer, as shown in Fig. 8. Inspection of this figure shows that the difference essentially concerns the ENPC data point at w,0.27. However, the difference between suction applied by the osmotic method and suction measured by the tensi-ometer is ˜s¼,40 kPa and it is not significantly greater than the standard deviation of the error associated with the Dineen & Burland’s calibration curve (˜só ¼,25 kPa). As a result, no conclusions can be drawn about possible differ-ences between the tensiometer and osmotic method and further investigation is required.
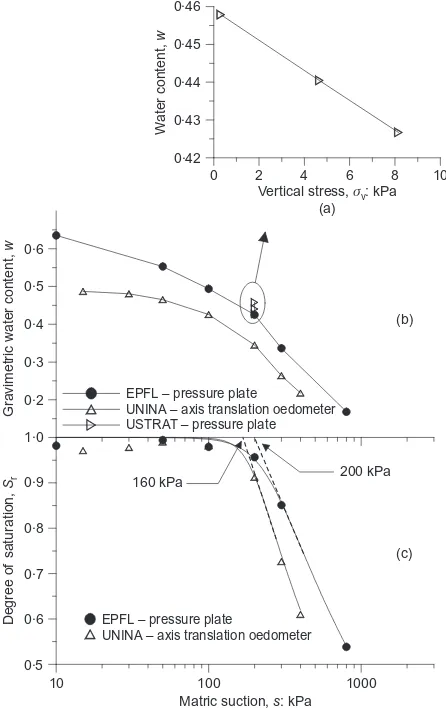
Another interesting comparison concerns the two techni-ques based on axis-translation, the pressure plate (EPFL) and the oedometer (UNINA). As shown in Fig. 12(c), the air-entry suction for the UNINA specimens (axis-translation oedometer) is lower than the air-entry suction of the EPFL specimens (pressure plate). This is surprising as the air-entry suction of the axis-translation oedometer would have been expected to be equal to or greater than that recorded in the pressure plate according to the hydraulic path sketched in Figs 2(b) and 2(c). It then appears that the pressure plate overestimated suction also with respect to the axis-translation oedometer. As a result, the mechanism illustrated in Fig. 11 is not sufficient to explain the higher water content measured in the pressure plate at a given suction.
The main difference between the oedometer and pressure plate is the vertical stress applied to the specimen. This affects the hydromechanical response of the specimens but it is also expected to control the nature of the contact with the high-air-entry ceramic plate. To investigate this effect, a specific test was devised and carried out at USTRAT. Three specimens cut from the same sample were simultaneously placed in the pressure plate, each specimen loaded with a different weight to apply vertical stresses of 0.3, 4.7 and 0·4
0·6 0·8 1·0
Deg
ree of
sa
tur
a
tion,
Sr
100 1000
Matric suction: kPa 0·4
0·6 0·8 1·0
Deg
ree of
sa
tur
a
tion,
Sr
ENPC – osmotic method UNITN – tensiometer EPFL – pressure plate
(a)
[image:8.595.64.288.50.312.2](b)
Fig. 9. Comparison between pressure plate (EPFL), osmotic method (ENPC) and tensiometer (UNITN) in terms of degree of saturation: (a) raw data; (b) corrected using a single function
w–Sr
0 0·2 0·4 0·6 0·8
Water content 0·4
0·8 1·2 1·6
V
oid r
a
tio
,
e
ENPC – osmotic method UNITN – tensiometer EPFL – pressure plate
Sr⫽1
0·2 0·4 0·6 0·8 1·0
Deg
ree of
sa
tur
a
tion,
Sr
ENPC – osmotic method UNITN – tensiometer EPFL – pressure plate
Fig. 10. Relationship between phase variables in pressure plate (EPFL), osmotic method (ENPC) and tensiometer (UNITN) tests
θ θ
θAT θ0
a w AT a w 0
( ) ( )
⬍
⫺ ⬎ ⫺
u u u u
ua0⫽0
ua0⫽0
uw0⬍0
(ua AT) ⬎0
(uw AT) ⬎0
(a)
ua⬍(ua AT)
[image:8.595.335.525.564.750.2](b)
Fig. 11. Axis-translation technique in presence of occluded air: (a) negative water pressure; (b) positive water pressure
8.2 kPa respectively. A suction of 200 kPa was applied and the specimens were left to equilibrate for 12 days.
It was found that water content recorded upon the applica-tion of 200 kPa decreases significantly as the vertical stress increases (Fig. 12(a)). It is worth noting that the vertical stress applied has very little mechanical effect. The degree of saturation of the three specimens was equal to unity before placing them in the pressure plate and a degree of saturation equal to unity was measured after the application of the 200 kPa suction. Accordingly, their mechanical re-sponses were controlled by the effective stress. The mean effective stress is given by the sum of the suction applied (200 kPa) plus one-third of the vertical stress applied, 0.1, 1.6 and 2.7 kPa respectively. The increase in mean stress associated with the weight is therefore very small and cannot justify a change in water content of about 3%. The result shown in Fig. 12(a) then seems to demonstrate that the contact pressure has a significant effect on water content. This can tentatively be explained by assuming that air tends to fill the gaps between the specimen and the plate, thus reducing the average hydraulic gradient between soil water and water in the high-air-entry ceramic. At the extreme, if a continuous gap were to form between the specimen and the plate (as if the specimen were suspended over the plate), no water exchange would occur. These air cavities tend to collapse as the vertical stress is increased and thus the water pressure in the porous ceramic tends to be transmitted more uniformly to the specimen.
CONCLUSIONS
The paper has presented a ‘round robin’ benchmark test aimed at comparing different techniques for the measure-ment and control of suction. The soil tested consisted of a mixture of kaolinite, bentonite and sand, all of which are commercially available. Samples were prepared by one la-boratory (Universita` di Trento) to ensure that ‘identical’ samples were tested by all other teams. However, samples prepared by normal consolidation from slurry at two differ-ent laboratories (Universita` di Napoli Federico II and Uni-versitat Polite`cnica de Catalunya) showed similar responses to those samples prepared at the Universita` di Trento. It would therefore be possible for other laboratories to prepare their own samples to duplicate the tests presented in this paper and check their own equipment and procedures.
Techniques tested by the eight MUSE research teams included axis-translation (pressure plate and axis-translation oedometer), high-capacity tensiometer, osmotic technique and dewpoint potentiometer. The water retention character-istics of the initially saturated samples were investigated along the main drying path. Samples were de-saturated by applying suction through the liquid phase when using axis-translation technique or osmotic method and de-saturated by air-drying when suction was measured using high-capacity tensiometers or dewpoint potentiometer.
When the same technique was tested by two different laboratories (pressure plate, axis-translation oedometer and high-capacity tensiometer), very similar WRCs were ob-tained, which is a remarkable result in a round robin test. It therefore appears that techniques for suction measurement or control are sufficiently reliable to be successfully used in routine engineering practice.
Differences were observed between the pressure plate and the tensiometer. In particular, the pressure plate seems to overestimate suction at given water content in the range of high degrees of saturation, that is where air is in occluded form. This finding is in agreement with experimental evi-dence from the literature.
The pressure plate appears to overestimate suction also with respect to the axis-translation oedometer where non-zero total stress is applied to the specimen. It is suggested that this difference is associated with the different contact pressure between the specimen and the high-air-entry cera-mic plate. A specifically designed test has demonstrated that contact pressure can significantly change the equilibrium water content at a given applied suction.
ACKNOWLEDGEMENTS
The authors wish to acknowledge the support of the European Commission by way of the ‘Marie Curie’ Research Training Network contract number MRTN-CT-2004-506861. The helpful discussions with Anh-Minh Tang from the E´ cole des Ponts – ParisTech, UR Navier/CERMES are also grate-fully acknowledged.
REFERENCES
Airo` Farulla, C. & Ferrari, A. (2005). Controlled suction oedometric
tests: analysis of some experimental aspects. Proceedings of an
international symposium on advanced experimental unsaturated soil mechanics (EXPERUS), Trento, Italy, pp. 43–48. Rotterdam: Balkema.
Atkinson, J. H. (1993). An introduction to the mechanics of soils
and foundations: through critical state soil mechanics. London: McGraw-Hill.
Chahal, R. S. & Yong, R. N. (1965). Validity of the soil water
characteristic determined with the pressurized apparatus. Soil
Sci.99, No. 2, 98–103.
Cui, Y. J. & Delage, P. (1996). Yielding and plastic behaviour of an 0·2
0·3 0·4 0·5 0·6
Gr
a
vimetric w
a
ter content,
w
EPFL – pressure plate
UNINA – axis translation oedometer USTRAT – pressure plate
0 2 4 6 8 10
Vertical stress, : kPa (a)
σv 0·42
0·43 0·44 0·45 0·46
W
a
ter content,
w
10 100 1000
Matric suction, : kPas
0·5 0·6 0·7 0·8 0·9 1·0
Deg
ree of
sa
tur
a
tion,
Sr
EPFL – pressure plate
UNINA – axis translation oedometer
160 kPa 200 kPa
(b)
[image:9.595.49.272.387.742.2](c)
unsaturated compacted silt. Ge´otechnique 46, No. 2, 291–311,
doi: 10.1680/geot.1996.46.2.291.
De Gennaro, V., Canou, J, Dupla, J. C. & Benahmed, N. (2004). Influence of loading path on the undrained behaviour of a
medium loose sand.Can. Geotech. J.41, No. 1, 166–180.
Delage, P., Howat, M. D. & Cui, Y.-J. (1998). The relationship between suction and swelling properties in a heavily compacted
unsaturated clay.Engng Geol.50, No. 1–2, 31–48
Delage, P., Romero, E. & Tarantino, A. (2008). Keynote lecture: Recent developments in the techniques of controlling and
meas-uring suction.Proc. 1st Eur. Conf. Unsaturated Soils, Durham,
UK1, 33–52.
Di Mariano, A., Airo` Farulla, C. & Valore, C. (2000). Retention curves and 1-D behaviour of a compacted tectonised unsaturated
clay. In Experimental evidence and theoretical approaches in
unsaturated soils (eds A. Tarantina and C. Mancuso), Proceed-ings of an international workshop on unsaturated soils, Trento, Italy, pp. 47–64. Rotterdam: Balkema.
Dineen, K. & Burland, J. B. (1995). A new approach to osmotically
controlled oedometer testing. Proc. 1st Conf. Unsaturated Soils
(UNSAT’95), Paris (eds E. E. Alonso and P. Delage) 2, 459– 465. Rotterdam: AA Balkema.
Gallipoli, D., Wheeler, S. J. & Karstunen, M. (2003). Modelling the variation of degree of saturation in a deformable unsaturated
soil.Ge´otechnique53, No. 1, 105–112,doi: 10.1680/geot.2003.
53.1.105.
Hoffmann, C., Romero, E. & Alonso, E. E. (2005). Combining different controlled-suction techniques to study expansive clays. Proceedings of an international symposium on advanced experi-mental unsaturated soil mechanics(eds A. Tarantino, E. Romero and Y. J. Cui), Trento, Italy, pp. 61–67. Leiden: AA Balkema.
Lourenc¸o, S. D. N. (2008).Suction measurements and water retention
in unsaturated soils. PhD thesis, Durham University, Durham, UK. Lourenc¸o, S. D. N., Gallipoli, D., Toll, D. G. & Evans, F. D. (2006). Development of a commercial tensiometer for triaxial
testing of unsaturated soils. Proc. 4th Int. Conf. Unsaturated
Soils, Phoenix (eds G. A. Miller, C. E. Zapata, S. L. Houston
and D. G. Fredlund)2, 1875–1886. Reston: ASCE, Geotechnical
Special Publication 147.
Lourenc¸o, S. D. N., Gallipoli, D., Toll, D. G., Augarde, C., Evans, F. & Medero, G. (2008). Calibrations of a high-suction
tensi-ometer. Ge´otechnique 58, No. 8, 659–668, doi: 10.1680/geot.
2008.58.8.659.
Lourenc¸o, S. D. N., Gallipoli, D., Toll, D. G., Augarde, C. E. & Evans, F. D. (2011). A new procedure for the determination of the soil water retention curve by continuous drying using high
suction tensiometers.Can. Geotech. J.48, No. 2, 327–335.
Marinho, F. A. M., Take, A. & Tarantino, A. (2008). Tensiometeric
and axis translation techniques for suction measurement.
Geo-tech. Geol. Engng26, No. 6, 615–631.
MUSE website (2005). MUSE ‘Marie Curie’ Research Training Network. See http://muse.dur.ac.uk for further details (accessed 31 August 2005).
Noguchi, T. (2009). Comparison of major suction measurement
techniques used to determine the soil water retention curves. MEng dissertation, Durham University, Durham, UK.
Pe´ron, H., Hueckel, T. & Laloui, L. (2007). An improved volume
measurement for determining soil water retention curves.
Geo-tech. Testing J.30, No. 1, 1–8.
Rampino, C., Mancuso, C. & Vinale, F. (1999). Laboratory testing on an unsaturated soil : equipement, procedures, and first
experimental results.Can. Geotech. J.36, No. 1, 1–12.
Rojas, J. C., Mancuso, C. & Vinale, F. (2007). Stress state and hysteresis influence upon the SWRC of a silty sand using the
modified oedometer apparatus. International congress on
development, environment and natural resources: multi-level and multi-scale sustainability, Cochabamba, Bolivia, 11–13 July 2007, vol. 1, pp. 145–153.
Romero, E. (1999). Characterisation and thermo-hydro-mechanical
behaviour of unsaturated boom clay: an experimental study. PhD thesis, Universitat Polite`cnica de Catalunya, Barcelona, Spain.
Romero, E. (2001). Controlled-suction techniques. Proc. 48
Simpo´-sio Brasileiro de Solos Naˆo Saturados N˜ SAT’2001(eds W. Y. Y.
Gehling and F. Schnaid),PortoAlegre, Brazil1, 535–542.
Tang, A.-M. & Cui, Y.-J. (2005). Controlling suction by the vapour equilibrium technique at different temperatures and its applica-tion in determining the water retenapplica-tion properties of MX80 clay. Can. Geotech. J.42, No. 1, 287–296.
Tang, A.-M., Cui, Y.-J., Qian, L.-X., Delage, P. & Ye, P. W.-M. (2010). Calibration of the osmotic technique of controlling suction with respect to temperature using a miniature
tensi-ometer.Can. Geotech. J.47, No. 3, 359–365.
Tarantino, A. (2004). Panel report: Direct measurement of soil
water tension. Proc. 3rd Int. Conf. Unsaturated Soils (eds J. F.
T. Juca´, T. M. P. de Campos and F. A. M. Marinho) 3, 1005–
1017.
Tarantino, A. (2007). Task A3: Benchmarking methods of suction
control – Preparation of soil samples. MUSE internal report. Tarantino, A. (2009). A water retention model for deformable soils.
Ge´otechnique59, No. 9, 751–762,doi: 10.1680/geot.7.00118. Tarantino, A. & Mongiovı`, L. (2002). Design and construction of a
tensiometer for direct measurement of matric suction.Proc. 3rd
Int. Conf. Unsaturated Soils (eds J. F. T. Juca´, T. M. P. de
Campos and F. A. M. Marinho)1, 319–324.
Tarantino, A. & Mongiovı`, L. (2003). Calibration of tensiometer for
direct measurement of matric suction. Ge´otechnique 53, No. 1,
137–141,doi: 10.1680/geot.2003.53.1.137.
Tarantino, A. & Tombolato, S. (2005). Coupling of hydraulic and
mechanical behaviour in unsaturated compacted clay.
Ge´otechni-que55, No. 4, 307–317,doi: 10.1680/geot.2005.55.4.307.
Williams, J. & Shaykewich, C. F. (1969). An evaluation of poly-ethylene glycol PEG 6000 and PEG 20000 in the osmotic
control of soil water matrix potential.Can. J. Soil Sci.102, No.
6, 394–398.
Wissa, A. E. Z. & Heiberg, S. (1969). A new one-dimentional
consolidation test. Cambridge, MA: Massachusetts Institute of Technology, Research Report 69–9.