Assessing and benchmarking the performance of advanced façades
Chapter 24 in Materials for Energy Efficiency and Comfort in Buildings and Occupied Spaces, Hall, M, Ed., Woodhead Publishing Energy Series No. 14, ISBN: 1-84569-526-7
Clarke J A and Johnstone C M Energy Systems Research Unit University of Strathclyde [email protected]
Content Abstract Keywords
Advanced façades
Façade component options
Performance models and model parameter measurement Integrated performance rating
Application in practice
Benchmarking façade performance Further information
References
Abstract
breathable insulation, advanced glazing, daylight capture, photovoltaic components and ducted wind turbines. Laboratory testing techniques for the characterisation of the fundamental parameters underlying each technology are elaborated as the essential prerequisite of integrated performance appraisals of specific technology combinations within an advanced façade design context. Based on the results from simulations undertaken in the UK climate context, performance benchmarks are suggested for some principal façade configurations.
Keywords: advanced façades, demand reduction, renewable supply, integrated performance assessment, performance benchmarks.
Advanced façades
In support of the deployment of urban-scale new and renewable energy systems, attention is being directed to the energy demand-supply interface within the urban context in an attempt to enhance the temporal match. Whatever approach is taken, it is likely that demand profile reshaping will be as important as overall demand reduction because the former can facilitate the integration of energy sources that are both intermittent and stochastic. Advanced façades (Selkowitz et al 2003, Façade
Engineering 2009) can play a significant role in this regard because of the potential to blend technical systems that affect both energy demand and local supply. However, designers of such façades are then confronted by three significant issues: how to characterise the performance of specific technologies, how to evaluate the
simulation approach that addresses the second issue and aspects of the third: the issue of cost is not addressed here. Examples of advanced façades that incorporate
innovative components are then presented and performance data are extracted that may be used to benchmark advanced façade designs.
Façade component options
There are several existing technologies that may be integrated within an advanced façade and these can be conveniently categorised into those that reshape/reduce demand and those that supply energy from locally deployed heat and power generating components.
Demand reshaping
Energy supply
Several technologies can be integrated within the façade to provide thermal and electrical energy from renewable sources. Photovoltaic cells (IEA 2002) can be deployed to convert the incident solar flux to electrical power and, where used in hybrid mode, to also produce heat (this mode of operation has the added advantage in the case of crystalline cells of reducing cell temperature and so maintaining optimum energy conversion efficiency). Advanced glazings can also be used to enhance/control the penetration of daylight to the interior; a photocell-based control system may then be deployed to regulate artificial lighting use in a complementary manner in order to displace the consumption of high grade electricity. Ducted wind turbines (Grant et al 2008) can be deployed at the roof junction to produce electrical power by reducing the pressure at the leeward side of the duct through the action of an integrated spoiler, thereby enhancing inward air flow at the windward side. Where a double façade is employed, the solar chimney effect can be used to enhance the air flow at turbine entry.
Just as the technology deployment options are many, so are the conflicts that can arise because of the interactions between technologies when deployed in various
electricity give rise to a more cost-effective solution than (mutually exclusive) daylight capture devices deployed as a means to reduce electricity usage?
Performance models and model parameter measurement
Building performance simulators operate in the transient domain based on models of material and component behaviour that require a range of fundamental parameters determined by experimental means. In order to facilitate integrated performance assessment and benchmarking, it is therefore necessary to decide on suitable prediction models and establish representative values for their related input
parameters. For example, breathable insulation might be represented by a conduction model that employs an equivalent overall conductivity, which needs to be identified before the model can be used. Alternatively, a more refined model might be employed that differentiates between conductive and convective heat transfer and so requires values for the parameters relating to these distinct mechanisms. For complete systems, such as photovoltaic components, quoted performance is often related to a standard test condition and the underlying model serves to translate performance to the non-standard conditions encountered throughout a simulation. Models and experimental methods exist for each of the demand/supply technologies mentioned in the previous section and these are summarised here.
Material properties
The position of some materials within an advanced façade, such as insulation, will ensure that they operate in the dry state. For this case, the measurement of
conductivity is carried out by either the guarded hot-plate or heat flow meter
to use but requires the availability of calibration samples measured by the hot-plate method so that the overall error may be around twice that of the hot-plate method.
Where a material operates in the moist state, the measurement of conductivity is problematic because the application of a temperature difference to a moist specimen results in a moisture gradient, causing moisture to migrate from the higher
temperature. At constant applied temperature difference, the same sample will have different moisture gradients for different moisture contents while, at constant moisture content, the same sample will have different moisture gradients for different applied temperatures. Furthermore, as the moisture content increases, condensate will appear at the cold side of the specimen implying that the measured conductivity will
increasingly fall below the conductivity for a linear moisture distribution with increasing moisture content. In the absence of knowledge of the moisture gradient, quoting applied temperatures at constant moisture content does not uniquely define the conductivity measurement. Instead, measurements become particular functions of temperature, moisture content, sample thickness, sample orientation (up- or down-ward heat flow) and length of measurement period. The thin-heater thermal conductivity apparatus uses a low applied temperature difference to reduce the problem of moisture migration.
apparatus difficult. Test techniques include conventional absolute calometric methods and indirect dynamic methods based on Fourier's equation and regression analysis applied to test results.
Because of the high specific heat capacity of water, the effect of moisture content on the specific heat of a material is significant and must be taken into account. In principle, the overall specific heat capacity of a material is the linear addition of that of the dry material to that due to the amount of water present. In practice, this requires knowledge of the in-use moisture content. While calculations can be based on
standard design values, the absence of a practical, non-destructive test method for determining on-site moisture content gives rise to an inherent uncertainty in calculating values of specific heat capacity for moisture containing materials. This uncertainty is compounded because it is the volume heat capacity (i.e. the product of density and specific heat capacity) that is important in determining thermal capacity; hence, the uncertainty in density is added to the uncertainty in specific heat capacity for volume heat capacity.
A further source of error will arise from the fact that conditions are dynamic in practice. In general, materials will be subject internally to temperature and moisture gradients that do not correspond to equilibrium distributions. Hence, both the thermal resistivity and capacity will vary within the material. It is also the case that the
modelling applications where moisture dependent heat transfer dominates (Künzel and Kiessl 1997, Rode and Grau 2008). Chapters 5 and 16 give further information on the hygrothermal properties of materials, while hygrothermal property data are available in the literature (e.g. Kumaran 1996, Clarke and Yaneske 2009).
Other material properties required to support the integrated modelling process include opaque surface emissivity, absorptivity and reflectivity as required for radiation modelling within the longwave, shortwave and visible portions of the electromagnetic spectrum respectively.
Glazing materials have the added property of transmissivity in addition to those of reflectivity and absorptivity. As the sum of the three properties must equal unity, it is only necessary to measure two properties. Glazing manufacturers publish basic data on the solar optical properties of various forms of sheet glass and transparent plastic materials, and modelling systems are available that provide optical data as a function of flux angle of incidence and specific window configuration. (e.g. Window 5.2 available from http://windows.lbl.gov/software/window).
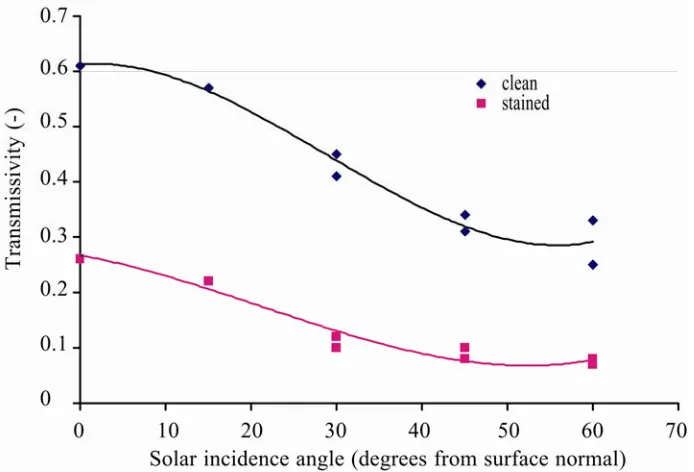
Transparent insulation
impact on angular shortwave transmissivity can be established experimentally as shown in Figure 1.
Figure 1: Impact of staining on TI shortwave transmissivity.
Advanced glazings
Advanced glazings provide regulation of energy flow via devices such as multiple panes, inter-pane inert gas filling or vacuum, low emissivity or spectrally selective coatings, optical manipulation (diffusing, re-directing), variable transmissivity, and encapsulated shading. An important factor when adopting advanced glazing is to ensure that the framing does not allow thermal bridges that will compromise overall system performance.
measurement of window normal-normal transmittance (for use with point sources such as the direct solar beam) and hemispherical-hemispherical transmittance (for use with diffusing sources such as the sky). Internal surface finishes also need to be characterised in terms of their reflectance, which will be incident angle dependent in the case of specular surfaces.
In situ measurements
Laboratory testing under standard conditions will be inappropriate where material properties are expected to operate under significantly different conditions in practice. For these cases, in situ testing will be required.
A heat flux sensor – a transducer that generates a signal that is proportional to the local heat flux – may be employed to determine the mean value of thermal
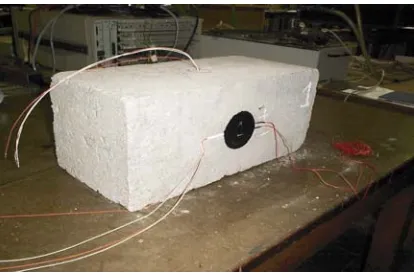
conductivity of a construction over a given period. Typically the sensor would be embedded within a substrate with a high thermal capacity to minimise the dynamic errors associated with short time constant materials: Figure 5 shows a sensor
embedded within a concrete construction block. In this way, the one dimensional heat flow rate can be determined and used to calculate the effective thermal conductivity, k, as a function of the time-averaged temperature difference:
k = Q x/ T
Figure 5: Heat flux sensor embedded within a high density concrete block.
The techniques of pyrometry and photometry may be used to measure, by non-contact means, longwave emissivity and solar optical properties respectively. A pyrometer focuses thermal radiation, qt, onto a detector, allowing the determination of the surface temperature, s, from the Stefan-Boltzmann law:
qt = s4
where is a constant and the known surface emissivity; if the surface temperature is known, its emissivity can be inferred.
Photometry measurements require lux meters to quantify surface illuminance (lux) and luminance meters to quantify the directional surface luminance (cd/m2). The Daylight-Europe project (Fontoynont 1999) developed simple procedures for the measurement of material optical properties such as the normal-normal transmittance of non-diffusing glazing under a point light source, the hemispherical-hemispherical transmittance of clear, tinted or diffusing glazing under a diffuse light source, and the reflectance of diffuse or specular surfaces.
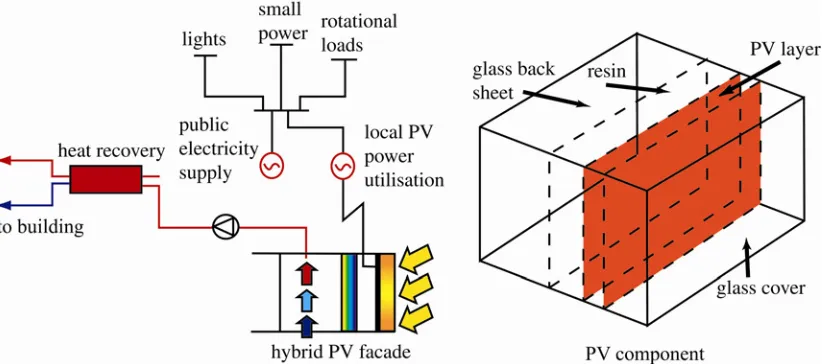
In accordance with European recommendations, manufacturers test their photovoltaic (PV) products under ESTI Test Specification Number 503. In such a test, a module's performance is characterised within an environment where the cell temperatures are maintained at 25°C and the module is exposed to a pulsed irradiance of 1000 W/m2. From this test, the current and voltage characteristics are recorded to allow the open circuit voltage, short circuit current, and maximum power point voltage/current to be quantified. Consider Figure 2, which shows a façade-integrated PV component generating electricity and heat; the former is delivered to the building’s electricity distribution network, the latter to a heat recovery system.
Figure 2: A façade-integrated PV component with local power use.
Solar radiation is transmitted to the surface of the PV layer through the glass cover. A portion of this flux will be converted to electrical energy:
where i is the irradiation of the PV layer, ’i the solar radiation absorbed by the PV layer that is converted to heat and qe the electrical power output. Models exist for the calculation of qe, such as the one by Buresch (1983):
e i
i = +q
'
where is the temperature (K) of the PV material, V the voltage at maximum power point, Id the diode current, ILthe light generated current, d the diode factor, n the number of series connected cells, c the number of parallel connected cells, p the number of surface panels, e the electron charge (1.6 x 10⁻¹⁹ Coulombs), and the Stefan-Boltzmann constant (1.38 x 10⁻²³ W/m2K4).
The diode factor and current are given by
and the light generated current by
where is an empirical factor and stc, Voc, Isc, Imp and ’stc are temperature, open circuit voltage, short circuit current, maximum power point current and cell insolation under standard test conditions. These are the parameters that need to be measured in a laboratory test. ⎥ ⎦ ⎤ ⎢ ⎣ ⎡ − ⎟⎟ ⎠ ⎞ ⎜⎜ ⎝ ⎛ −
= d L
e V I
d V e I V p c n
q 1 .
. . . exp . . .. θ σ
(
)
⎟⎟ ⎠ ⎞ ⎜⎜ ⎝ ⎛ − − = sc mp sc stc oc I I I n V V e d log . .αθDucted wind turbines
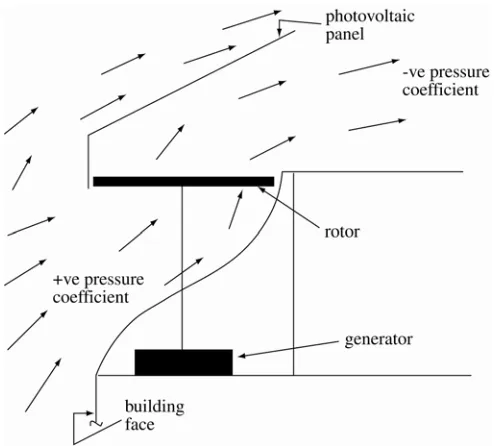
Ideas for wind energy conversion in an urban environment have ranged from the notion of placing wind turbines on roofs, to façade-integrated ducted wind turbines. With reference to Figure 3, when the wind blows at right angles to a tall façade, stagnation will occur at about two-thirds of the total height. Below this level a rolling vortex is formed, above it the air rises to pass over the roof. If the roof is flat, it will separate from the upwind edge, possibly reattaching some distance downstream. A ducted wind turbine (DWT; Grant et al 2008) is designed to draw air from the high-pressure region on the upwind face of the building and exhaust it into the low-pressure region above the flat roof. The device will operate efficiently over a 60° range of wind directions, with the ducting serving to dampen any turbulence in the air stream, which can be a significant problem when other buildings are in close
[image:14.595.174.422.428.651.2]proximity.
Figure 3: A façade-integrated ducted wind turbine.
where v is the wind speed (m/s), R the rotor radius (m), the air density (kg/m3) and Cp a power coefficient that represents the effectiveness of the turbine rotor.
For a given turbine, Cpis a function of the tip speed ratio ts:
where is the angular velocity of the rotor.
Because most conventional grid-connected wind turbines are constrained to turn at constant angular velocity, as the wind speed varies, the value of ts (and hence
Cp) will change. A DWT, being a small unit for autonomous use, is unlikely to be connected to the electrical grid and so can operate in variable-speed mode.
Maintaining a constant value for ts allows the DWT to operate at a constant and optimum value of Cp.
Combining the previous two equations gives:
where K is a constant and the torque T at the rotor shaft follows a quadratic characteristic, T = K 2.
In practice it is possible to control the generator to produce a quadratic torque 3
2 5
.
0 C R v
Pw = pρπ
v R ts =ω
3 3 2 5 . 0 ω ω ρπ ω K t R R C T P s p
This mode of operation can be abandoned in high wind speeds, where it is necessary to limit the power produced. Here, the electrical load on the generator may be
increased, reducing the rotor speed, stalling its blades and reducing Cp to the required value. At low wind speeds, say below 5 m/s, the power output will fall as a result of disproportionate mechanical losses and low generator efficiency.
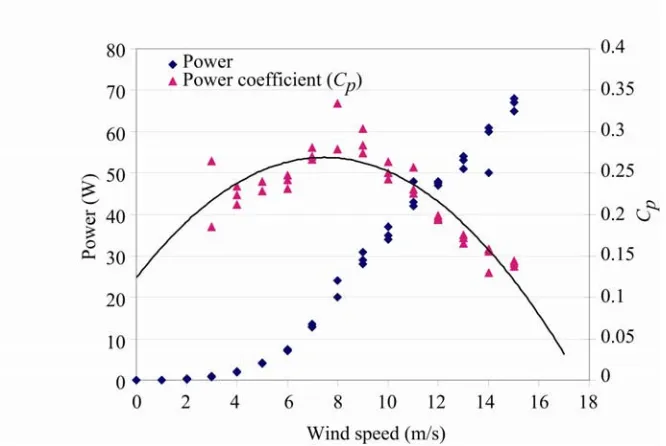
Wind tunnel tests may be used to characterise the change in Cp over the operational range: Figure 4 shows measured power output, Pm, and Cp against wind speed from such a test. The variation in Cp is determined from
where Pi is the ideal power output given by
[image:16.595.133.466.506.729.2]where is the air density, A the swept rotor area and v the wind speed.
Figure 4: Monitored power output and Cp value for a ducted wind turbine. 3
5 . 0 Av
Pi = ρ
Integrated performance rating
At the core of all simulation programs is a detailed mathematical representation of the heat transfer processes occurring within the building. At its most general, the
approach taken is to transform the real system to a discretised equivalent and to represent each part by conservation equations relating to energy, mass and momentum exchanges. The problem then becomes one of estimating the temporal evolution of the parameters comprising the coefficients of these equations and arranging for whole-system equation solution under the influence of time varying boundary conditions.
It is widely accepted that integrated modelling defines a new best practice approach to energy systems design because it allows designers to address important new
challenges such as the linking of energy, the environment, comfort and health. In use, the approach requires the gradual evolution of a problem’s description, with
performance outputs becoming available at discrete stages as the design detail improves. The design team is then free to terminate model building when the objectives have been achieved.
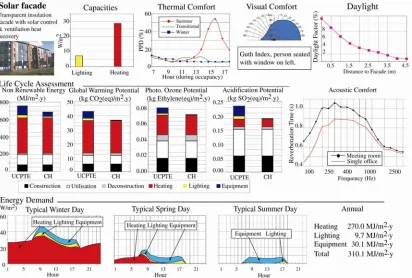
Integrated Performance View (IPV; Prazeres and Clarke 2005) as output by one contemporary building performance simulator, ESP-r (Clarke 2001). An IPV reports on issues such as seasonal energy demand, thermal/visual comfort, daylight
utilisation, renewable energy contributions and environmental impact in relation to global warming, atmospheric acidification and ozone generation potentials.
[image:18.595.93.505.458.736.2]Application in practice
To illustrate the integrated modelling approach to advanced façade design, this section summarises two projects: the encapsulation of transparent insulation material and solar control devices within the façade of a new student residence located at the University of Strathclyde, and the encapsulation of all the above mentioned technologies within a refurbished building in Glasgow.
Case Study 1: Student residences
[image:19.595.90.508.484.713.2]This project (Roddick et al 1993) entailed the development of accommodation for 376 students and included pre-design modelling and post-occupancy monitoring. As depicted in Figure 7, the development incorporated a 1040 m2 solar façade containing polycarbonate honeycomb transparent insulation and an automated solar shading mechanism. Figure 7 also shows the façade cross section to summarise the operational principle.
Heat flux sensors embedded in the façade indicated a dark U-value of 0.6 W/m2K with the shading device open and 0.48 W/m2K with the device closed. Over the heating season, more energy enters than leaves the façade; hence an overall U-value of -0.08 W/m2K. The Normalised Performance Indicator (NPI) value of 168
kWh/m2.yr represents a 40% improvement on the ‘Good’ classification for a building of this type.
Post occupancy monitoring quantified the contribution to the heating load from the façade as 293 MWh/year, while a survey showed that 91% of the occupants were ‘satisfied’ or ‘very satisfied’ with the internal environment – the average room temperature in winter was 20-24°C.
Case Study 2: Commercial refurbishment
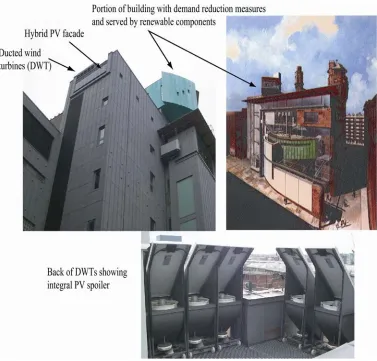
This project (Clarke et al 2000) was undertaken as part of the renovation of a former Glasgow Herald building – a notable Charles Rennie Mackintosh design – to create ‘The Lighthouse’, Scotland's Centre for Architecture and Design (as depicted in Figure 9). Modelling and simulation was used to search for façade-oriented technologies that effected a favourable match between the supply from façade-integrated renewable energy components and building electricity and thermal demands. The outcome from this search included:
• advanced glazings to minimise heat loss without significantly reducing
daylight penetration;
• dynamic indoor temperature and illuminance set-point adjustment;
• an array of ducted wind turbines (DWT) to meet a portion of the power
demands during the winter and transitional seasons;
• a PV array to meet a portion of the power demand during the transitional and
summer seasons (this array was subsequently incorporated within the spoiler of the DWT);
• a hybrid PV façade to meet a portion of the power and heat demands during
the transitional and summer seasons; and
• a battery storage system to meet the temporal mismatch between the demand
and supply.
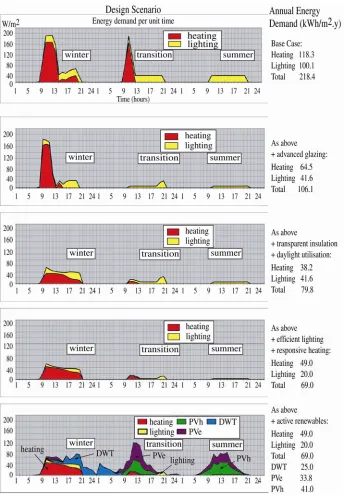
Figure 8 shows the cumulative impacts of the demand reduction measures: a 68% reduction in annual energy demand (corresponding to a 58% reduction in heating and an 80% reduction in lighting). Significantly, the final demand profiles are better matched to the output from the locally deployed renewable energy (RE) systems.
Figure 8: Impact of progressive deployment of demand reshaping measures.
Benchmarking façade performance
addition, procedures have been developed to assess the non-energy performance of facades related to the risk of defect occurrence (e.g. Chew and de Silva 2004).
Figure 9: Embedded RE systems in The Lighthouse Building, Glasgow.
One way to assess the energy benefit that may accrue from the different possible façade technologies is to use simulation to quantify the benefits of possible
combinations. This approach was employed in the case studies reported above. In the case of the Lighthouse building, the initial predicted performance of 218 kWh/m2.yr for heating and lighting could be improved to around 106 kWh/m2.yr by the
kWh/m2.y by the adoption of smart heating/lighting system control. The integration of PV and DWT technologies, which were made viable by the reshaped demand profiles, resulted in the production of around100 kWh/m2.yr, although not all of this was utilisable because of the temporal mismatch.
In the case of the student residences, the solar façade resulted in a 40% reduction in the NPI – from 280 kWh/m2.yr to 168 kWh/m2.yr.
Arriving at such low energy façade solutions requires a procedure for systematically analysing the different demand/supply options. This is made possible within the modelling and simulation approach by adherence to a Performance Assessment Method that explores the impact of the different possible technologies when deployed separately and together. In the case of the Lighthouse building, for example, the cumulative impacts shown in Figure 8 comprise only a sub-set of those actually considered but discarded for a variety of reasons specific to the project (e.g. cost). The important point is that the initial design must not be constrained by the incorporation of particular low energy features. Rather, these features should be systematically added to the initial, unconstrained design hypothesis so that the impact of each feature may be judged in a relative manner and suitable outcomes retained. Clearly, the actual features considered will change with time as existing technologies become cost-effective and new technologies emerge.
Further information
technologies and tools for high performance building façade solutions is the resource base maintained by the Environmental Energy Technologies Division at the Lawrence Berkeley National Laboratory (see http://lowenergyfacades.lbl.gov/resources.html).
Another useful Web site on the topic is maintained at
http://www.energy.soton.ac.uk/buildings/facades.html and state-of-the-art viewpoints are available as part of recent conference proceedings (e.g. Facade Engineering 2009).
References
Buresch M (1983) Photovoltaic energy systems - design and installation, McGraw-Hill, New York.
Clarke J A, Johnstone C M, Macdonald I A, French P, Gillan S, Glover C, Tatton D, Devlin J and Mann R (2000) `The Deployment of Photovoltaic Components Within the Lighthouse Building in Glasgow', Proc. 16th European Photovoltaic Solar Energy Conf., Glasgow.
Carbon Trust (2009)
www.carbontrust.co.uk/energy/assessyourorganisation/benchmarking.htm.
Chew M Y L and De Silva N (2004) ‘Factorial Method for Performance Assessment of Building Facades’, Journal of Construction Engineering and Management, 130(4). CIBSE (2009) Various Energy Benchmark publications of the Chaterered Institution of Building Services Engineers (www.cibse.org).
Clarke J A (2001) Energy Simulation in Building Design (2nd Edn), Butterworth-Heinemann, ISBN 0 7506 5082 6.
Clarke J A and Yaneske P (2009) 'A Rational Approach to the Harmonisation of the Thermal
de Matos M and Duarte R (2007) ‘A comparison between energy performance of one
double skin facade buildings studied sample and office buildings benchmarks in
Europe (sic)’, Proc. 2nd PALENC Conf. and 28th AIVC Conf. on Building Low
Energy Cooling and Advanced Ventilation Technologies in the 21st Century, Crete,
pp253–257.
Façade Engineering (2009) Proc. façade engineering conference: benchmarking performance and driving innovation in modern façade design,
www.emapconferences.co.uk/facadeengineering/programme/index.jsp.
Fontoynont M (Ed) (1999) Daylight Performance of Buildings, James & James, ISBN 1-873936-87-7.
Grant A D, Johnstone C M and Kelly N (2008) ‘Urban wind energy conversion: The potential of ducted wind turbines’, Renewable Energy, 33(6), ISSN: 0960-1481. Imbabi M S and Peacock A (2004) ‘Allowing Buildings to Breathe’, Renewable Energy, pp85–95, ISSN/ISBN: 0960-1481.
IEA (2002) ‘Photovoltaics/thermal solar energy systems: Status of the technology and roadmap for future development’, Task 7 Final Report, International Energy Agency PVPS T7-10.
Hutchins M (1998) ‘Advanced glazings: a status report’, Sunworld, 22(1), pp5–11, ISSN 0149-1938.
Kumaran M K (1996) ‘Hygrothermal Properties of Building Materials’, Final Report for Task 3, IEA Annex 24 (Heat Air and Moisture Transfer in Insulated Envelope Parts), International Energy Agency.
Loncour X, Deneyer A, Blasco M, Flamant G, and Wouters P (2004) Ventilated double façades – Classification & illustration of façade concepts, Belgian Building Research Institute.
Prazeres L and Clarke J A (2005) 'Qualitative analysis of the usefulness of
perceptualisation techniques in communicating building simulation outputs', Proc. Building Simulation '05, Montreal, International Building Performance Simulation Association.
Roddick G, Twidell J W and Johnstone C M (1993) Final Report for Contract
SE/324/87, European Commission.
Rode C and Grau K (2008) ‘Moisture Buffering and its Consequence in Whole Building Hygrothermal Modeling’, J. Building Physics, 31(4), pp333–360.
Selkowitz S E (2001) ‘Integrating advanced facades into high performance buildings’ Paper LBNL-47948, Lawrence Berkeley National Laboratory.
Selkowitz S, Aschehoug O and Lee E S (2003) ‘Advanced Interactive Facades – Critical Elements for Future Green Buildings?’, Proc. GreenBuild, Lawrence Berkeley National Laboratory.