Abstract— An Empirical Mode Decomposition based filtering (EMDF) approach is presented as a post-processing stage for speech enhancement. This method is particularly effective in low frequency noise environments. Unlike previous EMD based denoising
methods, this approach does not make the assumption that the contaminating noise signal is fractional Gaussian Noise. An adaptive
method is developed to select the IMF index for separating the noise components from the speech based on the second-order IMF
statistics. The low frequency noise components are then separated by a partial reconstruction from the IMFs. It is shown that the
proposed EMDF technique is able to suppress residual noise from speech signals that were enhanced by the conventional
optimally-modified log-spectral amplitude approach which uses a minimum statistics based noise estimate. A comparative performance study is
included that demonstrates the effectiveness of the EMDF system in various noise environments, such as car interior noise, military
vehicle noise and babble noise. In particular, improvements up to 10 dB are obtained in car noise environments. Listening tests were
performed that confirm the results.
Index Terms— Noise Estimation, Speech Enhancement, Empirical Mode Decomposition, Denoising.
I. INTRODUCTION
common problem encountered in speech enhancement systems is the removal of unwanted disturbances, i.e. noise from
noisy speech signals. Adaptive noise cancellation is commonly performed when enhancing speech sequences using an
available noise reference. Single-channel speech enhancement systems traditionally employ Voice Activity Detection
(VAD) to estimate the statistics of the noise signal during silent segments. If the VAD approach is conservative, then it will
attempt to reduce false alarms for silence detection, which results in less frequent noise power updates.
In highly non-stationary environments, the noise power must be tracked even during speech activity. Noise estimation
Manuscript received April 20, 2011; revised August 1, 2011; accepted October 3, 2011.
Copyright (c) 2010 IEEE. Personal use of this material is permitted. However, permission to use this material for any other purposes must be obtained from the IEEE by sending a request to [email protected].
N. Chatlani is with the Department of Electronic and Electrical Engineering, University of Strathclyde, Glasgow G1 1XQ, UK. (email: [email protected]).
J. J. Soraghan is with the Department of Electronic and Electrical Engineering, University of Strathclyde, Glasgow G1 1XQ, UK. (email: [email protected]).
EMD BASED FILTERING (EMDF) OF LOW
FREQUENCY NOISE FOR SPEECH
ENHANCEMENT
Navin Chatlani and John J. Soraghan
techniques which operate in the short-time Fourier transform (STFT) domain are very popular, including newer noise estimation
systems such as the Minimum Statistics (MS) [1] and the Improved Minima Controlled Recursive Averaging (IMCRA) [2].
These techniques estimate the noise spectrum based on the observation that the noisy signal power decays to values characteristic
of the contaminating noise during speech pauses. The main challenge faced by these techniques is tracking the noise power
during speech segments. This would result in poor estimates during long speech segments with few pauses. Speech enhancement
systems such as the optimally-modified log-spectral amplitude (OMLSA) estimator [3] require a noise estimate to suppress noise
and enhance the noisy speech.
Recently, new Empirical Mode Decomposition (EMD) based methods [4-6] for noise suppression and signal enhancement
have been developed and include single-channel speech enhancement methods in stationary fractional Gaussian Noise (fGN)
environments. We do not assume that the signal is contaminated with fGN and therefore the above denoising methods are not
applicable. A novel post-processing technique for EMD based filtering of low frequency noise components is proposed for use in
other types of noise environments. Our technique is inspired by the low-rank approximation typically used in subspace speech
enhancement algorithms. Our method separates the speech from the noise by analysing the second order statistics of the Intrinsic
Mode Functions (IMFs) formed from the EMD of the speech signals.
In [7], it was shown that in the presence of low frequency noise, the performance of IMCRA degrades due to poor tracking of
the noise spectrum. This poses a problem in systems such as mobile devices in wind noise and speech recognition used in car
interior noise environments. In [8], a high pass filter is used as pre-processing in a car’s speech recognition system, where the
cut-off frequency is varied between 200-400 Hz. The speech recognition performance was shown to be dependent on the cut-off
frequency. Single-channel wind noise reduction is performed in [9], by using a VAD to detect wind-only frames and estimate the
wind noise energy. A post-filter is subsequently designed to place nulls at the frequencies corresponding to the wind noise
resonance. In [10], speech enhancement in car interior noise is achieved by using a speech analysis-synthesis approach, based on
a harmonic noise model, as post-processing after a traditional log-spectral amplitude speech estimation system. This system is
sensitive to accurate pitch estimation and voiced/unvoiced speech frame classification.
In this paper, a new EMD based filtering (EMDF) technique is described as a post-processor for noisy speech which is
enhanced using an MS based noise estimate. This proposed technique has been designed to be particularly effective in low
frequency noise environments. In EMDF, the speech is first decomposed into its IMFs using EMD. An adaptive method is
developed to select the IMF index for separating the residual low frequency noise components from the speech estimate, based
on the IMF statistics. The EMD based denoising of this speech estimate is performed, using our partial reconstruction method, to
reduce these residual low frequency noise components.
EMD-based denoising techniques are presented in section II. In section III, the novel EMDF enhancement system is developed.
In section IV, results obtained from testing and comparing the proposed EMDF method with basic OMLSA/IMCRA speech
estimation are presented and discussed. These tests are performed in non-stationary and varying SNR car interior noise, babble
noise and military vehicle noise conditions to show the improved performance of the EMDF system. The best overall
quantitative improvements are obtained under car interior noisy conditions which are dominated by low frequency noise
components. In this noise environment, segmental SNR improvements up to 10 dB are obtained using EMDF. The results of
listening tests are also included to assess and compare EMDF to existing techniques. Conclusions are made in section V.
II. EMPIRICALMODEDECOMPOSITION
A. Background
EMD [11, 12] is a non-linear technique for analyzing and representing non-stationary signals. EMD is data-driven and
decomposes a time domain signal into a complete and finite set of adaptive basis functions which are defined as Intrinsic Mode
Functions (IMFs). EMD does not use predefined basis functions. The IMFs formed by the EMD are oscillatory functions that
have no DC component. Fig. 1 illustrates the main stages in the EMD algorithm. EMD examines the signal between two
consecutive extrema (e.g. minima) and picks out the high frequency component that exists between these two points [12]. The
remaining local, low frequency component can then be found. The motivation behind the EMD is to perform this procedure on
the entire signal and then to iterate on the residual low frequency parts. This allows identification of the different oscillatory
modes that exist in the signal. The IMFs found must be symmetric with respect to local zero-mean and have the same number of
zero crossings and extrema, or differ at most by one. The IMF is considered as zero-mean based on some stopping criteria such
as the standard deviation between consecutively sifted functions [11].
Frequency information is embedded in the IMFs. These data-adaptive basis functions give physical meaning to the underlying
process. The signal reconstruction process is given in (1), which involves combining the N IMFs formed from the EMD and the
residual r[n]:
1
[ ] [ ] [ ]
N
j j
x n IMF n r n
=
=
∑
+ (1)B. EMD-based Denoising
As detailed in [12], the IMFs formed from EMD are almost locally orthogonal. Furthermore, EMD does not correspond to
increases. In [12], the EMD of fGN was shown to result in a filter bank like structure with overlapping pass-bands for each IMF
mode. The first IMF has a high-pass characteristic but also contains some lower energy, low frequency content. The higher order
modes also have this overlapping band-pass characteristic [12].
EMD-based denoising [4] involves decomposing a noisy signal using EMD and performing a partial reconstruction with those
IMFs composed of the desired signal. In [13], a study was carried out on the IMF statistics of fGN signals which resulted in an
empirically observed noise model for noise-only situations. This noise-only model allows an estimation of the energy of the IMF
modes. The noisy signal x[n] considered for denoising comprised the desired signal and fGN. For denoising, the energy of each
IMF of the noisy signal is computed and compared to the noise-only model’s IMF energy. The IMF order for which the
computed IMF energy deviates from a predefined threshold is determined and denoted as M+1. The denoised signal xD[n] is then
obtained from the partial reconstruction of the IMFs:
[ ]
[ ]
[ ]
1
= N
D m
m M
x n I n r n
= +
+
∑
(2)This reconstructed signal corresponds to a slower-varying signal that was superimposed on the fGN signal which dominates the
first M IMFs.
The case of a desired signal contaminated with fGN is special since the first few IMFs are predominantly composed of the
noise signal and this led to successful speech denoising strategies such as in [5, 6, 14]. In [5], EMD-MMSE is performed by
filtering the IMFs formed from the decomposition of speech contaminated with fGN. EMD-based thresholding methods were
presented in [6] for signals contaminated with fGN. These proposed techniques followed successful wavelet thresholding
methods. The EMD-MMSE and the EMD-based thresholding methods both estimate the noise statistics using the empirically
observed noise model presented in [13]. In [14], enhancement is achieved for speech signals corrupted by fGN using an
algorithm based on partial reconstruction of the higher order IMFs which are less affected by fGN. These techniques focus their
enhancement efforts on the lower-order IMFs and therefore, for speech contaminated with additive fGN, it is expected that the
high-frequency unvoiced components of the speech signal that exist in these IMFs will be filtered. In [15], an optimum gain
function is estimated for each IMF to suppress musical noise that may be retained after single channel speech enhancement
algorithms.
III. EMDBASED FILTERING FOR SPEECH ENHANCEMENT
Single channel speech enhancement algorithms rely on accurate noise spectrum estimation and speech estimation. IMCRA [2]
combines minimum statistics [1] with recursive averaging to perform noise spectrum estimation. The speech presence probability
segments from the second smoothing stage in IMCRA improves minima tracking and the estimation of the speech presence
probability. In low frequency noise environments, such as in car interiors, there is poor noise estimation and tracking [7] in the
noisy low frequency bins using IMCRA.
The new EMDF system for speech enhancement is illustrated in Fig. 2. Consider the model described by:
[ ]
[ ]
[ ]
x n =s n +d n (3)
where x[n] is the noisy speech signal, s[n] is the original noise-free speech, and d[n] is the noise source which is assumed to be
independent of the speech. The STFT of (3) may be written as:
(
,)
(
,)
(
,)
X f k =S f k +D f k (4)
for frequency bin f and time frame k. In Fig. 2, it can be seen that this new system first performs IMCRA to obtain the noise
estimate λˆd
(
f k,)
. Speech enhancement is performed signal by minimizing the mean-square error of the log-spectral amplitude(LSA) [16] as follows:
(
)
(
)
{
}
2min logS f k, log S f kˆ ,
Ε −
(5)
where Ε
[ ]
. is the expectation operator, S f k(
,)
is the speech amplitude component that exists in the noisy signal and S f kˆ(
,)
is the optimal speech estimate. The a priori SNR ξˆ
(
f k,)
is estimated using the modified, decision directed approach in [17].The corresponding LSA gain function, denoted as GLSA
(
f k,)
, to be applied to X f k(
,)
is expressed in (6). The OMLSAestimator [3] incorporates speech presence uncertainty to produce the gain function G f k
(
,)
given by:(
)
(
)
( ,) 1 ( , )min
, LSA , p f k p f k
G f k =G f k G − (6)
where p f k
(
,)
is the conditional speech presence probability which is estimated as in [2], and the threshold Gmin is based on asubjective criteria. The enhanced speech signal is then estimated as follows:
(
)
(
) (
)
(
(
)
)
ˆ , , , exp ,
x
S f k =G f k X f k jθ f k (7)
where S f kˆ
(
,)
is the OMLSA speech estimate, j= −1 and θx(
f k,)
is the phase of the noisy speech.The OMLSA/IMCRA enhancement stage from Fig. 2 produces the speech estimate s nˆ
[ ]
which contains residual noisecomponents. N IMFs are formed from the EMD decomposition of s nˆ
[ ]
. The EMD based denoising of this speech estimate isA. System Analysis
As seen in Fig. 2, the EMD decomposes the speech estimate s nˆ
[ ]
into N IMFs. Consider the IMF variance plots shown in Fig.3 for clean unvoiced and voiced speech components. The plots in Fig. 3 show the ensemble average of 900 random voiced and
unvoiced utterances spoken by various males and females. These speech sequences were extracted from the TIMIT database. In
these plots, the IMF order is denoted as m and the IMF variance is denoted as V[m]where:
[ ]
2[ ]
1
1 L m n
V m I n
L =
=
∑
, m=1,2..N (8)where Im[n] denotes the mth IMF. Partial reconstruction of these speech signals is given by:
[ ]
[ ]
1
ˆ
M
D m
m
s n I n
=
=
∑
(9)Fig. 3 shows that the IMF variance for clean speech signals significantly decreases after the fourth IMF, as the IMF order
increases. The SNR is used to objectively evaluate the resynthesis error of sˆD
[ ]
n compared to the original speech components.The SNR of the partially reconstructed signals using (9) for clean unvoiced and voiced components spoken by a female, is given
in Table 1(a) and Table 1(b) respectively. It can be seen that in both cases, signal reconstruction with the first 4 IMFs (i.e. M=4
in (9)) is sufficient for good speech resynthesis. This is consistent with the low-rank approximation used in subspace algorithms
[16, 17], which consider 9-15 dB SNR sufficient for reconstruction.
It was found experimentally that the IMF statistics for a speech signal contaminated with a low frequency noise has a peak
IMF energy in a higher IMF order Im[n], where m>4. This is illustrated using an example of the IMF variance plot for a clean
voiced speech female utterance s[n] contaminated with car interior noise d[n]at 0 dB SNR as shown in Fig. 4. The peak mp,1 and
its associated trough mt,1 are highlighted. The IMF variance build-up, mb,i, is defined as the IMF index deviation from the
identified peak mp,i to the previous trough mt,i as given by:
b,i p,i t ,i
m =m −m (10)
Following (10), the variance build-up mb,1 in Fig. 4 is 3. Identification of this IMF variance build-up mb,i is used to select the IMF
order, M, to use in the speech reconstruction. The remaining IMFs from M+1 to N are assumed to be dominated by the noise
whereas in (2), these IMFs were used to reconstruct the desired signal which was contaminated by fGN. Therefore, in EMDF, the
denoised signal sˆD
[ ]
n is obtained from the partial reconstruction in (9).The IMF index M is determined by examining the trough mt,i in V[m] prior to each identified peak mp,i. Our method to select
the IMF index M is shown in Fig.
5
(a) and is described as follows:2. Identify the indices of the peaks, mp={mp,1 , mp,2 …} in V[m] for m>4.
3. If peaks have been identified, then find the indices of the troughs, mt={mt,1 , mt,2 …} which correspond to the peaks in mp.
4. Compute the IMF variance build-up, mb={mb,1 , mb,2 …} to those peaks using (10).
5. Determine the index, i, of the first occurrence of the largest build-up mb,i in mb:
index (max( ))
i= mb (11)
and select the corresponding peak mp,i in mp.
6. The IMF index M is determined by:
p,i b,i
M =m −m (12)
As seen in the method for selecting M in Fig. 5(a) if no peaks are identified, then all IMFs Im[n] are used in the partial
reconstruction (i.e. M=N) of the denoised speech sˆD
[ ]
n in (9). This is performed to reduce speech distortion effects. In Fig. 5(b),the IMF variance plot of the noisy speech used in Fig. 4 was used as an example to demonstrate the above algorithm for selecting
M. The peak mp = {mp,1} = {7} and the build-up mb = {mb,1} = {3} are first computed. The value for M is then evaluated as in
(12) from the algorithm above. In this example, the IMF index M is 4.
This method for the selection of M was used for filtering the residual low frequency noise from the speech estimate s nˆ
[ ]
togive sˆD
[ ]
n as in (9). This speech estimate sˆD[ ]
n will be used to compare the performance of speech enhancement of the EMDFsystem in Fig. 2 with that obtained from the OMLSA/IMCRA system.
IV. PERFORMANCE EVALUATION
The performance of the EMDF technique for speech enhancement was tested on 192 speech utterances from 24 different
speakers (16 male and 8 female) obtained from the core test set of the TIMIT database. The clean speech signals were corrupted
with car interior noise, babble noise and military vehicle noise used for evaluating the speech enhancement systems. These
non-stationary background noise sources were obtained from the Noisex-92 database. The EMDF system’s performance was
compared with the OMLSA/IMCRA algorithm at enhancing the noisy speech signals. A sampling frequency of 16 kHz was
used. The signal was split up into frames of length 512 samples and a window overlap factor of 50%. The EMD-based denoising
stage by partial reconstruction using (9) is applied to speech blocks of length 512 samples.
In order to assess the relative performance of the speech enhancers, the objective measures of segmental SNR (segSNR) and
the OMLSA/IMCRA system, is given in Table 2. It must be noted that negative values for the WSS improvement indicate better
enhancement performance and a reduction in speech loss. These enhancement results were obtained under various SNR levels.
The results show improvements in segmental SNR and WSS under all noise conditions with an improved quality of speech
enhancement using the EMDF.
It can be seen that the best overall improvements are obtained under car interior noisy conditions which is dominated by low
frequency noise components. EMDF achieves SNR improvements up to 10 dB in this noise environment, while still maintaining
a low level of speech distortion, as characterized by the WSS improvement. Babble noise is composed of multiple talkers and has
a similar spectral characteristic compared to the original clean speech utterances. Therefore, it is difficult to reduce the level of
multi-talker babble from noisy speech signals. As shown in Table 2, EMDF also achieves increased noise suppression and
reduced speech distortion in babble noise conditions. Military vehicle noise has a low pass characteristic. Under military noise
conditions, SNR improvements up to 4 dB are achieved for noisy speech enhanced with EMDF, due to the improved suppression
of the low frequency noise components.
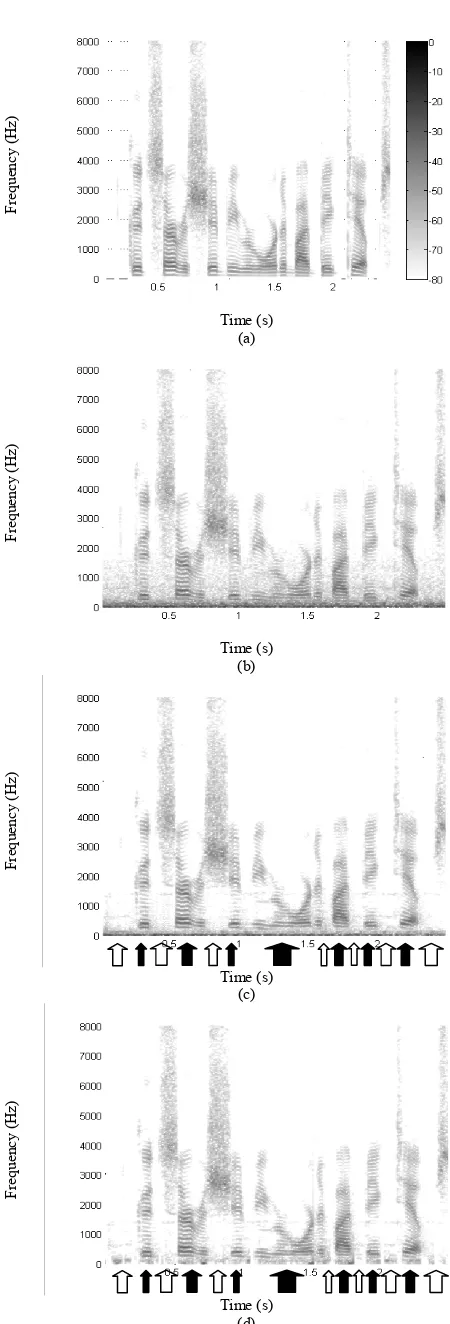
The spectrogram for a clean male speech utterance is given in Fig. 6(a). This speech signal was contaminated with car interior
noise at -10 dB SNR and its spectrogram is shown in Fig. 6(b). This noisy speech was enhanced using both techniques. The
spectrograms for the enhanced speech using the OMLSA/IMCRA and the EMDF system are illustrated in Fig. 6(c) and Fig. 6(d)
respectively. These plots demonstrate the improved noise suppression using EMDF. In Fig. 6(c) and in Fig. 6(d), the residual
noise components during unvoiced speech activity and speech pauses are highlighted with open arrows on the spectrograms for
speech enhanced by the OMLSA/IMCRA and the EMDF systems respectively. Comparison of these regions shows that these
noise components are significantly attenuated using the EMDF technique. The areas highlighted with solid arrows in Fig. 6(c)
and Fig. 6(d) show that EMDF retains more of the low frequency voiced speech components.
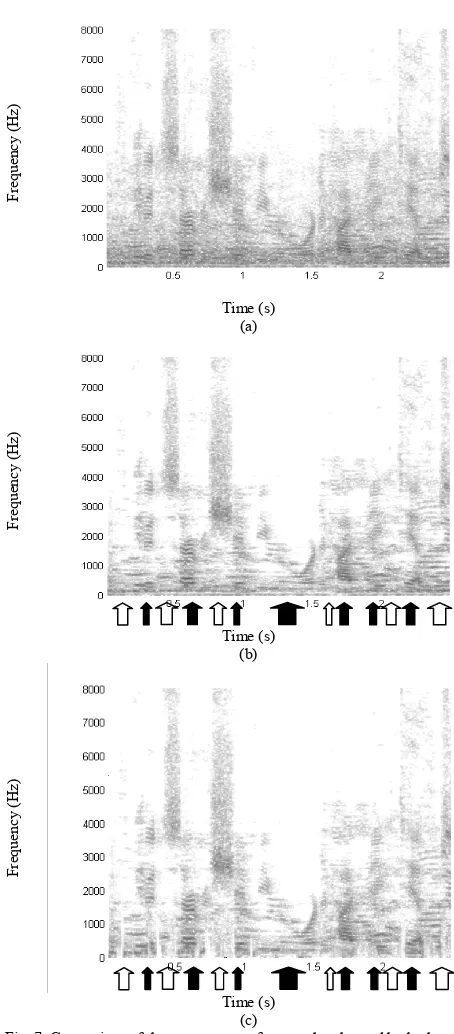
The effectiveness of EMDF is now demonstrated in the difficult enhancement scenario of multi-talker babble noise. The same
male speech utterance from Fig. 6(a) was contaminated with babble noise at -2 dB, and its spectrogram is shown in Fig. 7(a). The
spectrograms for the enhanced speech using the OMLSA/IMCRA and the EMDF system are given in Fig. 7(b) and Fig. 7(c)
respectively. As before, these plots demonstrate the improved noise suppression using EMDF. The open arrows are once again
used to highlight the areas where there is more attenuation of residual noise components during unvoiced speech and pauses,
using EMDF. The solid arrows highlight that voiced speech components are retained at low frequencies when EMDF is applied.
It was shown in Fig. 5(a) that EMDF uses all IMFs in the partial reconstruction if no peaks are identified, for a reduction of
speech distortion. Fig. 8 shows the percentage of segments for the speech utterances used in the tested data set, where the EMDF
method selected all IMFs (i.e. M=N) in the partial reconstruction, under car interior noise, babble noise and military vehicle noise
corresponds to the increased noise suppression as the SNR decreases, as shown in Table 2. Fig. 8 shows that the percentage of
segments where all IMFs were selected by EMDF in the partial reconstruction is higher in babble noise environments. This
indicates that there is less noise suppression under babble noise conditions compared to the other tested noise types, as
previously discussed in Table 2.
The presented results objectively quantify the effectiveness of the proposed EMDF post-filtering technique. Subjective
listening tests were also performed to evaluate this proposed system. The EMDF system was subjectively compared against the
OMLSA/IMCRA algorithm which had a high-pass filter (cut-off frequency fc of 120 Hz) at its output. Three sets of 10 sentences
from different male speakers were corrupted by car interior noise, babble noise and military vehicle noise, at three SNR levels (5
dB, 0 dB and -5 dB). These sentences were processed using the two techniques and 10 listeners were asked to rate the quality on:
1) The level of speech signal quality (SIG) where the five point scale is given by [5-very natural/no degradation, 4-fairly
natural/little degradation, 3-somewhat natural/somewhat degraded, 2-fairly natural/fairly degraded, 1-very unnatural/very
degraded].
2) The level of residual background noise (BAK) where the five point scale is given by [5-not noticeable, 4-somewhat
noticeable, 3-noticeable but not intrusive, 2-fairly conspicuous/somewhat intrusive, 1-very conspicuous/very intrusive].
The presentation level of the stimuli was measured by an artificial ear (Bruel & Kjaer Artificial Ear Type UA 4153) connected
to a sound level meter (Bruel & Kjaer Modular precision sound analyser) to ensure that the sound level did not exceed 75 dB
SPL. K702 AKG premium class headphones were used in the listening tests. Prior to each listening test, training sentences were
played for each listener to make them aware of the nature of the clean speech signals, the contaminating noises and the noisy
speech signals. Listeners were given breaks to reduce fatigue since the total test time was approximately 55 minutes.
The results of the listening tests are shown in Fig. 9 where the label “EMDF” refers to our proposed system and the label
“HPF” refers to the OMLSA/IMCRA system with the predefined high-pass filter at its output. In general, it can be seen that in
the presented noise conditions in Fig. 9(a), Fig. 9(c), and Fig. 9(e), the speech signal quality of the HPF system is slightly better
than EMDF. However, at -5 dB SNR, the speech signal quality of EMDF slightly exceeds that of HPF in car interior noise and
military noise environments. In Fig. 9(b), Fig. 9(d), and Fig. 9(f), it can be seen that EMDF performs significantly better than
HPF in terms of background residual noise suppression. These comparative listening tests show that EMDF achieves its best
performance in the presence of military vehicle noise.
V. CONCLUSION
effective at updating the noise spectrum by applying recursive averaging. However, in noise environments with strong low
frequency noise environments, IMCRA does not update the noise power accurately. The new EMDF method for speech
enhancement performs denoising of the residual low frequency noise components after the OMLSA/IMCRA system. The
performance of this technique was evaluated using speech contaminated with car interior noise, babble noise and military vehicle
noise conditions. When compared to an OMLSA/IMCRA system, this method was shown to give improved performance at
suppressing background noise under the presented noisy conditions.
ACKNOWLEDGEMENT
The authors thank Dr. W. M. Whitmer and A. Boyd from Medical Research Council’s Institute of Hearing Research (MRC
IHR) in Glasgow for their help in performing the listening tests. We also thank the listeners for their participation and the
anonymous reviewers for their useful comments.
REFERENCES
[1] R. Martin, "Noise PSD Estimation based on Optimal Smoothing and Minimum Statistics," IEEE Transactions on Speech and Audio Processing, vol.
9, Jul. 2001.
[2] I. Cohen, "Noise Spectrum Estimation in Adverse Environments: Improved Minima Controlled Recursive Averaging," IEEE Transactions on Speech
and Audio Processing, vol. 11, Sep. 2003.
[3] I. Cohen and B. Berdugo, "Speech enhancement for non-stationary noise environments," Signal Processing, Elsevier, vol. 81, pp. 2403-2418, Nov.
2001.
[4] P. Flandrin, et al., "Detrending and Denoising with Empirical Mode Decompositions," in European Signal Processing Conference (EUSIPCO), 2004,
pp. 1581-1584.
[5] K. Khaldi, et al., "Speech Enhancement via EMD," EURASIP Journal on Advances in Signal Processing, vol. 2008, p. 8, 2008.
[6] Y. Kopsinis and S. McLaughlin, "Development of EMD-Based Denoising Methods inspired by Wavelet Thresholding," IEEE Transactions on Signal
Processing, vol. 57, 2009.
[7] N. Chatlani and J. J. Soraghan, "EMD-based Noise Estimation and Tracking (ENET) with application to speech enhancement," in 17th European
Signal Processing Conference (EUSIPCO), 2009.
[8] H. Hoshino, "Noise-Robust Speech Recognition in a Car Environment Based on the Acoustic Features of Car Interior Noise," R&D Review of Toyota
CRDL, vol. 39, pp. 4-9, 2004.
[9] E. Nemer and W. Leblanc, "Single-Microphone Wind Noise Reduction by Adaptive Postfiltering," in IEEE Workshop on Applications of Signal
Processing to Audio and Acoustics, New York, 2009.
[10] R. F. Chen, et al., "Speech Enhancement in Car Noise Environment based on an Analysis-Synthesis Approach using Harmoinc Noise Model," in
[11] N. E. Huang, et al., "The Empirical mode decomposition and the Hilbert spectrum for nonlinear and non-stationary time series analysis," Proceedings
of the Royal Society A, vol. 454, pp. 903-995, 1998.
[12] G. Rilling, et al., "On Empirical Mode Decomposition and its Algorithms," IEEE-EURASIP Workshop NSIP, Jun. 8-11 2003.
[13] P. Flandrin and G. Rilling, "Empirical Mode Decomposition as a Filter Bank," IEEE Signal Processing Letters, vol. 11, pp. 112-114, Feb. 2004.
[14] X. Zou, et al., "Speech Enhancement Based on Hilbert-Huang Transform Theory," in IEEE CS Proceeding of the First International
Multi-Symposium of Computer and Computational Sciences (IMSCCS'06), 2006, pp. 208-213.
[15] T. Hasan and M. K. Hasan, "Suppression of Residual Noise From Speech Signals Using Empirical Mode Decomposition," IEEE Signal Processing
Letters, vol. 16, pp. 2-5, Jan. 2009.
[16] Y. Ephraim and D. Malah, "Speech enhancement using a minimum mean-square error log-spectral amplitude estimator," IEEE Transactions on
Acoustics, Speech and Signal Processing, vol. 33, pp. 443-445, Apr. 1985.
[17] Y. Ephraim and D. Malah, "Speech enhancement using a minimum-mean square error short-time spectral amplitude estimator," IEEE Transactions on
Acoustics, Speech and Signal Processing, vol. 32, pp. 1109 - 1121 Dec. 1984.
[18] D. Klatt, "Prediction in perceived phonetic distance from critical band spectra," in IEEE Conference on Acoustics, Speech and Signal Processing
(ICASSP), 1982.
Navin Chatlani received the B.Sc. (Hons.) degree in Electrical and Computer Engineering from University of the West Indies, Trinidad in 2002. He received the M.Sc. (Distinction) and Ph.D. degrees in Electronic and Electrical Engineering in 2007 and 2011 respectively, both from University of Strathclyde, Glasgow, U.K. His doctoral research focused on advanced signal enhancement techniques with application to speech and hearing.
From October 2010, he has been a Postdoctoral Research Fellow at Centre for Excellence in Signal and Image Processing at University of Strathclyde, Glasgow, U.K. His main research interests are signal processing theories, algorithms, architectures and filtering techniques for speech/audio applications and biomedical data applications. He is currently investigating methods for noise reduction, voice activity detection, beamforming and event onset detection.
John J. Soraghan (S’83–M’84–SM’96) received the B.Eng. (Hons.) and M.Eng.Sc. Degrees in electronic engineering from University College Dublin, Dublin, Ireland, in 1978 and 1983, respectively, and the Ph.D. degree in electronic engineering from the University of Southampton, Southampton, U.K., in 1989. His doctoral research focused on synthetic aperture radar processing on the distributed array processor. After graduating, he worked with the Electricity Supply Board in Ireland and with Westinghouse Electric Corporation in the U.S. In 1986, he joined the Department of Electronic and Electrical Engineering, University of Strathclyde, Glasgow, U.K., as a Lecturer and became a Senior Lecturer in 1990, a Reader in 2000, and a Professor in signal processing in September 2003. He was the Manager of the Scottish Transputer Centre from 1988 to 1991, Manager with the DTI Parallel Signal Processing Centre from 1991 to 1995 and Head of the Institute for Communications and Signal Processing from 2005-2007.
min
[ ]
max[ ]
[ ]
2
e
n
e
n
[image:12.595.93.258.83.555.2]m n
=
+
( , )
ˆ
d f k λ
[ ]
ˆD n
s
2
.
[ ]
[image:13.595.50.447.90.221.2]ˆn s
IM F v ar ia n ce , V [ m ]
IMF order, m
(a) IM F v ar ia n ce , V [ m ]
IMF order, m
(b) IM F v ar ia n ce , V [ m ]
IMF order, m
(c) IM F v ar ia n ce , V [ m ]
IMF order, m
[image:14.595.44.248.69.684.2](d)
Fig. 3: Ensemble averaged IMF variance plots of (a) clean male unvoiced speech components (b) clean
male voiced speech components (c) clean female unvoiced speech components and (d) clean female voiced speech components. In these plots, the error
IM
F
v
a
ri
an
ce
,
V
[
m
]
[image:15.595.57.418.104.373.2]IMF order, m
Fig. 4:IMF variance plot of clean speech contaminated with car interior noise at 0 dB SNR build-up mb,1
peak mp,1
M
(a) (b)
Fig. 5: (a) Method for selection of IMF order M used in the EMDF. (b) Illustrative stages of the method on the noisy female voiced speech utterance used to produce
the IMF variance plot in Fig. 4.
Compute variance of
m
thIMF
Identify indices of peaks
m
pfor
m
>4
Compute IMF variance
build-up
m
bto peaks in
m
pYes
No
M
I
m[
n
]
Identify indices of
corresponding troughs
m
tDetermine index
i
of the
first occurrence of the
largest build-up in
m
bM
=
m
p,i-
m
b,iPeaks
identified?
M
=
N
V
[
m
]
i
IMF order, m
V
[
m
]
IMF order, m
V
[
m
]
IMF order, m
V [ m ] V [ m ]
IMF order, m
mp,1 mp,1 mp,1 mt,1 mt,1 mb,1
IMF order, m
V
[
m
] m
p,1
mt,1
[image:16.595.130.470.74.592.2]F
re
q
u
en
cy
(
H
z)
Time (s) (a)
F
re
q
u
en
cy
(
H
z)
Time (s) (b)
F
re
q
u
en
cy
(
H
z)
Time (s) (c)
F
re
q
u
en
cy
(
H
z)
Time (s) (d)
[image:17.595.45.270.73.735.2]F
re
q
u
en
cy
(
H
z)
Time (s) (a)
F
re
q
u
en
cy
(
H
z)
Time (s) (b)
F
re
q
u
en
cy
(
H
z)
[image:18.595.44.271.91.608.2]Time (s) (c)
Fig. 7:Comparison of the spectrograms for speech enhanced by both methods in multi-talker babble noise at -2 dB. (a) Noisy speech (b) Speech enhanced
Fig. 8: Percentage of segments where all IMFs (i.e. M=N) were selected by EMDF to be used in the partial reconstruction, in car
interior noise, babble noise and military vehicle noise 0
5 10 15 20 25 30 35 40 45
-10 -5 0 5 10
Percentage (%)
SNR (dB)
(a) (c) (e)
[image:20.595.66.566.82.435.2](b) (d) (f)
Fig. 9: Mean scores for SIG and BAK scales for the two methods evaluated in (a)-(b) car interior noise (c)-(d) babble noise and (e)-(f) military vehicle noise
1.0 1.5 2.0 2.5 3.0 3.5 4.0 4.5 5.0
5 0 -5
S co re SNR (dB)
SIG
EMDF HPF 1.0 1.5 2.0 2.5 3.0 3.5 4.0 4.5 5.05 0 -5
S c o re SNR (dB)
SIG
EMDF HPF 1.0 1.5 2.0 2.5 3.0 3.5 4.0 4.5 5.05 0 -5
S co re SNR (dB)
SIG
EMDF HPF 1.0 1.5 2.0 2.5 3.0 3.5 4.0 4.5 5.05 0 -5
S co re SNR (dB)
BAK
EMDF HPF 1.0 1.5 2.0 2.5 3.0 3.5 4.0 4.5 5.05 0 -5
S co re SNR (dB)
BAK
EMDF HPF 1.0 1.5 2.0 2.5 3.0 3.5 4.0 4.5 5.05 0 -5
TABLE 1:
SNR of partially reconstructed signals using j IMFs for (a) clean unvoiced speech segment spoken by a female and (b) clean voiced speech segment spoken by a female
IMF order, j SNR (dB) of xD[n] IMF order, j SNR (dB) of xD[n]
1 10.2 1 1
2 15.8 2 5.9
3 19.4 3 11.9
4 22.5 4 17.2
5 27 5 18.7
6 29.8 6 20.1
7 33.6 7 20.6
8 321.4 8 319.8
(a) (b)
TABLE 2:
Segmental SNR (dB) and WSS improvements obtained when comparing the EMDF system to the OMLSA/IMCRA for various noise types and SNR levels
Input SNR (dB) Car interior noise Babble noise Military vehicle noise
segSNR WSS segSNR WSS segSNR WSS
10 3.6 -17.6 0.3 -7.2 2.3 -21.1
8 4.8 -23.1 0.5 -9.5 2.7 -27
6 5.8 -28.7 0.6 -11.7 3.1 -32.9
4 6.9 -34.6 0.7 -14 3.4 -38.4
2 7.8 -39.9 0.8 -16.7 3.8 -43.6
0 8.5 -45.1 0.9 -19.3 4 -48.3
-2 9.2 -49.5 1 -22.1 4.3 -52.5
-4 9.7 -53.4 1 -24.5 4.5 -56.4
-6 10.1 -56.7 1 -26.6 4.6 -59.6
-8 10.5 -60 1 -28.5 4.7 -62.6
[image:21.595.42.555.296.468.2]