R E S E A R C H
Open Access
Metabolic profiles in community-acquired
pneumonia: developing assessment tools
for disease severity
Pu Ning
1†, Yali Zheng
1†, Qiongzhen Luo
1, Xiaohui Liu
2,3, Yu Kang
4, Yan Zhang
5, Rongbao Zhang
1, Yu Xu
1,
Donghong Yang
1, Wen Xi
1, Keqiang Wang
1, Yusheng Chen
6, Shuchang An
7and Zhancheng Gao
1*Abstract
Background:This study aimed to determine whether community-acquired pneumonia (CAP) had a metabolic
profile and whether this profile can be used for disease severity assessment.
Methods:A total of 175 individuals including 119 CAP patients and 56 controls were enrolled and divided into two
cohorts. Serum samples from a discovery cohort (n= 102, including 38 non-severe CAP, 30 severe CAP, and 34 age and
sex-matched controls) were determined by untargeted ultra-high-performance liquid chromatography with tandem mass spectrometry (LC-MS/MS)-based metabolomics. Selected differential metabolites between CAP patients versus controls, and between the severe CAP group versus non-severe CAP group, were confirmed by targeted mass spectrometry assays
in a validation cohort (n= 73, including 32 non-severe CAP, 19 severe CAP and 22 controls). Pearson’s correlation analysis
was performed to assess relationships between the identified metabolites and clinical severity of CAP. The area under the curve (AUC), sensitivity and specificity of the metabolites for predicting the severity of CAP were also investigated. Results:The metabolic signature was markedly different between CAP patients and controls. Fifteen metabolites were found to be significantly dysregulated in CAP patients, which were mainly mapped to the metabolic pathways of sphingolipid, arginine, pyruvate and inositol phosphate. The alternation trends of five metabolites among the three
groups including sphinganine, p-Cresol sulfate, dehydroepiandrosterone sulfate (DHEA-S), lactate andL-arginine in the
validation cohort were consistent with those in the discovery cohort. Significantly lower concentrations of sphinganine,
p-Cresol sulfate and DHEA-S were observed in CAP patients than in controls (p< 0.05). Serum lactate and sphinganine
levels were positively correlated with confusion, urea level, respiratory rate, blood pressure, and age > 65 years (CURB-65), pneumonia severity index (PSI) and Acute Physiology and Chronic Health Evaluation II (APACHE II) scores, while DHEA-S inversely correlated with the three scoring systems. Combining lactate, sphinganine and DHEA-S as a metabolite panel for discriminating severe CAP from non-severe CAP exhibited a better AUC of 0.911 (95% confidence
interval 0.825–0.998) than CURB-65, PSI and APACHE II scores.
Conclusions:This study demonstrates that serum metabolomics approaches based on the LC-MS/MS platform
can be applied as a tool to reveal metabolic changes during CAP and establish a metabolite signature related to disease severity.
Trial registration:ClinicalTrials.gov,NCT03093220. Registered retrospectively on 28 March 2017.
Keywords:Community-acquired pneumonia, Metabolomics, Severity, Biomarker, Liquid chromatography–mass
spectrometry
* Correspondence:zcgao@bjmu.edu.cn
†Equal contributors
1Department of Respiratory and Critical Care Medicine, Peking University People’s Hospital, Beijing 100044, China
Full list of author information is available at the end of the article
Background
Community-acquired pneumonia (CAP) is a major cause of infection-associated death worldwide, with an incidence
of 30–50% in adults [1]. Due to the complexity and
het-erogeneity of the disease, diagnosis of CAP, especially for
severe CAP, remains a clinical challenge [2]. Failure to
provide timely treatment may result in water, electrolyte
and acid–base balance disorders, causing multiple organ
dysfunction and even septic shock in critically ill patients
[3,4]. Therefore, a timely diagnosis, assessment of the
se-verity of CAP and initiation of appropriate treatment can
improve patients’outcomes.
Biomarkers can facilitate early severity assessment of diseases, as well as help predict treatment response and develop new insights into ongoing pathophysiological
pro-cesses [2,5]. In recent years, the focus of the discovery of
CAP biomarkers has been increasingly directed towards molecular expression profiles, including gene and protein expression biomarkers in body fluids, for the diagnosis
and clinical management of pneumonia [2,6–10]. Further
downstream in the biologic system, however, are small metabolites such as amino acids, carbohydrates or lipids, some of which play important roles in homeostasis and disease states, contributing to processes such as redox balance, oxidative stress, signalling, apoptosis and inflam-mation; these metabolites can therefore provide a more
relevant and amplified signature in CAP [11]. A few
meta-bolomics studies have offered a powerful approach for biomarker discovery and for elucidating underlying
mech-anisms of pneumonia [12–14], but none of the studies so
far has been focused on changes in the metabolic profiles in CAP patients with different severity, and none had gone beyond the discovery phase.
In the current study, untargeted metabolomics research using liquid chromatography with tandem mass spectrom-etry (LC-MS/MS) was performed to identify CAP-related metabolic signatures. The identified metabolites were evaluated in the validation cohort by targeted assays. The relationship between the identified metabolites and the clinical severity of CAP as well as the determining per-formance for severe CAP were then investigated.
Methods Study design
The study samples were obtained from the multi-centre CAP biological specimen bank of the respiratory and critical care medicine department of Peking University
People’s Hospital (PKUPH). All of the obtained CAP
samples were originally collected from patients hospital-ized in the respiratory medicine department or intensive care unit (ICU) of six hospitals in China from January 2013 to February 2017. The study was approved by the Institutional Review Board of the PKUPH (No. 2011-83)
and registered at ClinicalTrials.gov. Written informed
consent was obtained from each participant.
The diagnosis criteria for CAP included the following
[15]: symptom onset began in communities; presenting
with clinical manifestations of pneumonia (recent ap-pearance of cough, expectoration or exacerbated symp-toms of the previous respiratory diseases, accompanied by or without chest pain, dyspnoea or haemoptysis; fever; signs of pulmonary consolidation and/or moist rales in auscultation; and peripheral white blood cell
(WBC) count > 10 × 109/L or < 4 × 10⁹/L); and a new
pulmonary infiltrate on chest radiograph.
Severe CAP was diagnosed by the presence of at least one major criterion or at least three minor criteria
out-lined by the American Thoracic Society [16]. The main
criteria included: requirement for invasive mechanical ventilation; and occurrence of septic shock with the need for vasopressors. The minor criteria were as follows:
respiratory rate≥30 breaths/min; PaO2/FiO2ratio≤250;
multi-lobar infiltrates; confusion/disorientation; uraemia
(BUN level≥20 mg/dl); leucopenia (WBC < 4 × 10⁹/L)
as a result of infection; thrombocytopenia (platelet
count < 100 × 109/L); hypothermia (core temperature
< 36 °C); and hypotension requiring aggressive fluid resuscitation.
Patients with evidence of nosocomial infection, active pulmonary tuberculosis, malignancy, severe immunosup-pression, non-infectious interstitial lung disease, pul-monary embolism and pregnancy were excluded. During the same period, healthy volunteers or subjects who vis-ited the outpatient department of PKUPH for a routine health examination and were without CAP were also en-rolled as a control group. Baseline clinical parameters of CAP patients were obtained from their clinical records and then uploaded to an online case management system of Severe Acute Respiratory Infectious Disease in China by their physicians. The primary endpoint repre-sentative of severe CAP was defined as death within 30 days following inclusion. The secondary endpoint was invasive mechanical ventilation or ICU admission within 30 days following study inclusion. Outcomes were assessed at hospital discharge, and by structured tele-phone interviews at 30 days following inclusion.
Sample collection and preparation
All of the participants were in an overnight fasting state, and 5 ml of peripheral venous blood was taken in the morning within 48 h of hospital admission. The blood was then allowed to clot for 30 min at 4 °C,
followed by centrifugation at 1500 × gfor 15 min. The
serum supernatant was then collected and stored at −
80 °C until further use.
Before testing, the serum samples were thawed at 4 °C
L-tryptophan-d5, L-glutamine-13C5, L-glutamine-15N2, terfenadine and propranolol as internal standards) was
added to 100 μl aliquots of the serum samples to
precipitate the proteins. After vortex-blending for 15 s
and incubation at−80 °C for 1 h, the mixture was
cen-trifuged at 13,400 × g for 20 min at 4 °C. The
super-natant was then transferred to a new 1.5-ml Eppendorf
tube and dried before storage in the −80 °C freezer. A
pooled quality control (QC) sample solution was pre-pared by combining equal volumes of serum from each sample and treated using the same procedure already de-scribed. Before experimental sample analyses, six QCs were injected to stabilize the instrument. The analysis sequence of the samples to be tested was randomized with a QC sample between every 10 experimental sam-ples. QC samples were used to monitor the reliability of the whole experiment including sample preparation and LC-MS/MS sequence runs.
Untargeted LC-MS/MS analysis and metabolite identification
Details of liquid chromatography–mass spectrometry-based
metabolomics analyses are described in Additional file 1.
Samples were analysed using an Ultimate 3000 UHPLC
(Dionex) system coupled to a Thermo Q-Exactive (Orbitrap) mass spectrometer (Thermo Fisher Scien-tific, San Jose, CA, USA).
Two levels of identification were performed simultan-eously using TraceFinder (Thermo Fisher Scientific, San Jose, CA, USA). Metabolites were first potentially identi-fied according to the endogenous MS database by accurate masses. At the same time, the metabolites that matched with the spectra in the fragment database were confirmed at the tandem mass spectrometry level. For precursor and fragment matching, 10 ppm and 15 ppm mass tolerance was applied. Moreover, a 0.25-min retention time shift was allowed for quantification.
Multivariate data analysis
Multivariate statistical analysis for the MS/MS data was performed using SIMCA 14.0 software (Umetrics AB, Umea, Sweden). Unsupervised principal component ana-lysis (PCA) was employed to assess the quality, homogen-eity, outlier identification and dominating trends of the group separation inherent in the dataset. A supervised orthogonal partial least squares discriminant analysis (OPLS-DA) was applied to distinguish between the classes and to identify the differentially expressed variables.
[image:3.595.56.538.408.703.2]Corresponding variable importance in the projection (VIP) values and S-plot were generated in the OPLS-DA model. The quality of the multivariate statistical analysis (MVA) models was evaluated by cross-validation analysis of
vari-ance (CV-ANOVA),R2YandQ2values. Student’sttest was
used to determine the significance of each metabolite between two groups, and the relevant false discovery rates
(FDR) based on thepvalues were estimated. Variables with
covariance > 0.1 on the S-plot, VIP > 1 and FDR < 0.05 were considered the highest potential metabolites that could dis-criminate CAP from controls and for severity assessment. These metabolites were then identified through matching accurate mass and MS/MS spectra using in-house metabol-ite MS/MS databases. Pathway analysis of selected differen-tial metabolites, a heatmap with a Euclidean distance measure of relative intensity of metabolites (logarithmic
scale) and a Pearson’s correlation heatmap were generated
using MetaboAnalyst 3.0 (http://www.metaboanalyst.ca/;
Wishart Research Group, University of Alberta, USA) [17].
Validation and quantification of metabolites
Targeted metabolomics and absolute quantification was performed for differential metabolites identified between CAP patients and controls under the same experimental conditions and procedures in the validation cohort.
Con-centrations (μg/ml) of the metabolites were calculated
by area response ratio (analyte peak area/isotopically labelled internal standard peak area) from independent calibration curves for each metabolite.
Statistical analysis
Values for categorical variables were described as percent-ages and those for continuous variables were expressed as median (interquartile range (IQR)). Comparisons between
groups were performed using the Mann–WhitneyUtest or
Kruskal–Wallis test for continuous variables, and the
chi-square test or Fisher’s exact test for categorical variables, as
appropriate. Pearson’s correlation coefficients (r) were
cal-culated to assess the strength and direction of linear rela-tionships between the identified metabolites, and clinical parameters included WBC, percentage of neutrophils (NE%), erythrocyte sedimentation rate (ESR), C-reactive protein (CRP), procalcitonin (PCT), confusion, urea level, respiratory rate, blood pressure, and age > 65 years (CURB-65), pneumonia severity index (PSI) and Acute Physiology and Chronic Health Evaluation II (APACHE II) scores. Goodness of the diagnostic method was evalu-ated using a receiver operating characteristic (ROC) curve based on multivariate logistic regression data. Data were analysed using SPSS Statistics v19.0 (IBM, NY, USA) and MedCalc software version 15.8 (MedCalc Software,
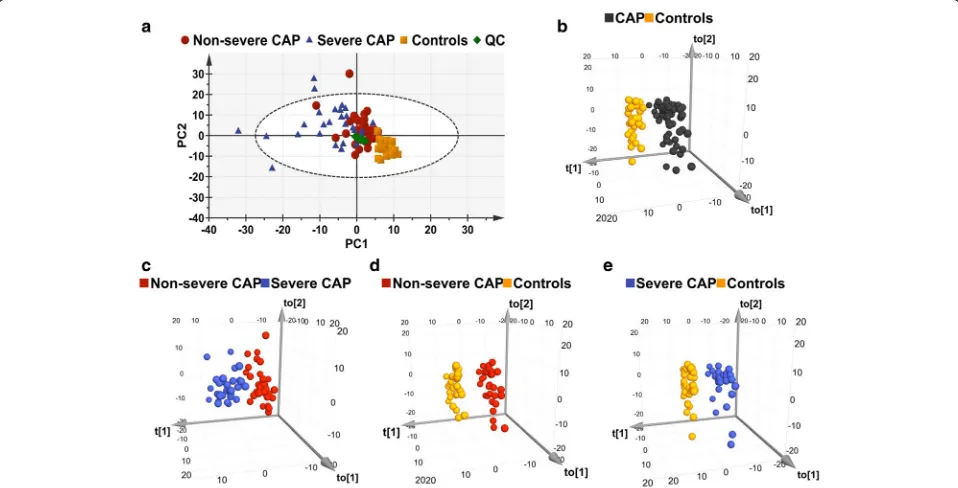
Fig. 2Multivariate statistical analysis of serum samples in discovery cohort.aPCA score plots. Five samples (four severe CAP and one non-severe CAP) are placed outside the ellipse that describes the 95% CI of Hotelling’s T-squared distribution.bOPLS-DA three-dimensional score plot discriminates all CAP subjects versus controls in discovery cohort (R2
Y= 0.937,Q2= 0.814,
p< 0.0001).cOPLS-DA score plots of non-severe CAP versus severe CAP groups (R2
Y= 0.757,Q2= 0.465,
p< 0.0001).dOPLS-DA score plots of non-severe CAP patients versus controls (R2
Y= 0.994,Q2= 0.955,
p< 0.0001).e
OPLS-DA score plots of severe CAP patients versus controls (R2
Y= 0.996,Q2= 0.854,
p< 0.0001).R2
[image:6.595.58.537.419.663.2]Ostend, Belgium). All statistics were two-tailed and the
significance level was defined atp< 0.05.
Results
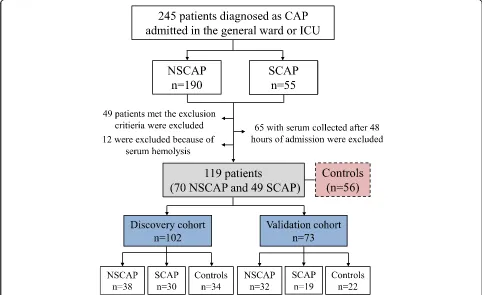
Demographic and clinical characteristics of participants From January 2013 to February 2017, 245 patients diag-nosed with CAP (190 with non-severe CAP and 55 with severe CAP) were screened. The flowchart of the study
population enrolment is shown in Fig. 1. A total of 175
subjects (119 CAP patients and 56 controls) were included
finally and divided into a discovery cohort (n= 102,
in-cluding 38 non-severe CAP patients, 30 severe CAP pa-tients, and 34 age and sex-matched controls) and a
validation cohort (n= 73, including 32 non-severe CAP
patients, 19 severe CAP patients and 22 controls). Demo-graphic and clinical characteristics of the participants are
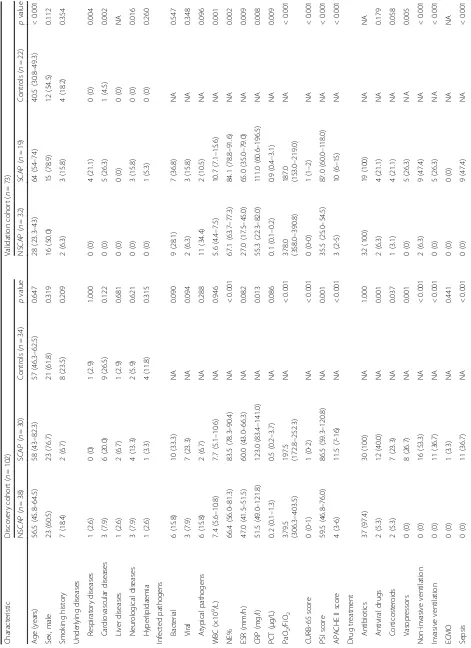
presented in Table1.
In the discovery cohort, there were no significant differ-ences in terms of age, gender, underlying disease, smoking history or infected pathogens among the three groups
(p> 0.05). NE% and the levels of serum CRP were both
greater in the severe CAP group than in the non-severe
group (p< 0.05). CURB-65, PSI and APACHE II scores in
the severe CAP group were all significantly higher than in
the non-severe CAP group (allp< 0.05). Patients with
se-vere CAP were more frequently receiving antiviral drugs, corticosteroids, vasopressors treatment and
ven-tilation (p< 0.05) during hospitalization, and also were
more likely to develop sepsis and be admitted to the
ICU (p< 0.001 for both comparisons).
In the validation cohort, patients with severe CAP were
older than those with non-severe CAP (p< 0.001). The
pro-portion of underling diseases such as respiratory diseases, cardiovascular diseases and neurological diseases were all
significantly higher in the severe CAP group (p< 0.05). The
in-hospital mortality and 30-day mortality in patients with severe CAP were both substantially higher compared to
those with non-severe CAP (p< 0.001).
Untargeted metabolomics and pathway analysis
Representative base peak chromatograms of the serum samples from subjects with non-severe CAP, subjects with severe CAP and healthy controls in the discovery
cohort are shown in Additional file2: Figure S1. A total
of 820 metabolites including 367 in the election spray
[image:7.595.62.541.394.698.2]ionization positive (ESI+) mode and 453 in the ESI–
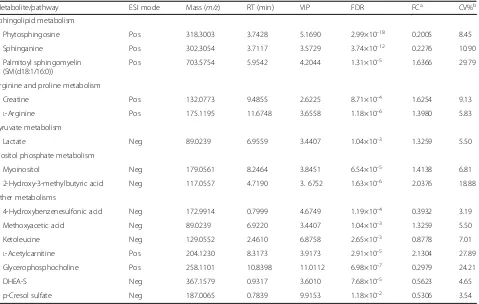
Table 2Fifteen metabolites discriminating CAP from controls in the discovery cohort
Metabolite/pathway ESI mode Mass (m/z) RT (min) VIP FDR FCa CV%b
Sphingolipid metabolism
Phytosphingosine Pos 318.3003 3.7428 5.1690 2.99×10⁻¹⁸ 0.2005 8.45
Sphinganine Pos 302.3054 3.7117 3.5729 3.74×10⁻¹² 0.2276 10.90
Palmitoyl sphingomyelin (SM(d18:1/16:0))
Pos 703.5754 5.9542 4.2044 1.31×10⁻⁵ 1.6366 29.79
Arginine and proline metabolism
Creatine Pos 132.0773 9.4855 2.6225 8.71×10⁻⁴ 1.6254 9.13
L-Arginine Pos 175.1195 11.6748 3.6558 1.18×10⁻⁶ 1.3980 5.83
Pyruvate metabolism
Lactate Neg 89.0239 6.9559 3.4407 1.04×10⁻³ 1.3259 5.50
Inositol phosphate metabolism
Myoinositol Neg 179.0561 8.2464 3.8451 6.54×10⁻⁵ 1.4138 6.81
2-Hydroxy-3-methylbutyric acid Neg 117.0557 4.7190 3. 6752 1.63×10⁻⁶ 2.0376 18.88
Other metabolisms
4-Hydroxybenzenesulfonic acid Neg 172.9914 0.7999 4.6749 1.19×10⁻⁴ 0.3932 3.19
Methoxyacetic acid Neg 89.0239 6.9220 3.4407 1.04×10⁻³ 1.3259 5.50
Ketoleucine Neg 129.0552 2.4610 6.8758 2.65×10⁻³ 0.8778 7.01
L-Acetylcarnitine Pos 204.1230 8.3173 3.9173 2.91×10⁻⁵ 2.1304 27.89
Glycerophosphocholine Pos 258.1101 10.8398 11.0112 6.98×10⁻⁷ 0.2979 24.21
DHEA-S Neg 367.1579 0.9317 3.6010 7.68×10⁻⁵ 0.5623 4.65
p-Cresol sulfate Neg 187.0065 0.7839 9.9153 1.18×10⁻² 0.5306 3.54
CAPcommunity-acquired pneumonia,ESIelection spray ionization,RTretention time,VIPvariable importance in the projection,FDRfalse discovery rate,FCfold change,CVcoefficient of variation,Pospositive,Negnegative,DHEA-Sdehydroepiandrosterone sulfate
a
Ratio of relative high intensity present in CAP patients to controls
b
mode were detected by untargeted LC-MS/MS analysis. Among them, 775 metabolites including 332 in the ESI+
and 443 in the ESI– mode were identified with known
MS/MS information, and were subjected to PCA and OPLS-DA analysis.
PCA performed on all of the subjects revealed differ-ences in the metabolic profiles of patients with
non-severe CAP and non-severe CAP, and controls (Fig. 2a). QC
samples are tightly clustered on the PCA plot, indicating the good analytical repeatability and stability of the in-struments. The OPLS-DA score plot showed a clear separation between the CAP subjects and controls
(Fig.2b), with good fitting and predictive performances
(R2Y= 0.937,Q2= 0.814). Any other comparison of two
groups between patients with non-severe CAP versus
severe CAP (Fig. 2c), patients with non-severe CAP
versus controls (Fig.2d), and patients with severe CAP
versus controls (Fig.2e) showed clear discrimination.
With a covariance (absolute p) > 0.1 on the S-plot
(Additional file2: Figure S2), VIP > 1 and FDR < 0.05 for
the comparison between CAP and controls, 15 metabo-lites were found to be significantly dysregulated in CAP
(Table 2). The coefficient of variation (CV) of the 15
metabolites varied from 3.19 to 29.79% with a median of 7.73%, which indicated the robustness of the metabolo-mics platform. The relative intensity of palmitoyl
sphingo-myelin (SM(d18:1/d16:0), creatine, L-arginine, lactate,
myoinositol, 2-hydroxy-3-methylbutyric acid,
methoxya-cetic acid and L-acetylcarnitine was increased in CAP
patients and that of phytosphingosine, sphinganine, 4-hydroxybenzenesulfonic acid, ketoleucine, glyceropho-sphocholine, dehydroepiandrosterone sulfate (DHEA-S)
a
b
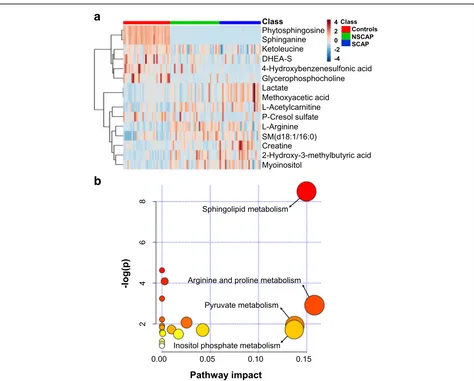
[image:8.595.62.536.85.466.2]and p-Cresol sulfate was decreased. A heatmap and the
box–whisker plots indicating the relative intensity of these
metabolites in the three groups are displayed in Fig. 3a
and Additional file2: Figure S3, respectively. Pathway
ana-lysis of the 15 identified metabolites dysregulated in the CAP patients mainly revealed four pathways that were af-fected: sphingolipid metabolism, arginine and proline me-tabolism, pyruvate meme-tabolism, and inositol phosphate
metabolism (Fig.3b).
Eight metabolites could distinguish patients with severe CAP from those with non-severe CAP and are
presented in Additional file 3: Tables S1 and S4. The
levels of creatine, lactate and methoxyacetic acid grad-ually increased with CAP severity, while those of DHEA-S and 4-hydroxybenzenesulfonic acid showed the oppos-ite pattern. In addition, lower relative abundances of phytosphingosine and sphinganine were observed in the non-severe CAP group compared to the severe CAP group and controls. The metabolites changes between severe CAP patients versus controls, and between non-severe CAP patients versus controls, and are
summa-rized in Additional file3: Tables S2–S4.
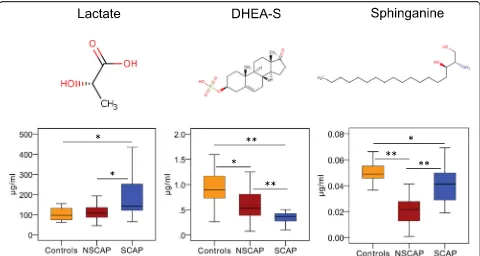
[image:9.595.58.538.87.343.2]Fig. 4Three metabolites identified that can discriminate severe CAP from non-severe CAP in validation cohort. Chemical structures of three metabolites. Box–whisker plots of concentrations of three metabolites in three groups. Horizontal line represents median; bottom and the top of box represent 25th and the 75th percentiles; whiskers represent 5% and 95% percentiles. *p< 0.01, **p< 0.001. CAP community-acquired pneumonia, DHEA-S dehydroepiandrosterone sulfate, NSCAP non-severe CAP, SCAP severe CAP
Table 3Eight metabolite concentrations in severe CAP and non-severe CAP patients of the validation cohort
Metabolite Concentration (μg/ml) pvalue Tendency
SCAP (n= 19) NSCAP (n= 32)
Sphinganine 0.041 (0.028–0.050) 0.022 (0.012–0.028) < 0.001 Controls > SCAP > NSCAP Creatine 5.420 (3.447–8.711) 2.481 (1.739–3.767) < 0.001 SCAP > controls > NSCAP
L-Arginine 5.043 (4.105–5.753) 5.905 (4.622–7.047) 0.016 NSCAP > SCAP > controls
Lactate 141.343
(120.670–273.794)
107.224 (86.814–137.551)
0.001 SCAP > NSCAP > controls
L-Acetylcarnitine 0.076 (0.029–0.225) 0.063 (0.042–0.098) 0.667 Controls > SCAP > NSCAP Glycerophosphocholine 4.438 (2.596–8.170) 5.732 (3.048–7.212) 0.181 Controls > NSCAP > SCAP DHEA-S 0.370 (0.229–0.425) 0.532 (0.379–0.812) < 0.001 Controls > NSCAP > SCAP p-Cresol sulfate 0.109 (0.004–0.801) 0.073 (0.012–0.203) < 0.001 Controls > SCAP > NSCAP Data presented as median (interquartile range)
[image:9.595.57.539.567.716.2]Targeted metabolomics and absolute quantification Targeted metabolomics were performed in another popu-lation to validate the observed trend of the identified 15 differential metabolites between CAP patients and con-trols from the discovery cohort. The results showed that the secondary mass spectra of methoxyacetic acid were representative of its isomer, lactate. Six metabolites
including phytosphingosine, palmitoyl sphingomyelin
(SM(d18:1/16:0)), myoinositol, 2-hydroxy-3-methylbutyric acid, 4-hydroxybenzenesulfonic acid and ketoleucine ex-hibited low responses in the targeted assays, so only eight
metabolites including sphinganine, lactate, DHEA-S,L
-ar-ginine, p-Cresol sulfate,L-acetylcarnitine, creatine and
gly-cerophosphocholine were ultimately validated and
a
b
[image:10.595.58.540.86.558.2]absolute quantified. The alternation trends of five metabo-lites among three groups including sphinganine, p-Cresol
sulfate, DHEA-S, lactate and L-arginine in the validation
cohort were consistent with those in the discovery cohort. Compared with controls, CAP patients showed lower
concentrations of the first three metabolites (p< 0.001)
and higher concentrations of the last two metabolites
(p< 0.05) (Additional file 3: Table S5). Lactate levels
were found to increase with CAP severity, while DHEA-S levels reduced gradually with increasing
se-verity of CAP (Fig.4and Table3).
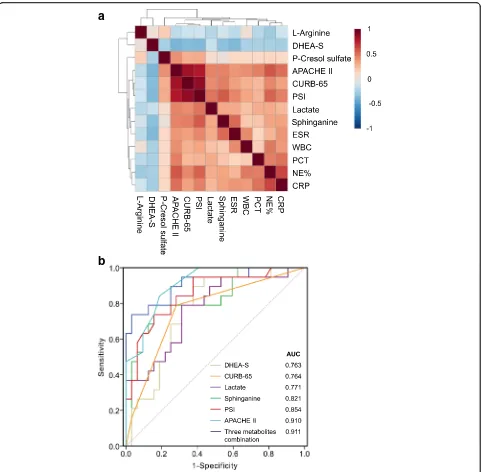
Relationship to clinical parameters and assessment performance
The relationships between five metabolites—sphinganine,
p-Cresol sulfate, DHEA-S, lactate andL-arginine—and the
clinical parameters were investigated by Pearson’s
correl-ation analysis (Fig.5a). The resulting correlation matrix is
presented in Additional file 3: Table S6. Sphinganine was
found to be positively correlated with CURB-65 (r= 0.456,
p= 0.001), PSI (r= 0.570, p< 0.001) and APACHE II
(r= 0.442, p= 0.001) scores. It was also positively
re-lated with NE% (r= 0.336, p= 0.016), ESR (r= 0.519,
p< 0.001) and CRP (r= 0.340, p= 0.015). Lactate and
p-Cresol sulfate were observed to show a positive correlation
with CURB-65, PSI and APACHE II (all p< 0.05) scores,
whereas DHEA-S was negatively related with the three
scoring systems (allp< 0.05).L-Arginine was not correlated
with these clinical parameters except for NE% (r=−0.283,
p= 0.044).
ROC analysis was performed to investigate whether the five identified metabolites could be efficiently utilized for building a sensitive biosignature of severe status in CAP. As
shown in Table4and Fig.5b, sphinganine (AUC 0.821,p<
0.001) exhibited a better performance than CURB-65 score
(AUC 0.764) to predict the severity of CAP, with a sensitiv-ity of 73.7% and specificsensitiv-ity of 84.4%. The AUCs for lactate and DHEA-S were 0.771 and 0.763, respectively. The three metabolites were not superior to PSI (AUC 0.854) and APACHE II (AUC 0.910) scores, while the multiple logistic regression analysis revealed that a combination of them had
an AUC value of 0.911 (95% CI 0.825–0.998), with 83.7%
sensitivity and 96.9% specificity, indicating that they can serve as a metabolite panel of potential biomarkers for assessing CAP severity. The optimal cut-off value of sphinganine, DHEA-S and lactate to discriminate severe
CAP from non-severe CAP was calculated to be 0.029μg/
ml, 0.431μg/ml and 120.021μg/ml, respectively. Regarding
the remaining two metabolites, L-arginine showed a poor
ability in predicting severe CAP (AUC = 0.689, p= 0.025)
and p-Cresol sulfate had no prognostic value for CAP
severity prediction (AUC = 0.503,p= 0.969).
Discussion
The current study describes a novel application of meta-bolomics in determining the metabolic profile and sever-ity assessment of CAP. Untargeted metabolic analysis could clearly discriminate CAP patients from the age and sex-matched controls, suggesting that CAP causes a significant disruption in biochemical homeostasis. Fif-teen metabolites showed key differences between CAP patients and controls in our discovery cohort. Pathway analysis revealed that these dysregulated metabolites were potentially related to the metabolic pathways of sphingolipid, arginine and proline, pyruvate and inositol phosphate. After analysing the relationships between the identified metabolites with clinical parameters, and cal-culating the diagnostic efficacy of these metabolites
using ROC, we concluded that three metabolites—
[image:11.595.57.540.99.265.2]sphin-ganine, lactate and DHEA-S, related to the severity of
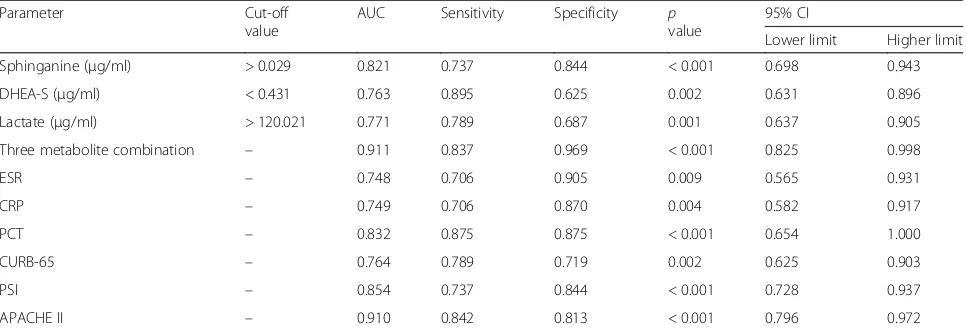
Table 4Areas under the curve of variable parameters for determining the severity of CAP
Parameter Cut-off
value
AUC Sensitivity Specificity p value
95% CI
Lower limit Higher limit
Sphinganine (μg/ml) > 0.029 0.821 0.737 0.844 < 0.001 0.698 0.943
DHEA-S (μg/ml) < 0.431 0.763 0.895 0.625 0.002 0.631 0.896
Lactate (μg/ml) > 120.021 0.771 0.789 0.687 0.001 0.637 0.905
Three metabolite combination – 0.911 0.837 0.969 < 0.001 0.825 0.998
ESR – 0.748 0.706 0.905 0.009 0.565 0.931
CRP – 0.749 0.706 0.870 0.004 0.582 0.917
PCT – 0.832 0.875 0.875 < 0.001 0.654 1.000
CURB-65 – 0.764 0.789 0.719 0.002 0.625 0.903
PSI – 0.854 0.737 0.844 < 0.001 0.728 0.937
APACHE II – 0.910 0.842 0.813 < 0.001 0.796 0.972
CAP—might represent a panel of potential small mol-ecule biomarkers for assessing CAP severity.
Some of the preceding metabolomics studies aiming to identify biomarkers associated with diseases adopted the
criteria based on fold change (FC), VIP, FDR or pvalue
to select the differential metabolites [18,19]. The S-plot
generated from OPLS-DA analysis visualizes both the covariance and correlation between the metabolites and the modelled class designation, and thereby it can help in identifying statistically significant and potentially bio-chemically significant metabolites, based both on
contri-butions to the model and their reliability [20]. Therefore,
we strictly limited the criteria to select the differential metabolites in this study, based on the combination of VIP > 1, FDR < 0.05 and covariance > 0.1 on the S-plot, and finally identified 15 differential metabolites between CAP patients and the control group.
Among the identified potential metabolic biomarkers for CAP, the levels of sphinganine in the serum of CAP patients is lower than for controls, and it was observed positively correlated with NE%, ESR and CRP, so it might reflect the presence of an infection and inflamma-tory response. The serum concentration of sphinganine in severe CAP patients is higher than that in non-severe CAP patients, and lower than controls, but the AUC to distinguish between non-severe CAP and severe CAP was 0.821 and it correlated positively with CURB-65, PSI and APACHE II scores. We therefore considered that it could roughly be related to the severity of CAP. Sphin-ganine is a major component of sphingolipids, which are one of the active constituents of the mucous secreted by the alveolar epithelium, which protects the lung tissue
from invading pathogens [21].One of the important
as-pects of sphingolipids and their primary and intermedi-ate metabolites is their interconvertible nature, which enables them to both integrate and regulate a plethora
of cellular functions [22, 23]. Previous studies have
shown that Mycoplasma pneumonia infection in the
lungs results in the induction of autoantibody produc-tion against glycosphingolipids, suggesting the involve-ment of sphingolipids in promoting lung inflammation
[24, 25]. Moreover, compelling evidence indicates that
certain pulmonary pathogens such as Chlamydia cause
the trafficking of sphingolipids from the trans-Golgi apparatus towards the inclusion membrane to ensure their intracellular survival, which contributes to the
immune-evading mechanisms of bacteria [26].
There-fore, we speculated that sphingolipids might be involved in pulmonary inflammation during infection.
We found that the DHEA-S concentration was lower in the CAP patients than in controls, and its levels were inversely correlated with disease severity. Dehydroepian-drosterone (DHEA) is the most abundant adrenal steroid hormone in humans, and DHEA-S, the sulphated ester
of DHEA, is the hydrophilic storage form bound to
albu-min in the bloodstream [27]. It has been shown that
DHEA modulates the function of the immune system
[28]. A previous study reported that, upon activation by
a variety of stimuli such as mitogens or antigens, CD4+
T cells in healthy adults pre-treated with DHEA pro-duced significantly greater amounts of interleukin (IL)-2
and mediated more potent cytotoxicity than CD4+ T
cells not pre-treated with DHEA [29]. In another study,
patients with tuberculosis showed decreased DHEA levels compared with healthy control subjects, and pa-tients with the lowest DHEA activity showed the highest
disease severity [30]. Moreover, biological activity for
DHEA-S was found to be able to enhance the activity of human neutrophils. Therefore, diminished levels of DHEA-S could have adverse effects, especially in relation
to susceptibility to bacterial infection [31]. Based on these
findings, we speculated that suppression of DHEA-S levels in patients with severe CAP might further downregulate the immune response to foreign pathogens. This indicates that DHEA or DHEA-S shows potential for use in alterna-tive therapies, as a supplement to currently used long-term antibiotic treatment regimens, or as a preventive strategy against disease recurrence.
During lung infection, glycolysis results in the pro-duction of pyruvate, which is converted by lactate
de-hydrogenase to lactate under anaerobic conditions [32].
Serum lactate levels have been use for many years in the assessment of tissue hypoxia and perfusion status, and are often used clinically as an indicator of the se-verity of sepsis and of patient outcomes in sepsis/septic
shock [33–35]. A previous study showed that a lactate
level in arterial blood gas of > 1.8 mmol/L at admission could predict a need for mechanical ventilation, vaso-pressors, ICU admission or hospital mortality in
pa-tients with CAP [36]. In our study, serum lactate levels
were slightly increased in the patients with non-severe CAP and highly increased in the patients with severe CAP. The increase might reflect the state of anaerobic glycolysis of glucose during severe pulmonary infec-tions. Furthermore, ROC analysis suggested that high serum lactate levels could predict the occurrence of
se-vere CAP, with an optimal cut-off of > 120.021 μg/ml
(1.34 mmol/L). Lactate could therefore be considered as a potential metabolic biomarker for the assessment of risk of severe CAP.
It is important to note that the predictability for
separ-ation of severe CAP from the controls (Q2= 0.854) in
the OPLS-DA model is not better than the separation
for non-severe CAP from controls (Q2= 0.955), while we
study, which might have an impact on the degree of distinction and the predictability for separation between severe CAP and the control group.
Our independent validation study adds tremendous validity to our initial findings; nevertheless, biomarker discovery is no small undertaking and typically requires years of validation testing before the application phase is
reached [11]. This study is just an initial step in CAP
severity assessment using a metabolomics approach. It has certain limitations. First of all, due to the small sam-ple size of non-survivors in our validation cohort, the prognostic predicative value of the identified potential metabolic biomarkers for CAP could not be determined precisely. Next, the proportion of ventilation in patients with severe CAP was significantly higher than that in non-severe CAP in this study. The ventilation condition might affect the metabolomics pictures, so additional studies would be needed to evaluate the serum meta-bolic status of patients with CAP before mechanical ven-tilation. Subsequently, the convalescence-phase serum samples from the CAP patients in our study were not obtained for further analyses, and therefore we were un-able to identify changes in metabolite concentrations over time, which might be predictive of disease progres-sion, therapeutic response or clinical outcome. Addition-ally, we could not specifically elucidate the roles of the identified metabolites in CAP pathogenesis. Elaborate studies consisting of a larger external cohort are needed to validate the utility of the identified potential bio-markers, and research aimed at achieving the long
sought-after goal—integration of multi-omics data in
CAP research—will certainly support the development
of precision medicine.
Conclusions
Our results suggest that metabolomics approaches based on LC-MS/MS can be successfully used to reveal meta-bolic changes in CAP and establish a metabolite signa-ture related to disease severity. The potential molecular metabolites identified in this study and their relevant roles may provide valuable clues for future research on CAP biomarker discovery and for the development of precision medicine for patients with CAP.
Additional files
Additional file 1:Supplemental methods. Liquid chromatography–mass
spectrometry (LC-MS) analysis. (DOCX 19 kb)
Additional file 2:Supplemental Figures.Figure S1.Metabolite base
peak chromatograms of serum samples from a patient in three groups: a non-severe CAP; b severe CAP; c controls.Figure S2.S-plots identifying putative biomarkers on the basis of OPLS-DA models: a CAP patients versus controls; b severe CAP versus non-severe CAP patients.Figure S3.
Box–whisker plots of relative intensity of 15 metabolites changed in CAP patients compared to controls. Horizontal line represents median; bottom
and top of the box represent 25th and the 75th percentiles; whiskers represent 5% and 95% percentiles. *FDR < 0.05, **FDR < 0.001. NSCAP non-severe CAP, SCAP severe CAP. (DOCX 7213 kb)
Additional file 3:Supplemental tables.Table S1.Changes in eight
metabolites between severe and non-severe CAP patients in discovery cohort.
Table S2.Changes in 17 metabolites between severe CAP patients and controls in discovery cohort.Table S3.Changes in 15 metabolites between non-severe CAP patients and controls in discovery cohort.Table S4.Most significant differential metabolites changed between any two groups in discovery cohort.Table S5.Changes in eight metabolites between CAP patients and controls in validation cohort.Table S6.Correlation analysis between five metabolites for CAP and clinical parameters. (DOCX 43 kb)
Abbreviations
APACHE II:Acute Physiology and Chronic Health Evaluation II; AUC: Area under the curve; CAP: Community-acquired pneumonia; CRP: C-reactive protein; CURB-65: Confusion, urea level, respiratory rate, blood pressure, and age > 65 years; CV: Coefficient of variation; CV-ANOVA: Cross-validation analysis of variance; DHEA-S: Dehydroepiandrosterone sulfate; ESI: Election spray ionization; ESR: Erythrocyte sedimentation rate; FC: Fold change; FDR: False discovery rates; IQR: Interquartile range; LC-MS: Liquid
chromatography–mass spectrometry; OPLS-DA: Orthogonal partial least squares discriminant analysis; PaO2/FiO2: Ratio of arterial oxygen tension to inspired oxygen fraction; PCA: Principal component analysis; PCT: Procalcitonin; PSI: Pneumonia severity index; ROC: Receiver operating characteristic; VIP: Variable importance in the projection; WBC: White blood cell
Acknowledgements
The authors wish to thank staff members of the cooperating hospitals (Jichao Chen, MS, Department of Respiratory Medicine, Central Hospital of China Aerospace Corporation, Beijing, China; Guizhen Tian, MS, Department of Respiratory Medicine, 263th Hospital of Chinese PLA, Beijing, China; and Chunliang Yan, MS, Department of Respiratory and Critical Care Medicine, Beijing Aerospace General Hospital, Beijing, China) for assistance with samples and clinical data collection. They are also grateful to the Metabolomics Facility at the Technology Center for Protein Sciences, Tsinghua University for technical support.
Funding
The work was funded by grants from the National Key Research and Development Program“Precision Medicine Research”from the Ministry of Science and Technology of China (2016YFC0903800).
Availability of data and materials
All data generated and/or analysed during this study are included in this published article and its supplementary information files.
Authors’contributions
PN and YLZ contributed to metabolomic profiling analysis, data collection, statistical analysis and interpretation. QZL, YK, YZ, RBZ, YX, DHY, WX, KQW, SCA and YSC contributed substantially to the study design, samples and clinical data collection. XHL contributed to the biostatistical analysis of the data. ZCG had full access to all data in the study, contributed to the study concept and design, interpretation and drafting of the manuscript, and approved the final manuscript. All authors read and approved the final manuscript.
Ethics approval and consent to participate
The study protocol was approved by the Institutional Review Board of the Peking University People’s Hospital (Beijing, China). Written informed consent was obtained from all patients or their surrogates.
Competing interests
The authors declare that they have no competing interests.
Publisher’s Note
Author details
1Department of Respiratory and Critical Care Medicine, Peking University People’s Hospital, Beijing 100044, China.2National Protein Science Technology Center, Tsinghua University, Beijing, China.3School of Life Sciences, Tsinghua University, Beijing, China.4CAS Key Laboratory of Genome Sciences and Information, Beijing Institute of Genomics, Chinese Academy of Sciences, Beijing, China.5National Engineering Research Center for Beijing Biochip Technology, Beijing, China.6Department of Respiratory Medicine, Fujian Provincial Hospital, Fuzhou, China.7Department of Respiratory Medicine, First Hospital of Tsinghua University, Beijing, China.
Received: 30 December 2017 Accepted: 23 April 2018
References
1. Welte T, Torres A, Nathwani D. Clinical and economic burden of community-acquired pneumonia among adults in Europe. Thorax. 2012;67:71–9. 2. Christ-Crain M, Opal SM. Clinical review: The role of biomarkers in the
diagnosis and management of community-acquired pneumonia. Crit Care. 2010;14:203.
3. Liu W, Peng L, Hua S. Clinical significance of dynamic monitoring of blood lactic acid, oxygenation index and C-reactive protein levels in patients with severe pneumonia. Exp Ther Med. 2015;10:1824–8.
4. Aliberti S, Brambilla AM, Chalmers JD, Cilloniz C, Ramirez J, Bignamini A, et al. Phenotyping community-acquired pneumonia according to the presence of acute respiratory failure and severe sepsis. Respir Res. 2014;15:27.
5. Biron BM, Ayala A, Lomas-Neira JL. Biomarkers for sepsis: what is and what might be? Biomark Insights. 2015;10:7–17.
6. Scicluna BP, Klein Klouwenberg PM, van Vught LA, Wiewel MA, Ong DS, Zwinderman AH, et al. A molecular biomarker to diagnose community-acquired pneumonia on intensive care unit admission. Am J Respir Crit Care Med. 2015;192:826–35.
7. Severino P, Silva E, Baggio-Zappia GL, Brunialti MK, Nucci LA, Rigato O Jr, et al. Patterns of gene expression in peripheral blood mononuclear cells and outcomes from patients with sepsis secondary to community acquired pneumonia. PLoS One. 2014;9:e91886.
8. Lin WC, Lu SL, Lin CF, Chen CW, Chao L, Chao J, et al. Plasma kallistatin levels in patients with severe community-acquired pneumonia. Crit Care. 2013;17:R27.
9. Schuetz P, Wolbers M, Christ-Crain M, Thomann R, Falconnier C, Widmer I, et al. Prohormones for prediction of adverse medical outcome in community-acquired pneumonia and lower respiratory tract infections. Crit Care. 2010;14:R106.
10. Mauri T, Coppadoro A, Bombino M, Bellani G, Zambelli V, Fornari C, et al. Alveolar pentraxin 3 as an early marker of microbiologically confirmed pneumonia: a threshold-finding prospective observational study. Crit Care. 2014;18:562.
11. Serkova NJ, Standiford TJ, Stringer KA. The emerging field of quantitative blood metabolomics for biomarker discovery in critical illnesses. Am J Respir Crit Care Med. 2011;184:647–55.
12. Slupsky CM, Rankin KN, Fu H, Chang D, Rowe BH, Charles PG, et al. Pneumococcal pneumonia: potential for diagnosis through a urinary metabolic profile. J Proteome Res. 2009;8:5550–8.
13. Laiakis EC, Morris GA, Fornace AJ, Howie SR. Metabolomic analysis in severe childhood pneumonia in the Gamebia, West Africa: findings from a pilot study. PLoS One. 2010;5:e12655.
14. Banoei MM, Vogel HJ, Weljie AM, Kumar A, Yende S, Angus DC, et al. Plasma metabolomics for the diagnosis and prognosis of H1N1 influenza pneumonia. Crit Care. 2017;21:97.
15. Niederman MS, Mandell LA, Anzueto A, Bass JB, Broughton WA, Campbell GD, et al. Guidelines for the management of adults with community-acquired pneumonia. Diagnosis, assessment of severity, antimicrobial therapy, and prevention. Am J Respir Crit Care Med. 2001;163:1730–54. 16. Mandell LA, Wunderink RG, Anzueto A, Bartlett JG, Campbell GD, Dean NC,
et al. Infectious Diseases Society of America/American Thoracic Society Consensus Guidelines on the management of community-acquired pneumonia in adults. Clin Infect Dis. 2007;44(Suppl 2):S27–72.
17. Xia J, Wishart DS. Using MetaboAnalyst 3.0 for comprehensive metabolomics data analysis. Curr Protoc Bioinformatics. 2016;55:14.10.1–14.10.91. 18. Tan B, Qiu Y, Zou X, Chen T, Xie G, Cheng Y, et al. Metabonomics identifies
serum metabolite markers of colorectal cancer. J Proteome Res. 2013;12:3000–9.
19. Luies L, Mienie J, Motshwane C, Ronacher K, Walzl G, Loots DT. Urinary metabolite markers characterizing tuberculosis treatment failure. Metabolomics. 2017;13:124.
20. Wiklund S, Johansson E, Sjöström L, Mellerowicz EJ, Edlund U, Shockcor JP, et al. Visualization of GC/TOF-MS-based metabolomics data for identification of biochemically interesting compounds using OPLS class models. Anal Chem. 2008;80:115–22.
21. Wheelock CE, Goss VM, Balgoma D, Nicholas B, Brandsma J, Skipp PJ, et al. Application of‘omics technologies to biomarker discovery in inflammatory lung diseases. Eur Respir J. 2013;42:802–25.
22. Hanada K, Nishijima M. Selection of mammalian cell mutants in sphingolipid biosynthesis. Methods Enzymol. 2000;312:304–17.
23. Ohanian J, Ohanian V. Sphingolipids in mammalian cell signalling. Cell Mol Life Sci. 2001;58:2053–68.
24. Sharma L, Prakash H. Sphingolipids are dual specific drug targets for the management of pulmonary infections: perspective. Front Immunol. 2017;8:378. 25. Nishimura M, Saida T, Kuroki S, Kawabata T, Obayashi H, Saida K, et al.
Post-infectious encephalitis with anti-galactocerebroside antibody subsequent to Mycoplasma pneumoniae infection. J Neurol Sci. 1996;140:91–5.
26. Wolf K, Hackstadt T. Sphingomyelin trafficking in Chlamydia pneumoniae-infected cells. Cell Microbiol. 2001;3:145–52.
27. Dias TR, Alves MG, Almeida SP, Silva J, Barros A, Sousa M, et al. Dehydroepiandrosterone and 7-oxo-dehydroepiandrosterone in male reproductive health: implications of differential regulation of human Sertoli cells metabolic profile. J Steroid Biochem Mol Biol. 2015;154:1–11. 28. Oberbeck R, Dahlweid M, Koch R, van Griensven M, Emmendörfer A,
Tscherne H, et al. Dehydroepiandrosterone decreases mortality rate and improves cellular immune function during polymicrobial sepsis. Crit Care Med. 2001;29:380–4.
29. Suzuki T, Suzuki N, Daynes RA, Engleman EG. Dehydroepiandrosterone enhances IL2 production and cytotoxic effector function of human T cells. Clin Immunol Immunopathol. 1991;61:202–11.
30. Bozza VV, D'Attilio L, Mahuad CV, Giri AA, Del Rey A, Besedovsky H, et al. Altered cortisol/DHEA ratio in tuberculosis patients and its relationship with abnormalities in the mycobacterial-driven cytokine production by peripheral blood mononuclear cells. Scand J Immunol. 2007;66:97–103.
31. Radford DJ, Wang K, McNelis JC, Taylor AE, Hechenberger G, Hofmann J, et al. Dehydroepiandrosterone sulfate directly activates protein kinase C-beta to increase human neutrophil superoxide generation. Mol Endocrinol. 2010;24:813–21.
32. Monahan LG, Hajduk IV, Blaber SP, Charles IG, Harry EJ. Coordinating bacterial cell division with nutrient availability: a role for glycolysis. MBio. 2014;5:e00935–14.
33. Javed A, Guirgis FW, Sterling SA, Puskarich MA, Bowman J, Robinson T, et al. Clinical predictors of early death from sepsis. J Crit Care. 2017;42:30–4. 34. Shapiro NI, Howell MD, Talmor D, Nathanson LA, Lisbon A, Wolfe RE, et al.
Serum lactate as a predictor of mortality in emergency department patients with infection. Ann Emerg Med. 2005;45:524–8.
35. Mikkelsen ME, Miltiades AN, Gaieski DF, Goyal M, Fuchs BD, Shah CV, et al. Serum lactate is associated with mortality in severe sepsis independent of organ failure and shock. Crit Care Med. 2009;37:1670–7.
![2 [5 (4 Fluorophenyl) 3 (4 methylphenyl) 4,5 dihydro 1H pyrazol 1 yl] 4 phenyl 1,3 thiazole](data:image/gif;base64,R0lGODlhAQABAIAAAP///wAAACH5BAEAAAAALAAAAAABAAEAAAICRAEAOw==)