R E S E A R C H
Open Access
Worldwide audit of blood transfusion
practice in critically ill patients
Jean-Louis Vincent
1*, Ulrich Jaschinski
2, Xavier Wittebole
3, Jean-Yves Lefrant
4, Stephan M. Jakob
5,
Ghaleb A. Almekhlafi
6, Tommaso Pellis
7, Swagata Tripathy
8, Paolo N. Rubatto Birri
9,
and Yasser Sakr
9on behalf of the ICON Investigators
Abstract
Background:The aim was to describe transfusion practice in critically ill patients at an international level and evaluate the effects of red blood cell (RBC) transfusion on outcomes in these patients.
Methods:This was a pre-planned sub-study of the Intensive Care Over Nations audit, which involved 730 ICUs in 84 countries and included all adult patients admitted between 8 May and 18 May 2012, except admissions for routine postoperative surveillance.
Results:ICU and hospital outcomes were recorded. Among the 10,069 patients included in the audit, data related to transfusion had been completed for 9553 (mean age 60 ± 18 years, 60% male); 2511 (26.3%) of these had received a transfusion, with considerable variation among geographic regions. The mean lowest hemoglobin on the day of transfusion was 8.3 ± 1.7 g/dL, but varied from 7.8 ± 1.4 g/dL in the Middle East to 8.9 ± 1.9 g/dL in Eastern Europe. Hospital mortality rates were higher in transfused than in non-transfused patients (30.0% vs. 19.6%,p< 0.001) and increased with increasing numbers of transfused units. In an extended Cox proportional hazard analysis, the relative risk of in-hospital death was slightly lower after transfusion in the whole cohort (hazard ratio 0.98, confidence interval 0.96–1.00,p= 0.048). There was a stepwise decrease in the hazard ratio for mortality after transfusion with increasing admission severity scores.
Conclusions:More than one fourth of critically ill patients are transfused during their ICU stay, with considerable variations in transfusion practice among geographic regions. After adjustment for confounders, RBC transfusions were associated with a slightly lower relative risk of in-hospital death, especially in the most severely ill patients, highlighting the importance of taking the severity of illness into account when making transfusion decisions.
Keywords:Red blood cell, Worldwide, Severity of illness
Background
Red blood cell (RBC) transfusions are frequently admin-istered in critically ill patients [1, 2], although probably less so in recent years than in the past. RBC transfusion may have beneficial effects by increasing oxygen delivery to the tissues and improving the oxygen demand/supply balance [3], but may also have some harmful effects. In addition to possible type and cross-matching issues, transfusions may be associated with transfusion-related acute lung injury (TRALI), transfusion-associated
circulatory overload (TACO) and immunomodulating effects resulting in a higher incidence of nosocomial infections [4].
Prospective, randomized, controlled trials (RCTs) have suggested that restrictive RBC transfusion strategies are safe, but this may apply more to patients who are less se-verely ill. Indeed, recent meta-analyses have suggested caution in patients with cardiovascular disease [5], and that restrictive strategies should be applied with particular care in high-risk patients undergoing major surgery [6]. The uncertainty concerning the risk/benefit profile of RBC transfusion in critically ill patients has fueled ongoing debate on the subject over the last two decades. Moreover, the heterogeneity of critical illness and the absence of
* Correspondence:jlvincent@intensive.org
1Department of Intensive Care, Erasme University Hospital, Unversité Libre de
Bruxelles, Route de Lennik 808, 1070 Brussels, Belgium
Full list of author information is available at the end of the article
universally accepted guidelines may influence RBC transfusion practice in intensive care units (ICUs) world-wide. Several regional observational studies [1, 7] have reported on patterns of RBC transfusion in ICU patients, but global differences in transfusion practice have not been addressed. Such data would be useful from an epidemiological point of view, and also to improve our understanding of the factors that may influence transfu-sion practice.
We used the worldwide Intensive Care Over Nations (ICON) database, to investigate current transfusion practices worldwide and the possible effect of transfu-sion on outcomes.
Methods
This was a planned post-hoc analysis of the ICON data-base. ICON was a multicenter, worldwide audit endorsed by the World Federation of Societies of Intensive Care and Critical Care Medicine (WFSICCM). Institutional recruitment for participation was by open invitation and was voluntary, with no financial incentive. Institutional review board approval was obtained by the participating institutions according to local ethical regulations. Informed consent was not required due to the observa-tional and anonymous nature of data collection in this audit. The ICON audit collected data on 10,069 adult (> 16 years of age) patients admitted to the participating centers (Additional file 1) between 8 May and 18 May 2012. The 9553 patients for whom data related to transfusion had been completed were included in the present analysis.
Data collection and management
Details about the conduct of the audit, the data collected and the definitions used are provided elsewhere [8]. Data were collected prospectively using preprinted case report forms (CRFs) and were electronically introduced by the investigators using an Internet-based website. Data collec-tion on admission included demographic data and data on comorbid diseases (chronic obstructive pulmonary disease (COPD), cancer, metastatic cancer, hematologic cancer, insulin-dependent diabetes mellitus, heart failure (New York Heart Association (NYHA) class III-IV), chronic renal failure, human immunodeficiency virus (HIV) infection, cirrhosis, immunosuppression, steroid therapy or chemotherapy). Clinical data and laboratory data were collected daily for a maximum of 28 days in the ICU, and included respiratory, hemodynamic and hematological parameters, and fluid administration. For the purposes of this study, the minimum hemoglobin concentration reported on the day of the transfusion was considered as the “transfusion trigger”. ICU and hospital length of stay and outcomes were recorded. Clinical and laboratory data for the Simplified Acute Physiology Score (SAPS) II [9]
were reported as the worst value within 24 h after admis-sion. A daily evaluation of organ function according to the sequential organ failure assessment (SOFA) score [10] was performed and organ failure was defined as a SOFA score >2 for the organ in question. Surgical admissions were identified as patients who had had surgery in the 4 weeks preceding admission.
Data were processed and analyzed in the Department of Intensive Care of the University of Brussels. The study coordinators processed all queries during data collection. Detailed instructions, explaining the aim of the study, instructions for data collection, and definitions for various items were available through a secured website for all participants. Validity checks were made concur-rent with data entry by the electronic case record form, including plausibility checks within each variable and between variables. Data were further reviewed by the coordinating center for plausibility and availability of the outcome parameter, and doubts were clarified with the corresponding ICU. We did not perform any other sup-plementary quality control measures.
Subgroup analyses
Subgroups defined a priori included male versus female patients, medical versus surgical patients, sepsis versus no sepsis, and subgroups according to quartiles of SAPS II and SOFA scores on admission to the ICU and age categories (18–50, 51–65, 66–75 or > 75 years).
Statistical analysis
Data are summarized using means with standard deviation (SD), medians and interquartile ranges (IQ) or numbers and percentages. For the purposes of this study, hemoglobin concentrations were categorized according to cutoff values of < 7, 7–8.9, 9–10.9, 11–13, and > 13 g/dL. Differences between groups were tested using analysis of variance (ANOVA), the Kruskal-Wallis test, Student’s t test, the Mann-Whitney test, the chi-square test or Fisher’s exact test as appropriate.
coverage. The geographic region (North America, South America, Western Europe, Eastern Europe, Middle East, South Asia, East and South-East Asia, Oceania and Africa) was considered in these multivariable models. An extended Cox model was constructed, adding interaction terms that involve time, i.e., time-varying fixed effects, computed as the by-product of time and individual covariates in the model (time × covariate). Individual time-varying fixed covariates were introduced one by one and in combinations in the ex-tended model, none of which was found to be significant (Wald chi-square statistics). Colinearity between variables was checked before modeling and all variables were in-cluded in the models thereafter, irrespective of the level of significance on univariate basis. Transfusion during the ICU stay was introduced into the model as a time-dependent variable using the time to the first erythrocyte unit given.
Data were analyzed using IBM® SPSS® Statistics soft-ware, version 22 for windows. All reported pvalues are two-sided. A pvalue of less than 0.05 was considered to indicate statistical significance.
Results
Characteristics of the study group
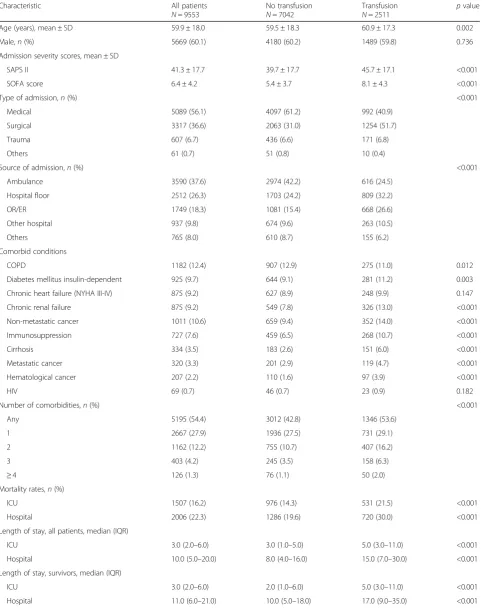
The characteristics of the 9553 patients (mean age 60 ± 18 years, 60% male) on ICU admission are shown in Table1; 56% were medical admissions. Median ICU and hospital lengths of stay were 3 (2-6) and 10 (5-20) days, respectively, and the overall ICU and hospital mortality rates were 16.2% and 22.3%, respectively. Patient charac-teristics and outcomes varied among geographic regions (Additional file2: Table S1).
Global patterns of anemia and its relationship with outcome
The mean lowest hemoglobin concentration on the day of ICU admission was 10.7 ± 2.4 g/dL; 26.4% of patients had a hemoglobin concentration < 9 g/dL on admission and 44.1% of patients had a hemoglobin concentration < 9 g/dL dur-ing the ICU stay. Hemoglobin concentrations were lower during the first 2 weeks following ICU admission in pa-tients who received a transfusion than in those who did not (Additional file2: Figure S1). In patients who did not receive a transfusion at any time during the ICU stay, hemoglobin concentrations decreased steadily after admis-sion to the ICU (Additional file2: Figure S1).
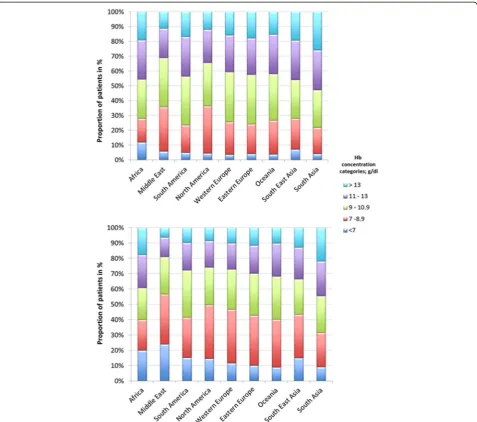
Hemoglobin concentrations varied considerably in the different geographic regions (Fig. 1). On the day of ICU admission, mean hemoglobin concentrations varied from 10.1 ± 2.3 g/dL in the Middle East to 11.3 ± 2.5 g/dL in South Asia. The proportion of patients with severe anemia (hemoglobin concentration < 7 g/dL) on admission to the ICU ranged from 3.5% (Western Europe) to 12.0% (Africa). The overall prevalence of anemia (hemoglobin
concentration < 9 g/dL) at any time during the ICU stay ranged from 31.5% (South Asia) to 56.6% (Middle East).
There was an inverse relationship between the lowest hemoglobin concentration on the day of ICU admission and during the ICU stay and ICU and hospital mortality rates and the degree of organ dysfunction/failure as assessed by the SOFA score during the ICU stay (Additional file 2: Table S2, Figure S2). Patients with a lowest hemoglobin concentration of < 7 g/dL had an almost twofold higher mortality rate than those with a lowest hemoglobin concentration of > 13 g/dL on the day of ICU admission (Additional file2: Figure S2) or at any time during the ICU stay. However, differences in mortality rates for hemoglobin concentrations between 7 and 13 g/dL were less marked.
Transfusion practice
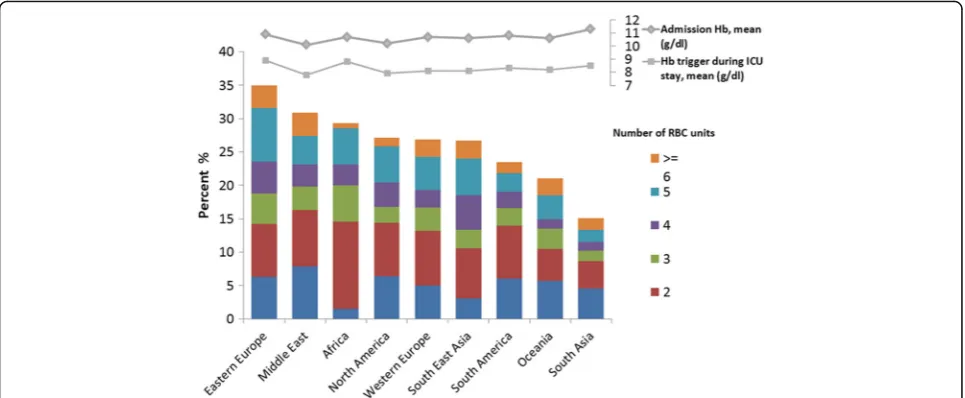
A total of 2511 (26.3%) patients received a RBC transfu-sion during the ICU stay; 1192 (12.5%) patients received a transfusion on the day of ICU admission. The propor-tion of patients who received a transfusion varied con-siderably among the different geographic regions, from 7.1% in South Asia to 19.4% in Eastern Europe on the day of ICU admission, and from 15% in South Asia to 34.9% in Eastern Europe during the ICU stay (Fig. 2; Additional file2: Table S1).
There were 62% of patients with hemoglobin levels < 7 g/dL who received a RBC transfusion dur-ing the ICU stay, whereas only 3.7% of patients with hemoglobin concentrations >13 g/dL received a transfusion (Additional file 2: Table S3). The proportion of patients who received a transfusion during the ICU stay increased with increasing ICU length of stay (Additional file 1: Table S4). Patients who received a transfusion at any time during the ICU stay had higher SAPS II and SOFA scores on admission to the ICU than those who did not (Table1). The median number of units transfused was 3 (IQ 2–5).
Table 1Clinical characteristics and outcomes of the study cohort according to whether or not they received a transfusion during their ICU stay
Characteristic All patients
N= 9553
No transfusion
N= 7042
Transfusion
N= 2511
pvalue
Age (years), mean ± SD 59.9 ± 18.0 59.5 ± 18.3 60.9 ± 17.3 0.002
Male,n(%) 5669 (60.1) 4180 (60.2) 1489 (59.8) 0.736
Admission severity scores, mean ± SD
SAPS II 41.3 ± 17.7 39.7 ± 17.7 45.7 ± 17.1 <0.001
SOFA score 6.4 ± 4.2 5.4 ± 3.7 8.1 ± 4.3 <0.001
Type of admission,n(%) <0.001
Medical 5089 (56.1) 4097 (61.2) 992 (40.9)
Surgical 3317 (36.6) 2063 (31.0) 1254 (51.7)
Trauma 607 (6.7) 436 (6.6) 171 (6.8)
Others 61 (0.7) 51 (0.8) 10 (0.4)
Source of admission,n(%) <0.001
Ambulance 3590 (37.6) 2974 (42.2) 616 (24.5)
Hospital floor 2512 (26.3) 1703 (24.2) 809 (32.2)
OR/ER 1749 (18.3) 1081 (15.4) 668 (26.6)
Other hospital 937 (9.8) 674 (9.6) 263 (10.5)
Others 765 (8.0) 610 (8.7) 155 (6.2)
Comorbid conditions
COPD 1182 (12.4) 907 (12.9) 275 (11.0) 0.012
Diabetes mellitus insulin-dependent 925 (9.7) 644 (9.1) 281 (11.2) 0.003
Chronic heart failure (NYHA III-IV) 875 (9.2) 627 (8.9) 248 (9.9) 0.147
Chronic renal failure 875 (9.2) 549 (7.8) 326 (13.0) <0.001
Non-metastatic cancer 1011 (10.6) 659 (9.4) 352 (14.0) <0.001
Immunosuppression 727 (7.6) 459 (6.5) 268 (10.7) <0.001
Cirrhosis 334 (3.5) 183 (2.6) 151 (6.0) <0.001
Metastatic cancer 320 (3.3) 201 (2.9) 119 (4.7) <0.001
Hematological cancer 207 (2.2) 110 (1.6) 97 (3.9) <0.001
HIV 69 (0.7) 46 (0.7) 23 (0.9) 0.182
Number of comorbidities,n(%) <0.001
Any 5195 (54.4) 3012 (42.8) 1346 (53.6)
1 2667 (27.9) 1936 (27.5) 731 (29.1)
2 1162 (12.2) 755 (10.7) 407 (16.2)
3 403 (4.2) 245 (3.5) 158 (6.3)
≥4 126 (1.3) 76 (1.1) 50 (2.0)
Mortality rates,n(%)
ICU 1507 (16.2) 976 (14.3) 531 (21.5) <0.001
Hospital 2006 (22.3) 1286 (19.6) 720 (30.0) <0.001
Length of stay, all patients, median (IQR)
ICU 3.0 (2.0–6.0) 3.0 (1.0–5.0) 5.0 (3.0–11.0) <0.001
Hospital 10.0 (5.0–20.0) 8.0 (4.0–16.0) 15.0 (7.0–30.0) <0.001
Length of stay, survivors, median (IQR)
ICU 3.0 (2.0–6.0) 2.0 (1.0–6.0) 5.0 (3.0–11.0) <0.001
Outcomes according to RBC transfusion status
ICU and hospital mortality rates were higher in patients who received a transfusion during the ICU stay than in those who did not (21.5% vs. 14.3% and 30.0% vs. 19.6%, both p< 0.001) (Table 1). Mortality rates increased
[image:5.595.55.538.110.173.2]with increasing numbers of transfused RBC units (Additional file2: Table S5). In the multivariable Cox analysis in the whole cohort, the relative risk of in-hospital death was slightly lower after transfusion (hazard ratio 0.98, confidence interval 0.96–1.00,p= 0.048) (Additional file2: Table S6). Table 1Clinical characteristics and outcomes of the study cohort according to whether or not they received a transfusion during their ICU stay(Continued)
Characteristic All patients
N= 9553
No transfusion
N= 7042
Transfusion
N= 2511
pvalue
Length of stay, non-survivors, median (IQR)
ICU 3.0 (1.0–8.0) 2.0 (1.0–6.0) 7.0 (2.5–15.0) <0.001
Hospital 5.0 (2.0–13.0) 4.0 (1.0–9.0) 9.5 (3.0–20.5) <0.001
Missing values: age, sex, and type of admission in 50, 114 and 479 patients, respectively; percentages were calculated taking into account missing values
COPDchronic obstructive pulmonary disease, HIVhuman immunodeficiency viral infection,ICUintensive care unit,NYHANew York Heart Association Classification,SAPSsimplified acute physiology score,SOFAsequential organ assessment,SDstandard deviation,ERemergency room,ORoperating room
[image:5.595.60.538.289.711.2]Subgroup analysis
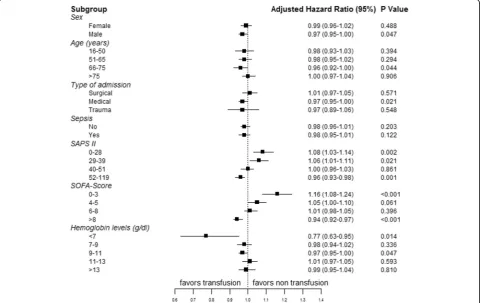
The adjusted hazard ratios of in-hospital mortality among the pre-defined sub-groups are shown in Fig. 3. Transfu-sion was associated with a lower hazard of death in med-ical patients, in patients with a hemoglobin level < 7 g/dL, and in patients with higher SAPS II (52–119) and SOFA scores (>8) on ICU admission. There was a stepwise de-crease in hazard ratio for mortality with transfusion ac-cording to increasing admission severity scores (Fig.3).
Discussion
The present study provides interesting information about the epidemiology and impact of RBC transfusions in ICUs around the globe. Despite the fact that the degree of anemia in our study was comparable to that reported in previous observational studies [1], the proportion of pa-tients who received a RBC transfusion (26%) is lower than that reported in older studies: for example, 37% in the European ABC study [1] and 44% in the North American CRIT study [7], which were comparable studies conducted about 15 years ago, and 33% in the European SOAP study conducted a few years later [2]. The transfusion triggers in our study were slightly lower in patients admitted to ICUs from Western Europe (8.1 g/dL) and North America (7.9 g/dL) than those reported in the older ABC (8.4 g/dL) and CRIT (8.6 g/dL) studies.
We observed considerable variation in transfusion practice among geographic regions, and marked differ-ences in pre-transfusion hemoglobin concentrations according to age, type of admission, the presence of sepsis, severity scores and ICU length of stay. There are surprisingly few data on ICU transfusion practice in areas of the world other than Europe, Oceania and North America.
As expected, transfusions were associated with higher severity scores, longer lengths of stay and higher mortal-ity rates. The important finding was that in multivariable analysis, RBC transfusion was associated with greater benefit in sicker patients and with worse outcomes in patients with lower severity scores. In the study by Hebert et al. [11], mortality rates were also higher in the liberal-strategy group than in the restrictive-strategy group in patients with lower Acute Physiology and Chronic Health Evaluation (APACHE) II scores.
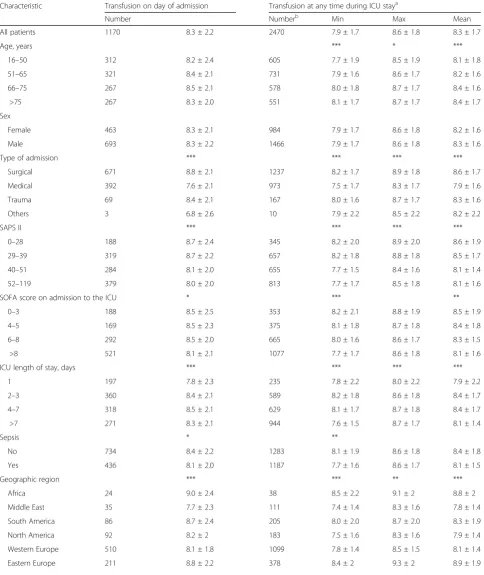
[image:6.595.57.540.88.287.2]Table 2Characteristics of patients according to the lowest hemoglobin concentration on the day of transfusion
Lowest hemoglobin concentration on day of transfusion, mean ± SD
Characteristic Transfusion on day of admission Transfusion at any time during ICU staya
Number Numberb Min Max Mean
All patients 1170 8.3 ± 2.2 2470 7.9 ± 1.7 8.6 ± 1.8 8.3 ± 1.7
Age, years *** * ***
16–50 312 8.2 ± 2.4 605 7.7 ± 1.9 8.5 ± 1.9 8.1 ± 1.8
51–65 321 8.4 ± 2.1 731 7.9 ± 1.6 8.6 ± 1.7 8.2 ± 1.6
66–75 267 8.5 ± 2.1 578 8.0 ± 1.8 8.7 ± 1.7 8.4 ± 1.6
>75 267 8.3 ± 2.0 551 8.1 ± 1.7 8.7 ± 1.7 8.4 ± 1.7
Sex
Female 463 8.3 ± 2.1 984 7.9 ± 1.7 8.6 ± 1.8 8.2 ± 1.6
Male 693 8.3 ± 2.2 1466 7.9 ± 1.7 8.6 ± 1.8 8.3 ± 1.6
Type of admission *** *** *** ***
Surgical 671 8.8 ± 2.1 1237 8.2 ± 1.7 8.9 ± 1.8 8.6 ± 1.7
Medical 392 7.6 ± 2.1 973 7.5 ± 1.7 8.3 ± 1.7 7.9 ± 1.6
Trauma 69 8.4 ± 2.1 167 8.0 ± 1.6 8.7 ± 1.7 8.3 ± 1.6
Others 3 6.8 ± 2.6 10 7.9 ± 2.2 8.5 ± 2.2 8.2 ± 2.2
SAPS II *** *** *** ***
0–28 188 8.7 ± 2.4 345 8.2 ± 2.0 8.9 ± 2.0 8.6 ± 1.9
29–39 319 8.7 ± 2.2 657 8.2 ± 1.8 8.8 ± 1.8 8.5 ± 1.7
40–51 284 8.1 ± 2.0 655 7.7 ± 1.5 8.4 ± 1.6 8.1 ± 1.4
52–119 379 8.0 ± 2.0 813 7.7 ± 1.7 8.5 ± 1.8 8.1 ± 1.6
SOFA score on admission to the ICU * *** **
0–3 188 8.5 ± 2.5 353 8.2 ± 2.1 8.8 ± 1.9 8.5 ± 1.9
4–5 169 8.5 ± 2.3 375 8.1 ± 1.8 8.7 ± 1.8 8.4 ± 1.8
6–8 292 8.5 ± 2.0 665 8.0 ± 1.6 8.6 ± 1.7 8.3 ± 1.5
>8 521 8.1 ± 2.1 1077 7.7 ± 1.7 8.6 ± 1.8 8.1 ± 1.6
ICU length of stay, days *** *** *** ***
1 197 7.8 ± 2.3 235 7.8 ± 2.2 8.0 ± 2.2 7.9 ± 2.2
2–3 360 8.4 ± 2.1 589 8.2 ± 1.8 8.6 ± 1.8 8.4 ± 1.7
4–7 318 8.5 ± 2.1 629 8.1 ± 1.7 8.7 ± 1.8 8.4 ± 1.7
>7 271 8.3 ± 2.1 944 7.6 ± 1.5 8.7 ± 1.7 8.1 ± 1.4
Sepsis * **
No 734 8.4 ± 2.2 1283 8.1 ± 1.9 8.6 ± 1.8 8.4 ± 1.8
Yes 436 8.1 ± 2.0 1187 7.7 ± 1.6 8.6 ± 1.7 8.1 ± 1.5
Geographic region *** *** ** ***
Africa 24 9.0 ± 2.4 38 8.5 ± 2.2 9.1 ± 2 8.8 ± 2
Middle East 35 7.7 ± 2.3 111 7.4 ± 1.4 8.3 ± 1.6 7.8 ± 1.4
South America 86 8.7 ± 2.4 205 8.0 ± 2.0 8.7 ± 2.0 8.3 ± 1.9
North America 92 8.2 ± 2 183 7.5 ± 1.6 8.3 ± 1.6 7.9 ± 1.4
Western Europe 510 8.1 ± 1.8 1099 7.8 ± 1.4 8.5 ± 1.5 8.1 ± 1.4
observational study, we cannot control for unmeasured confounding as can RCTs, and can therefore only demonstrate an association and not prove causality; our findings can therefore only be considered as hypothesis-generating. Nevertheless, unlike RCTs in which only a fraction of potentially eligible patients are included, observational studies include all patients thus providing data that are more pragmatic and generalizable to the whole ICU population. Third, although transfusion was associated with a lower hazard of mortality in sicker pa-tients, we are unable to comment on optimum thresh-olds or targets of transfusion. Fourth, we lack information on complications associated with transfusions, such as
TRALI, TACO, transfusion reactions and development of nosocomial infections. We also have no information on whether or not transfused units were leukocyte-depleted.
Conclusions
Despite the limitations mentioned, this large worldwide study of patients admitted to the ICU shows clear differ-ences in transfusion practice in different geographic re-gions. Our results also suggest that RBC transfusion may be associated with better outcomes in the most severely ill patients, highlighting the importance of taking sever-ity of illness into account when deciding on the need for transfusion in an individual patient.
[image:8.595.58.538.99.180.2]Fig. 3Forest plot was created from modelling of our observational data showing the risk of in-hospital death after transfusion in the various subgroups of patients. SAPS, Simplified Acute Physiology Score; SOFA, Sequential Organ Failure Assessment (on admission)
Table 2Characteristics of patients according to the lowest hemoglobin concentration on the day of transfusion(Continued)
Lowest hemoglobin concentration on day of transfusion, mean ± SD
Characteristic Transfusion on day of admission Transfusion at any time during ICU staya
Number Numberb Min Max Mean
Oceania 39 8.5 ± 1.9 91 7.9 ± 1.5 8.5 ± 1.5 8.2 ± 1.4
South East Asia 110 8.0 ± 2.4 232 7.7 ± 1.9 8.5 ± 1.9 8.1 ± 1.8
South Asia 63 8.8 ± 3.2 133 8.1 ± 2.5 8.9 ± 2.4 8.5 ± 2.3
Hbhemoglobin,SOFASequential Organ Failure Assessment,SAPS IISimplified Acute Physiology Score II,ICUintensive care unit,IQinterquartile
a
Some patients were transfused several times hence, minimum (Min), maximum (Max) and mean values are given
b
[image:8.595.58.542.401.704.2]Additional files
Additional file 1:Alphabetical list of participating centers in the
Intensive Care Over Nations (ICON) audit, by country. (PDF 162 kb)
Additional file 2:Tables S1-S6andFigures S1-S3. (PDF 459 kb)
Abbreviations
COPD:Chronic obstructive pulmonary disease; Hb: Hemoglobin;
ICON: Intensive Care Over Nations; ICU: Intensive care unit; NYHA: New York Heart Association; RBC: Red blood cell; RCT: Randomized controlled trial; SAPS: Simplified Acute Physiology Score; SOFA: Sequential Organ Failure Assessment; TACO: Transfusion-associated circulatory overload; TRALI: Transfusion-related acute lung injury
Acknowledgements
We would like to thank Hassane Njimi PhD for his help with the statistical analyses.
Authors’contributions
JLV and YS designed the study; JLV, UJ, XW, SMJ, JYL, GAA, TP, ST and YS participated in acquisition of data for the original ICON study; JLV, PNRB, and YS analyzed the data for the current sub-study and drafted the article; XW, UJ, SMJ, JYL, GAA, ST and TP revised the article for critical content. All authors read and approved the final manuscript.
Ethics approval and consent to participate
Institutional review board approval for ICON was obtained by the participating institutions according to local ethical regulations.
Competing interests
JLV is Editor-in-Chief of Critical Care. The other authors have no conflicts of interest to declare related to this article.
Publisher’s Note
Springer Nature remains neutral with regard to jurisdictional claims in published maps and institutional affiliations.
Author details
1Department of Intensive Care, Erasme University Hospital, Unversité Libre de
Bruxelles, Route de Lennik 808, 1070 Brussels, Belgium.2Klinik für
Anästhesiologie und operative Intensivmedizin, Klinikum Augsburg, Augsburg, Germany.3Critical Care Department, Cliniques universitaires St
Luc, UCL, Brussels, Belgium.4Service des Réanimations, Division Anesthésie
Réanimation Douleur Urgence, CHU Nîmes, Nîmes, France.5Department of
Intensive Care Medicine, University Hospital Bern, University of Bern, Bern, Switzerland.6ICS Department, Prince Sultan Military Medical City, Riyadh,
Saudi Arabia.7Anesthesia and Intensive Care, Santa Maria degli Angeli
Hospital, Pordenone, Italy.8Department of Anesthesia, AIIMS, Sijua, Patrapada,
Bhubaneswar, Odisha, India.9Department of Anesthesiology and Intensive Care, Universitätsklinikum Jena, Jena, Germany.
Received: 4 January 2018 Accepted: 23 March 2018
References
1. Vincent JL, Baron JF, Reinhart K, Gattinoni L, Thijs L, Webb A, et al. Anemia and blood transfusion in critically ill patients. JAMA. 2002;288:1499–507. 2. Vincent JL, Sakr Y, Sprung C, Harboe S, Damas P. Are blood transfusions
associated with greater mortality rates? Results of the Sepsis Occurrence in Acutely Ill Patients study. Anesthesiology. 2008;108:31–9.
3. Sakr Y, Vincent JL. Should red cell transfusion be individualized? Yes. Intensive Care Med. 2015;41:1973–6.
4. Rohde JM, Dimcheff DE, Blumberg N, Saint S, Langa KM, Kuhn L, et al. Health care-associated infection after red blood cell transfusion: a systematic review and meta-analysis. JAMA. 2014;311:1317–26. 5. Docherty AB, O'Donnell R, Brunskill S, Trivella M, Doree C, Holst L, et al.
Effect of restrictive versus liberal transfusion strategies on outcomes in patients with cardiovascular disease in a non-cardiac surgery setting: systematic review and meta-analysis. BMJ. 2016;352:i1351.
6. Hovaguimian F, Myles PS. Restrictive versus liberal transfusion strategy in the perioperative and acute care settings: a context-specific systematic review and meta-analysis of randomized controlled trials. Anesthesiology. 2016;125:46–61. 7. Corwin HL, Gettinger A, Pearl RG, Fink MP, Levy MM, Abraham E, et al. The
CRIT study: anemia and blood transfusion in the critically ill–current clinical practice in the United States. Crit Care Med. 2004;32:39–52.
8. Vincent JL, Marshall JC, Namendys-Silva SA, François B, Martin-Loeches I, Lipman J, et al. Assessment of the worldwide burden of critical illness: The Intensive Care Over Nations (ICON) audit. Lancet Respir Med. 2014;2:380–6. 9. Le Gall JR, Lemeshow S, Saulnier F. A new Simplified Acute Physiology
Score (SAPS II) based on a European/North American multicenter study. JAMA. 1993;270:2957–63.
10. Vincent JL, Moreno R, Takala J, Willatts S, de Mendonça A, Bruining H, et al. The SOFA (Sepsis-related Organ Failure Assessment) score to describe organ dysfunction/failure. Intensive Care Med. 1996;22:707–10.
11. Hebert PC, Wells G, Blajchman MA, Marshall J, Martin C, Pagliarello G, et al. A multicenter, randomized, controlled clinical trial of transfusion requirements in critical care. Transfusion Requirements in Critical Care Investigators, Canadian Critical Care Trials Group. N Engl J Med. 1999;340:409–17.
• We accept pre-submission inquiries
• Our selector tool helps you to find the most relevant journal • We provide round the clock customer support
• Convenient online submission • Thorough peer review
• Inclusion in PubMed and all major indexing services • Maximum visibility for your research
Submit your manuscript at www.biomedcentral.com/submit