R E S E A R C H
Open Access
Population genetic structure and temporal
stability among
Trypanosoma brucei
rhodesiense
isolates in Uganda
Charles D. Kato
1, Vincent P. Alibu
2, Ann Nanteza
1, Claire M. Mugasa
1and Enock Matovu
1*Abstract
Background:The population structure and role of genetic exchange in African trypanosomes have been previously analyzed albeit with contradictory findings. To further investigate the role of genetic polymorphism on the population genetic structure ofTrypanosoma b. rhodesiense, we hypothesized that parasite genotypes are clonal and stable over time. Methods:We have undertaken a microsatellite marker analysis ofT. b. rhodesienseisolates in a relatively new active HAT focus in Uganda (Kaberamaido-Dokolo-Amolatar) over a six-year period (2006–2012). We amplified six microsatellite markers by PCR directly from blood spotted FTA cards following whole genome amplification.
Results:The majority of loci demonstrated an excess of heterozygosity (Ho > He, FIS< 0). We identified 26 unique genotypes among the 57 isolates, accounting for 45.6 % genotypic polymorphism. The presence of a high proportion of samples with repeated genotypes (54.4 %, 31/57), disagreement with Hardy-Weinberg equilibrium, and significant linkage disequilibrium between loci pairs, provide evidence thatT. b. rhodesienseisolates from this focus are clonal. Our results show low values of FST’ (0–0.115) indicating negligible genetic differentiation across temporal isolates.
Furthermore, predominant genotypes isolated in 2006 were still detectable in 2012.
Conclusions:Our findings confirm the notion that endemicity is maintained by stable genotypes rather than an influx of new genotypes. Our results have considerable importance in understanding and tracking the spread of sleeping sickness with significant implication to disease control.
Keywords:Human African trypanosomiasis, Sleeping sickness, Microsatellite, Uganda
Background
African trypanosomes constitute a large number of gen-era and species infecting a wide range of different hosts. Trypanosoma brucei comprises three morphologically indistinguishable subspecies, T. b. gambiense and T. b. rhodesiense are infective to humans whileT. b. bruceiis only infective to domestic animals and game [1]. To date, the population genetics of T. bruceiremains a de-batable topic. However, with increasing availability ofT. brucei genomic sequence information, the biology and epidemiology of sleeping sickness is becoming less complex [2–4]. Currently, three opposing population structures basing on the extent of sexual recombination
are proposed. Tibayrenc et al. [5] proposed a clonal structure with limited sexual recombination while Tait [6] proposed a panmictic population structure with fre-quent sexual recombination. On the other hand, Hide et al. [7] proposed an epidemic structure in which genetic exchange is masked by clonal expansion of a few geno-types. Laboratory based studies to confirm these sugges-tions have demonstrated existence of sexual reproduction amongT. bruceistocks [8–12].
In order to determine if mating occurred among T. brucei isolates in east Africa, Hide et al. [7] analyzedT. b. rhodesiense isolates from Uganda using multi-locus enzyme electrophoresis and reported an epidemic popu-lation structure. When [13] analyzed T. b. rhodesiense stocks from the same locality using minisatellite markers, a clonal population structure was reported. However, it is argued that these inconsistencies might be * Correspondence:[email protected];[email protected]
1School of Bio-security, Biotechnical & Laboratory Sciences, College of Veterinary Medicine, Animal Resources & Bio-security, Makerere University, P.O Box 7062, Kampala, Uganda
Full list of author information is available at the end of the article
due to the flaws in the study design, marker selection and variations in genetic data interpretation [2]. To address the issue of marker selection, microsatellite markers have been proposed as useful tools in genetic and evolutionary studies [14, 15]. In West Africa, micro-satellite analysis of T. b. gambiense populations was in support of a clonal structure [16–18]. However, in an-other study using T. b. gambiense stocks from central Africa, the authors could not entirely rule out sexual re-combination in one sub-population [18]. In a study com-paring two geographically isolated foci using microsatellite marker analysis, T. b. rhodesiense stocks in Uganda ap-peared clonal while sexual recombination was frequent among Malawi isolates [19]. However, when the authors compared T. b. rhodesiense isolates from Uganda over a 36-year period, temporal stability was not evident showing that strict clonality was not evident. These findings were inconsistent with previous T. b. rhodesiense studies in Uganda [13] and in Tanzania [20] in which temporal sta-bility was evident. Furthermore, when isolates from two closely related foci (Tororo and Soroti) in Uganda were compared, no evidence of genetic sub-structuring was observed [19]. Contrary to this, another study compar-ing isolates from the same two foci found significant clustering, clearly demonstrating that distinct parasites were involved [21].
To try and address these inconsistences, we undertook a microsatellite marker analysis ofT. b. rhodesiense iso-lates in a relatively new active HAT focus in Uganda (Kaberamaido-Dokolo-Amolatar) over a six-year period (2006–2012). A sizeable number of HAT cases started to emerge in this area around 2004 and by 2006, cases had risen to epidemic levels (twice the number of cases re-ported in a similar period in the past). These data pro-vide a unique opportunity to test the hypothesis thatT. b. rhodesiense isolates in a single focus are clonal and stable over time to maintain endemicity.
Methods Ethical statement
Ethical review of this retrospective study was by the In-stitutional Review Board of the Vector Control Division, Ministry of Health; final approval was provided by the Uganda National Council for Science and Technology. For purposes of this study all data were anonymized prior to analysis.
Study area and study samples
For the purpose of this study, we retrieved previously collected (years 2006–2012) and archived blood-spotted FTA cards (Whatman) from the trypanosome data bank at Makerere University. All samples were collected at Lwala hospital, a sleeping sickness referral center in Northern Uganda (Kaberamaido District). All samples
were checked forT. b. rhodesienseconfirmation by amp-lification of a serum-resistance associated gene as de-scribed previously [22].
FTA card preparations and whole genome amplification
Whole genome amplification (WGA) was performed using the Ready-To-Go Genomiphi V3 DNA amplifica-tion kit (GE Healthcare, Sweden) following the manufac-turer’s instructions. FTA card preparation was done as previously described [23]. Briefly, from the FTA paper, 2 mm diameter discs were punched using Harris micro-punch (Whatman, Sweden). Discs were washed three times with 500μl FTA purification reagent (GE Health-care, Sweden) and twice for 5 min with TE buffer (10 mM Tris-HCl pH 8.0, 0.1 mM EDTA). After the last wash, 20μl of cell lysis solution (400 mM KOH, 10 mM EDTA, 100 mM DTT) were added and mixture incu-bated on ice for 10 min. Twenty microliters of neutralization buffer (400 mM HCL, 600 mM Tris-HCl pH 7.5) and 20 μl PCR-grade water were added to the cell lysate followed by 10 μl 2× denaturation buffer (20 mM Hepes pH 8.25, 1.0 mM EDTA, 0.02 % Tween-20, 150 mM KCl). For WGA, 20μl of the denatured cell lysate DNA was added to the Genomiphi V3 cake and samples incubated at 30 °C for 2 h followed by heating at 65 °C for 10 min with subsequent cooling at 4 °C. Three independent WGA reactions from the same sam-ple were pooled and stored at -20 °C.
Polymerase chain reaction (PCR)-based genotyping
Genotyping was done using six microsatellite loci previ-ously shown to be polymorphic; Ch1/18, Ch2/5, Ch2/ PLC, Ch3/5 L5, Ch5/JS2 [10, 17, 19, 21] and M6C8 [24, 25]. Microsatellite PCR primer sequences are shown in Additional file 1: Table S1. PCR amplifications were per-formed in a final volume of 20μl, containing: PCR buffer (50 mM Tris-HCl (pH 9.0), 50 mM NaCl, 0.1 mg/ml BSA and 5 mM MgCl2), 200μM of each dNTPs, ~10 ng gDNA, 1 μm of forward and reverse primer and 1 unit of EconoTaq DNA polymerase (Lucigen, USA). For the nested reactions, 2–5 μl of the first PCR product was used for the second PCR reaction. PCR amplification conditions were, an initial denaturation at 95 °C for 3 min, followed by 45 cycles of 30s at 95 °C, 30s at 60– 55 °C and a final elongation step for 20 min at 72 °C.
Allele size determination and multi-locus genotype determination
PCR amplicon size to the level of 1 bp using GeneMap-per Software v5.0 (Life Technologies). Each scored allele was given a unique number for each locus and multi-locus genotypes (MLGs) defined by the specific combin-ation of alleles across all loci (Table 2).
Genetic analysis
We analyzed data on allele frequencies, heterozygosity, allelic richness, inbreeding coefficient (FIS), and Nei gen-etic distance using GenAIEx v6.5 [26]. Microsatellite loci were evaluated for agreement with Hardy-Weinberg equilibrium (test for non-random association of alleles within diploid individuals) and linkage disequilibrium (non-random association of alleles at different loci) be-tween pairs of loci using Arlequin v3.5 [27]. Genotypic polymorphism was estimated as the number of different MLGs divided by the total number of isolates for total population and temporal groups. To show genotype di-versity, a dendrogram based on MLGs was constructed using the neighbor-joining method in MEGA v6 [28]. To evaluate temporal genetic differentiation we performed an analysis of molecular variance (AMOVA) and princi-pal component analysis as implemented in GenAIEx v6.5 [26].
Results
Microsatellite markers analysis
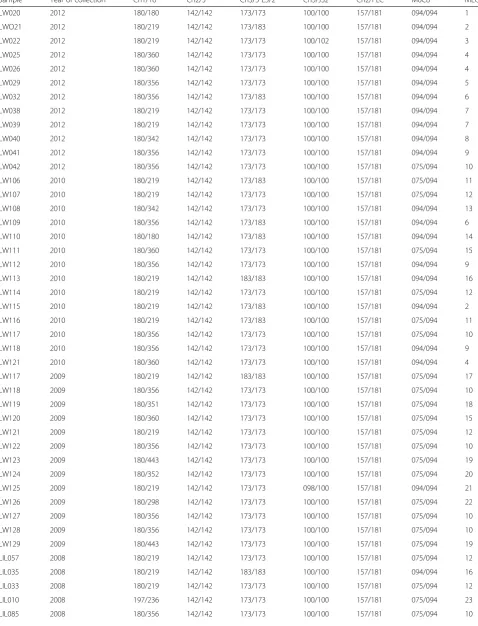
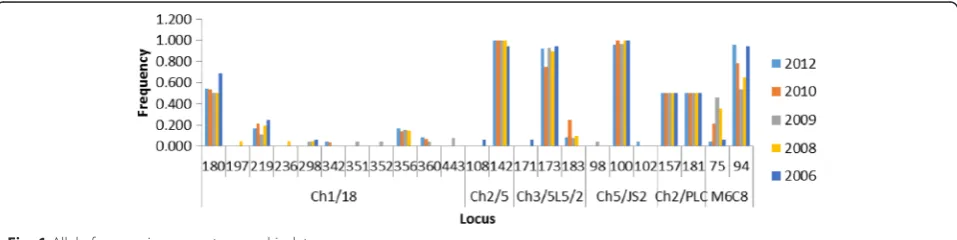
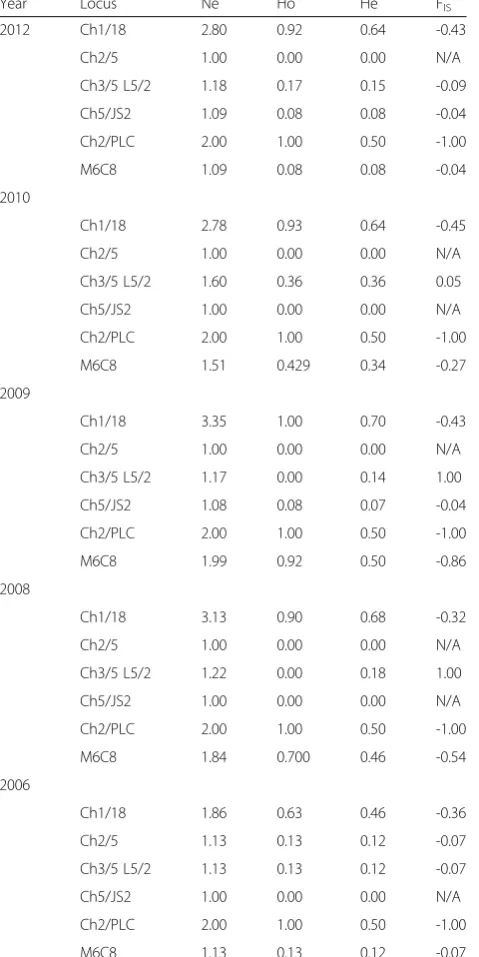
We genotyped a total of sixty-three infected blood sam-ples isolated from an active HAT focus in Northern Uganda over a six-year period (2006–2012) using six single-locus microsatellite markers. Among the 63 geno-typed samples, six isolates did not amplify across all markers and were excluded from further analysis. Multi-locus genotypes (MLGs) were allocated to the remaining 57 samples basing on a combination of alleles across markers (Table 1). Among the markers, Ch1/18 was the most polymorphic with a total of 11 alleles (Fig. 1). Ma-jority of isolates were homozygous for markers Ch2/5 (98.2 %), Ch3/5 L5/2 (86 %) and Ch5/JS2 (96.5 %), while for marker Ch2/PLC all isolates were heterozygous. Ma-jority of loci demonstrated an excess of heterozygosity (Ho > He, FIS< 0). FIS values for these markers ranged from -0.04 to -1.0 (Table 2). However, loci Ch3/5 L5/2 in some cases displayed heterozygote deficiency (FIS range 0.05–1.0). Private alleles were detected for makers Ch1/8 (alleles: 351, 352, 443, 197, 235), Ch5/JS2 (102 and 98), CH2/5 (108) and Ch3/5 L5/2 (171).
Genetic polymorphism and population structure
To examine genetic polymorphism among T. b. rhode-sienseisolates, MLGs were derived for each sample using the distribution of alleles across the six markers. We iden-tified 26 unique genotypes among the 57 samples ac-counting for 45.6 % diversity across isolates. To further
examine the level of genetic polymorphism among iso-lates, we used MLGs to construct a dendrogram of simi-larity (Fig. 2). No significant bootstrap values were detected across all major nodes, indicating limited genetic polymorphism among isolates.
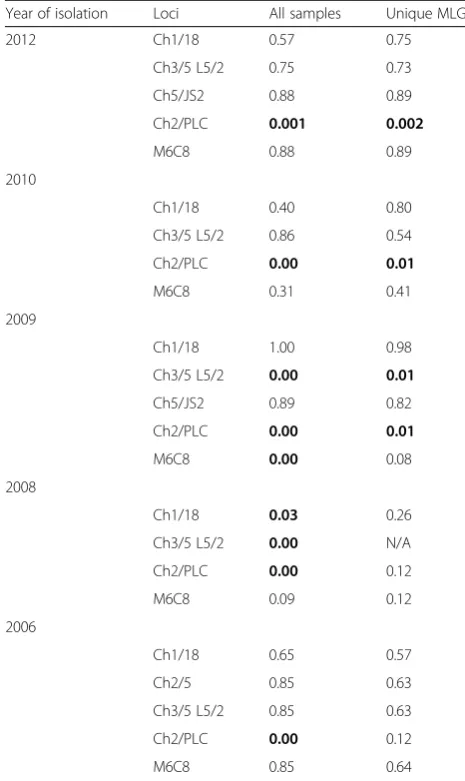
To examine the population structure of T. b. rhode-siense isolates, we examined genotypes for deviation from Hardy-Weinberg equilibrium. Strong disagreement was revealed for marker Ch2/PLC across all temporal groups, Ch3/5 L5/2 in 2009 and 2008 and M6C8 in 2009 (Table 3). We observed a significant number of re-peated genotypes and rere-peated genotypes can conceal underlying random mating. We therefore, repeated the test with repeated genotypes treated as one sample (n= 23). Marker Ch2/PLC and Ch3/5 L5/2 remained in Hardy-Weinberg disagreement. To test for possible re-combination, linkage disequilibrium across pairs of poly-morphic loci was examined. Three out of six pairwise comparisons showed significant linkage (Table 4). When repeated MLGs were treated as single isolates, significant linkage remained in two pairwise comparisons. There-fore, the presence of a high proportion of repeated geno-types, disagreement with Hardy-Weinberg equilibrium in a majority of loci and linkage disequilibrium indicate significant departure from panmixia (frequent sexual re-combination). Results from this study thus provide evi-dence for clonality in the parasite population.
Temporal stability of isolates
In order to investigate the effect of time on T. b. rhode-siensepopulation stability, we treated samples isolated in different years starting from 2006 as separate groups. We show that the number of MLGs and genotypic poly-morphism within the same temporal group increased with time from 2006. Samples isolated in 2006 and 2008 had the list number of unique MLGs (Additional file 2: Table S2). Predominant genotypes MLG 1 and seven iso-lated in 2006 were still detectable in 2012 and similarly MLG 10 and 12 in 2008, 2009 and 2010. These data show that although unique MLGs appear over time, iso-lates appear stable with some isoiso-lates responsible for the 2006 outbreak still detectable. To investigate ifT. b. rho-desienseisolates could be sub-structured in time, we car-ried out an analysis of molecular variance (AMOVA, Table 5). Our results show low values of FST’(0–0.115) in-dicating negligible genetic differentiation across temporal isolates. This observation is further confirmed by PCA (Additional file 3: Figure S1) with temporal genotypes ran-domly distributed across the two principal coordinates.
Discussion
Kaberamaido-Table 1Multi-locus genotypes (MLGs) and size of alleles for the different microsatellite loci
Sample Year of collection Ch1/18 Ch2/5 Ch3/5 L5/2 Ch5/JS2 Ch2/PLC M6C8 MLG
LW020 2012 180/180 142/142 173/173 100/100 157/181 094/094 1
LWO21 2012 180/219 142/142 173/183 100/100 157/181 094/094 2
LW022 2012 180/219 142/142 173/173 100/102 157/181 094/094 3
LW025 2012 180/360 142/142 173/173 100/100 157/181 094/094 4
LW026 2012 180/360 142/142 173/173 100/100 157/181 094/094 4
LW029 2012 180/356 142/142 173/173 100/100 157/181 094/094 5
LW032 2012 180/356 142/142 173/183 100/100 157/181 094/094 6
LW038 2012 180/219 142/142 173/173 100/100 157/181 094/094 7
LW039 2012 180/219 142/142 173/173 100/100 157/181 094/094 7
LW040 2012 180/342 142/142 173/173 100/100 157/181 094/094 8
LW041 2012 180/356 142/142 173/173 100/100 157/181 094/094 9
LW042 2012 180/356 142/142 173/173 100/100 157/181 075/094 10
LW106 2010 180/219 142/142 173/183 100/100 157/181 075/094 11
LW107 2010 180/219 142/142 173/173 100/100 157/181 075/094 12
LW108 2010 180/342 142/142 173/173 100/100 157/181 094/094 13
LW109 2010 180/356 142/142 173/183 100/100 157/181 094/094 6
LW110 2010 180/180 142/142 173/183 100/100 157/181 094/094 14
LW111 2010 180/360 142/142 173/173 100/100 157/181 075/094 15
LW112 2010 180/356 142/142 173/173 100/100 157/181 094/094 9
LW113 2010 180/219 142/142 183/183 100/100 157/181 094/094 16
LW114 2010 180/219 142/142 173/173 100/100 157/181 075/094 12
LW115 2010 180/219 142/142 173/183 100/100 157/181 094/094 2
LW116 2010 180/219 142/142 173/183 100/100 157/181 075/094 11
LW117 2010 180/356 142/142 173/173 100/100 157/181 075/094 10
LW118 2010 180/356 142/142 173/173 100/100 157/181 094/094 9
LW121 2010 180/360 142/142 173/173 100/100 157/181 094/094 4
LW117 2009 180/219 142/142 183/183 100/100 157/181 075/094 17
LW118 2009 180/356 142/142 173/173 100/100 157/181 075/094 10
LW119 2009 180/351 142/142 173/173 100/100 157/181 075/094 18
LW120 2009 180/360 142/142 173/173 100/100 157/181 075/094 15
LW121 2009 180/219 142/142 173/173 100/100 157/181 075/094 12
LW122 2009 180/356 142/142 173/173 100/100 157/181 075/094 10
LW123 2009 180/443 142/142 173/173 100/100 157/181 075/094 19
LW124 2009 180/352 142/142 173/173 100/100 157/181 075/094 20
LW125 2009 180/219 142/142 173/173 098/100 157/181 094/094 21
LW126 2009 180/298 142/142 173/173 100/100 157/181 075/094 22
LW127 2009 180/356 142/142 173/173 100/100 157/181 075/094 10
LW128 2009 180/356 142/142 173/173 100/100 157/181 075/094 10
LW129 2009 180/443 142/142 173/173 100/100 157/181 075/094 19
LIL057 2008 180/219 142/142 173/173 100/100 157/181 075/094 12
LIL035 2008 180/219 142/142 183/183 100/100 157/181 094/094 16
LIL033 2008 180/219 142/142 173/173 100/100 157/181 075/094 12
LIL010 2008 197/236 142/142 173/173 100/100 157/181 075/094 23
[image:4.595.58.537.106.733.2]Dokolo-Amolatar HAT focus. Previously, this focus was known to be free of sleeping sickness. However, by 2004 a sizable number of cases started to emerge, with an epi-demic declared in 2006. This population (from 2006 to 2012) presents a unique opportunity to investigate geno-types responsible for maintaining endemicity in this re-gion. We genotyped trypanosomes using six microsatellite markers that have been used elsewhere and found suitable for studying parasite population structures [10, 19, 21, 24, 25]. Our results corroborate this observation in that 57 samples were successfully amplified and genotyped. How-ever, we observed a great disparity in the allele sizes for most of the microsatellite markers than previously reported [19, 21, 24]. Furthermore, private alleles were common in four of the microsatellite markers with some markers dis-playing homozygous or heterozygous allele fixation. Allele fixation might point to homogeneity in the parasite popula-tion while presence of private alleles points to the high mu-tation rate among microsatellite markers [29].
Among the 57 samples genotyped, 31 (55.5 %) were repeated MLGs indicating low genetic polymorphism
across isolates. This was further confirmed by the low bootstrap values obtained for the phylogenetic tree. These results are consistent with previous studies de-scribing T. b. rhodesienseisolates within the same focus as homogeneous [13, 19–21]. However, when genotypic polymorphism was compared across the different years of isolation, polymorphism increased from 2006 to 2012. This upward increase in genetic polymorphism (from 2006 to 2012) might be attributed to a recent clonal ex-pansion that culminated in the 2006 disease outbreak. Since evidence of sexual recombination was limited, in-crease in number of genotypes in subsequent years might be due to intra-clonal mating in the tsetse fly vector [30].
Population genetic analysis revealed an excess of het-erozygosity (FIS< 0), a strong disagreement with Hardy-Weinberg equilibrium and significant linkage disequilib-rium between pairs of loci. Thus, all these observations and the occurrence of multiple repeated genotypes sup-port departure from panmixia. We further tested for the existence of an epidemic structure (occurrence of mating
Table 1Multi-locus genotypes (MLGs) and size of alleles for the different microsatellite loci(Continued)
LIL025 2008 180/356 142/142 173/173 100/100 157/181 094/094 9
LIL005 2008 180/298 142/142 173/173 100/100 157/181 075/094 22
LIL040 2008 180/356 142/142 173/173 100/100 157/181 075/094 10
LIL065 2008 180/180 142/142 173/173 100/100 157/181 075/094 24
LIL047 2008 180/219 142/142 173/173 100/100 157/181 094/094 7
12025 2006 180/219 142/142 173/173 100/100 157/181 094/094 7
12024 2006 180/219 142/142 173/173 100/100 157/181 094/094 7
SS391 2006 180/219 142/142 173/173 100/100 157/181 094/094 7
SS390 2006 180/180 142/142 173/173 100/100 157/181 094/094 1
SS396 2006 180/298 142/142 173/173 100/100 157/181 094/094 25
SS387 2006 180/219 108/142 171/173 100/100 157/181 075/094 26
SS388 2006 180/180 142/142 173/173 100/100 157/181 094/094 1
SS392 2006 180/180 142/142 173/173 100/100 157/181 094/094 1
Results are given as XXX/YYY, where XXX is the size of the smallest allele (base pairs) and YYY is the size of the larger allele
obscured by expansion of a few genotypes) by treating repeated genotypes as single samples. Linkage disequilib-rium and deviation form Hardy-Weinberg equilibdisequilib-rium remained for some markers. Therefore, this evidence makes it clear that T. b. rhodesienseisolates in Uganda are clonal with limited or no genetic exchange. Our results are consistent with previous T. b. rhodesiense studies in Uganda using microsatellite markers [19],
minisatellite markers [13] and among T. b. gambiense isolates in west Africa [16–18]. However, Duffy et al. [19] demonstrated that T. b. rhodesiense isolates in Malawi were genetically diverse with evidence of fre-quent mating. Similarly, among central African T. b. gambiense isolates recombination was evident in one population [18]. Although, factors responsible for this geographical sub-structuring have not been well charac-terized, evidence from laboratory studies points to pos-sible sexual recombination between T. b. rhodesiense andT. b. brucei[8] andT. b. bruceiwithT. b. gambiense group 2 [10].
[image:6.595.303.540.84.461.2]We further investigated for evidence of temporal sub-structuring among isolates. We observed no significant FST’values and limited PCA clustering, all in support of limited temporal genetic differentiation. Our results thus show that circulating genotypes across time are related. Indeed, we observed two MLGs (1 and 7) that were
Table 2Heterozygosity within the population
Year Locus Ne Ho He FIS
2012 Ch1/18 2.80 0.92 0.64 -0.43
Ch2/5 1.00 0.00 0.00 N/A
Ch3/5 L5/2 1.18 0.17 0.15 -0.09
Ch5/JS2 1.09 0.08 0.08 -0.04
Ch2/PLC 2.00 1.00 0.50 -1.00
M6C8 1.09 0.08 0.08 -0.04
2010
Ch1/18 2.78 0.93 0.64 -0.45
Ch2/5 1.00 0.00 0.00 N/A
Ch3/5 L5/2 1.60 0.36 0.36 0.05
Ch5/JS2 1.00 0.00 0.00 N/A
Ch2/PLC 2.00 1.00 0.50 -1.00
M6C8 1.51 0.429 0.34 -0.27
2009
Ch1/18 3.35 1.00 0.70 -0.43
Ch2/5 1.00 0.00 0.00 N/A
Ch3/5 L5/2 1.17 0.00 0.14 1.00
Ch5/JS2 1.08 0.08 0.07 -0.04
Ch2/PLC 2.00 1.00 0.50 -1.00
M6C8 1.99 0.92 0.50 -0.86
2008
Ch1/18 3.13 0.90 0.68 -0.32
Ch2/5 1.00 0.00 0.00 N/A
Ch3/5 L5/2 1.22 0.00 0.18 1.00
Ch5/JS2 1.00 0.00 0.00 N/A
Ch2/PLC 2.00 1.00 0.50 -1.00
M6C8 1.84 0.700 0.46 -0.54
2006
Ch1/18 1.86 0.63 0.46 -0.36
Ch2/5 1.13 0.13 0.12 -0.07
Ch3/5 L5/2 1.13 0.13 0.12 -0.07
Ch5/JS2 1.00 0.00 0.00 N/A
Ch2/PLC 2.00 1.00 0.50 -1.00
M6C8 1.13 0.13 0.12 -0.07
Abbreviations: Nenumber of effective alleles,Hoobserved heterozygosity,He expected heterozygosity,FISinbreeding coefficient
[image:6.595.57.297.104.583.2]isolated in 2006 still circulating in 2012. However, we found only one isolate of MLG 7 in 2008, but none in 2009 and 2010. Although this could be due to limited sample size, this might be an indicator that the spatial population structure ofT. b. rhodesienseremained chan-ging backward and forward. This change might be due
to medical efforts that have been occurring in this region involving mass treatment of cattle and tsetse trapping [31]. Our results are in agreement with a previousT. b. rhodesiensestudy in Tanzania in which predominant ge-notypes isolated in 1991 were still detectable in 1994 [20]. On the contrary, a study in Uganda did not reveal any evidence of temporal stability among T. b. rhode-siense isolates [19]. In the latter study, genotypes circu-lating in the mid-1990s were shown to be distinct from those isolated in 1970 and 1990. However, our findings are consistent with a minisatellite marker study in which analyzed samples demonstrated genotypes similar to those in samples isolated 30 years back [13].
Conclusion
[image:7.595.54.287.121.512.2]Microsatellite markers in this study were valuable in assessing the genetic polymorphism among T. b. rhode-sienseisolates. Results of this study have shown that iso-lates in Kaberamaido-Dokolo-Amolatar HAT focus have limited genetic polymorphism. Our results on the popu-lation genetics of this parasite support a clonal popula-tion structure. No genetic sub-structuring was observed between isolates obtained between 2006 and 2012 show-ing that T. b. rhodesiense isolates are stable over time. We further demonstrate that endemic foci of disease are maintained by stable genotypes rather than an in-flux of new genotypes. Our results have considerable importance in understanding and tracking the spread of sleeping sickness with significant implication to disease control.
Table 3Agreement with Hardy-Weinberg based on polymorphic loci with all samples and repeated multi-locus genotypes treated as single samples
Year of isolation Loci All samples Unique MLGs
2012 Ch1/18 0.57 0.75
Ch3/5 L5/2 0.75 0.73
Ch5/JS2 0.88 0.89
Ch2/PLC 0.001 0.002
M6C8 0.88 0.89
2010
Ch1/18 0.40 0.80
Ch3/5 L5/2 0.86 0.54
Ch2/PLC 0.00 0.01
M6C8 0.31 0.41
2009
Ch1/18 1.00 0.98
Ch3/5 L5/2 0.00 0.01
Ch5/JS2 0.89 0.82
Ch2/PLC 0.00 0.01
M6C8 0.00 0.08
2008
Ch1/18 0.03 0.26
Ch3/5 L5/2 0.00 N/A
Ch2/PLC 0.00 0.12
M6C8 0.09 0.12
2006
Ch1/18 0.65 0.57
Ch2/5 0.85 0.63
Ch3/5 L5/2 0.85 0.63
Ch2/PLC 0.00 0.12
M6C8 0.85 0.64
[image:7.595.305.539.121.205.2]Significant disagreements are indicated in bold atP< 0.05,N/Anot applicable
Table 4Linkage disequilibrium between pairs of loci
Locus Ch1/18 Ch2/5 Ch3/5 L5/2 Ch5/JS2 Ch2/PLC M6C8
Ch1/18 – 1.00/1.00 1.00/0.98 1.00/1.00 0.00/0.036 0.03/0.36
Ch2/5 – – 0.00/0.006 1.00/0.96 0.93/0.89 0.002/0.02
Ch3/5 L5/2 – – – 1.00/0.94 1.00/0.99 0.32/0.43
Ch5/JS2 – – – – 0.98/0.96 0.58/0.58
Ch2/PLC – – – – – 0.00/0.02
M6C8 – – – – – –
[image:7.595.57.544.625.724.2]Results are represented as“all samples/unique MLGs”. Significant linkage disequilibrium is indicated in bold atP< 0.05 after Bonferroni correction [32]
Table 5Pairwise values of Wright’s fixation index (FST’; below diagonal) between populations ofT. b. rhodesiensedefined by year of isolation
2012 2010 2009 2008 2006
0.000 2012
0.021 0.000 2010
0.115 0.050 2009
0.052 0.001 0.014 0.000 2008
Additional files
Additional file 1: Table S1.Microsatellite loci and primer sequences. (DOCX 13 kb)
Additional file 2: Table S2.Multi-locus genotypes summarized by temporal group (year of isolation). (DOCX 12 kb)
Additional file 3: Figure S1.Principal coordinate analysis (PCA) forT. b. rhodesienseisolates (2006–2012). (PNG 5459 kb)
Abbreviations
AMOVA:analysis of molecular variance; HAT: human African trypanosomiasis; MLGs: multi-locus genotypes; PCA: principal component analysis;
PCR: polymerase chain reaction; WGA: whole genome amplification.
Competing interests
The authors declare that they have no competing interests.
Authors’contributions
VPA & EM received the grant; CDK, VPA, AN, CMM & EM designed laboratory protocols; CDK, AN & CMM analyzed the data; EM, CDK & CMM wrote the paper; VPA & AN reviewed the paper. All authors read and approved the final version of the manuscript.
Acknowledgements
This work was supported within the framework of the consortium Afrique One“Ecosystem and Population Health: Expanding Frontiers in Health” (http://www.afriqueone.net/). Afrique One is funded by the Wellcome Trust (087535/Z/08/A).
Author details
1School of Bio-security, Biotechnical & Laboratory Sciences, College of Veterinary Medicine, Animal Resources & Bio-security, Makerere University, P.O Box 7062, Kampala, Uganda.2College of Natural Sciences, Makerere University, P.O Box 7062, Kampala, Uganda.
Received: 5 December 2015 Accepted: 26 April 2016
References
1. Barnett SF. The trypanosomes of mammals By C.A. Hoare. J Small Anim Pract. 1972;13(11):671–2. doi:10.1111/j.1748-5827.1972.tb06818.x. 2. MacLeod A, Tait A, Turner CMR. The population genetics ofTrypanosoma
bruceiand the origin of human infectivity. Philos Trans R Soc Lond B Biol Sci. 2001;356(1411):1035–44.
3. MacLeod A, Welburn S, Maudlin I, Turner CMR, Tait A. Evidence for multiple origins of human infectivity inTrypanosoma bruceirevealed by minisatellite variant repeat mapping. Mol Biol Evol. 2001;52(3):290–301.
4. Paindavoine P, Pays E, Laurent M, Geltmeyer Y, Le Ray D, Mehlitz D, et al. The use of DNA hybridization and numerical taxonomy in determining relationships betweenTrypanosoma bruceistocks and subspecies. Parasitology. 1986;92(01):31–50.
5. Tibayrenc M, Kjellberg F, Ayala FJ. A clonal theory of parasitic protozoa: the population structures ofEntamoeba,Giardia,Leishmania,Naegleria,
Plasmodium,Trichomonas, andTrypanosomaand their medical and taxonomical consequences. Proc Natl Acad Sci. 1990;87(7):2414–8. 6. Tait A. Evidence for diploidy and mating in trypanosomes. Nature. 1980;287:
536–8.
7. Hide G, Welburn S, Tait A, Maudlin I. Epidemiological relationships of
Trypanosoma bruceistocks from South East Uganda: evidence for different population structures in human infective and non-human infective isolates. Parasitology. 1994;109(01):95–111.
8. Gibson WC. Analysis of a genetic cross betweenTrypanosoma brucei rhodesienseandT. b. brucei. Parasitology. 1989;99(03):391–402. 9. Jenni L, Marti S, Schweizer J, Betschart B, Le Page R, Wells J, et al. Hybrid
formation between African trypanosomes during cyclical transmission. Nature. 1986;322:173–5.
10. MacLeod A, Tweedie A, McLellan S, Taylor S, Cooper A, Sweeney L, et al. Allelic segregation and independent assortment inT. bruceicrosses: proof
that the genetic system is Mendelian and involves meiosis. Mol Biochem Parasitol. 2005;143(1):12–9.
11. Turner C, Sternberg J, Buchanan N, Smith E, Hide G, Tait A. Evidence that the mechanism of gene exchange inTrypanosoma bruceiinvolves meiosis and syngamy. Parasitology. 1990;101(03):377–86.
12. Gibson WC, Stevens J. Genetic exchange in the trypanosomatidae. Adv Parasitol. 1999;43:1–46.
13. MacLeod A, Tweedie A, Welburn SC, Maudlin I, Turner CMR, Tait A. Minisatellite marker analysis ofTrypanosoma brucei: reconciliation of clonal, panmictic, and epidemic population genetic structures. Proc Natl Acad Sci. 2000;97(24):13442–7.
14. Macedo AM, Machado CR, Oliveira RP, Pena SD.Trypanosoma cruzi: genetic structure of populations and relevance of genetic variability to the pathogenesis of Chagas disease. Mem Inst Oswaldo Cruz. 2004;99(1): 1–12.
15. Schwenkenbecher JM, Fröhlich C, Gehre F, Schnur LF, Schönian G. Evolution and conservation of microsatellite markers forLeishmania tropica. Infect Genet Evol. 2004;4(2):99–105.
16. Koffi M, De Meeûs T, Bucheton B, Solano P, Camara M, Kaba D, et al. Population genetics ofTrypanosoma brucei gambiense, the agent of sleeping sickness in Western Africa. Proc Natl Acad Sci. 2009;106(1):209–14. 17. Morrison LJ, Tait A, McCormack G, Sweeney L, Black A, Truc P, et al.
Trypanosoma brucei gambienseType 1 populations from human patients are clonal and display geographical genetic differentiation. Infect Genet Evol. 2008;8(6):847–54.
18. Simo G, Njiokou F, Tume C, Lueong S, De Meeûs T, Cuny G, et al. Population genetic structure of Central AfricanTrypanosoma brucei gambienseisolates using microsatellite DNA markers. Infect Genet Evol. 2009;10(1):68–76.
19. Duffy CW, MacLean L, Sweeney L, Cooper A, Turner CMR, Tait A, et al. Population genetics ofTrypanosoma brucei rhodesiense: clonality and diversity within and between foci. PLoS Negl Trop Dis. 2013;7(11):1–11. 20. Komba E, Kibona S, Ambwene A, Stevens J, Gibson W. Genetic diversity
amongTrypanosoma brucei rhodesienseisolates from Tanzania. Parasitology. 1997;115(06):571–9.
21. MacLean LM, Odiit M, MacLeod A, Morrison L, Sweeney L, Cooper A, et al. Spatially and genetically distinct African Trypanosome virulence variants defined by host interferon-γresponse. J Infect Dis. 2007;196(11):1620–8. 22. Welburn SC, Picozzi K, Fevre EM, Coleman PG, Odiit M, Carrington M, et al.
Identification of human-infective trypanosomes in animal reservoir of sleeping sickness in Uganda by means of serum-resistance-associated (SRA) gene. Lancet. 2001;358(9298):2017–9.
23. Morrison LJ, Mccormack G, Sweeney L, Likeufack AC, Truc P, Turner CM, et al. Use of multiple displacement amplification to increase the detection and genotyping ofTrypanosomaspecies samples immobilized on FTA filters. Am J Trop Med Hyg. 20007;76(6):1132–7.
24. Biteau N, Bringaud F, Gibson W, Truc P, Baltz T. Characterization of Trypanozoon isolates using a repeated coding sequence and microsatellite markers. Mol Biochem Parasitol. 2000;105(2):187–202.
25. Koffi M, Solano P, Barnabé C, De Meeûs T, Bucheton B, Cuny G, et al. Genetic characterisation ofTrypanosoma bruceisl using microsatellite typing: New perspectives for the molecular epidemiology of human African trypanosomosis. Infect Genet Evol. 2007;7(6):675–84.
26. Peakall R, Smouse PE. GenAlEx 6.5: genetic analysis in Excel. Population genetic software for teaching and research-an update. Bioinformatics. 2012; 28(19):2537–9. doi:10.1093/bioinformatics/bts460.
27. Excoffier L, Lischer HE. Arlequin suite ver 3.5: a new series of programs to perform population genetics analyses under Linux and Windows. Mol Ecol Resour. 2010;10(3):564–7. doi:10.1111/j.1755-0998.2010.02847.x.
28. Tamura K, Stecher G, Peterson D, Filipski A, Kumar S. MEGA6: Molecular Evolutionary Genetics Analysis version 6.0. Mol Biol Evol. 2013;30(12):2725–9. doi:10.1093/molbev/mst197.
29. Chakraborty R, Kimmel M, Stivers DN, Davison LJ, Deka R. Relative mutation rates at di-, tri-, and tetranucleotide microsatellite loci. Proc Natl Acad Sci. 1997;94(3):1041–6.
30. Peacock L, Ferris V, Bailey M, Gibson W. Intraclonal mating occurs during tsetse transmission ofTrypanosoma brucei. Parasit Vectors. 2009; 2(1):43.
31. Kabasa JD. Public-private partnership works to stamp out sleeping sickness in Uganda. Trends Parasitol. 2007;23(5):191–2.