R E S E A R C H
Open Access
Plasmodium knowlesi
gene expression differs in
ex vivo
compared to
in vitro
blood-stage cultures
Stacey A Lapp
1, Sachel Mok
2, Lei Zhu
2, Hao Wu
3, Peter R Preiser
2, Zybnek Bozdech
2and Mary R Galinski
1,4*Abstract
Background:Plasmodium knowlesiis one of fivePlasmodiumspecies known to cause malaria in humans and can result in severe illness and death. While a zoonosis in humans, this simian malaria parasite species infects macaque monkeys and serves as an experimental model forin vivo, ex vivoandin vitrostudies. It has underpinned malaria discoveries relating to host-pathogen interactions, the immune response and immune evasion strategies. This study investigated differences inP. knowlesigene expression in samples fromex vivoandin vitrocultures.
Methods:Gene expression profiles were generated using microarrays to compare the stage-specific transcripts detected for a clone ofP. knowlesipropagated in the blood of a rhesus macaque host and then grown in anex-vivo culture, and the same clone adapted to long-termin vitroculture. Parasite samples covering one blood-stage cycle were analysed at four-hour intervals. cDNA was generated and hybridized to an oligoarray representing theP. knowlesigenome. Two replicate experiments were developed fromin vitrocultures. Expression values were filtered, normalized, and analysed using R and Perl language and applied to a sine wave model to determine changes in equilibrium and amplitude. Differentially expressed genes fromex vivoandin vitrotime points were detected using limma R/Bioconductor and gene set enrichment analysis (GSEA).
Results:Major differences were noted between theex vivoandin vitrotime courses in overall gene expression and the length of the cycle (25.5 hoursex vivo;33.5 hoursin vitro). GSEA of genes up-regulatedex vivoshowed an enrichment of various genes includingSICAvar, ribosomal- associated and histone acetylation pathway genes. In contrast, certain genes involved in metabolism and cell growth, such as porphobilinogen deaminase and tyrosine phosphatase, and oneSICAvargene, were significantly up-regulatedin vitro.
Conclusions:This study demonstrates how gene expression inP. knowlesiblood-stage parasites can differ dramatically depending on whether the parasites are grownin vivo, with only one cycle of developmentex vivo, or as an adapted isolate in long-termin vitroculture. These data bring emphasis to the importance of studying the parasite, its biology and disease manifestations in the context of the host.
Keywords:Plasmodium knowlesi, Malaria, Non-human primates,Macaca mulatta, Blood-stage infections, Microarrays, Antigenic variation, Gene expression,SICAvar, Haem
Background
Plasmodium invasion, growth and development in red blood cells (RBCs) is a complex process entailing many levels of controlled gene expression, receptor-ligand in-teractions, host cell modifications, and communication with the outside milieu. Each species ofPlasmodiumhas
between 5,100 and 7,700 or so genes [1], which as first shown forPlasmodium falciparum,become differentially expressed throughout the parasite’s intra-developmental cycle (IDC) in the blood [2-4]. Understanding the multi-tude of molecular and cell biological events required by Plasmodium to successfully parasitize RBCs and evade host defenses is paramount and increasingly within reach with post-genomic approaches [5-7].
The development of a continuousin vitro blood-stage culture system for P. falciparum was an essential step towards significantly advancing research in many of * Correspondence:mary.galinski@emory.edu
1
Emory Vaccine Center, Yerkes National Primate Research Center, Emory University, Atlanta, GA, USA
4
Department of Medicine, Division of Infectious Diseases, Emory University, Atlanta, GA, USA
Full list of author information is available at the end of the article
these areas of blood-stage malariology, as well as the development of malaria diagnostics, drug and vaccine candidate interventions [8]. A comparably robust blood-stage culture system is also available for the simian mal-aria species Plasmodium knowlesi [9,10], but not other primate malaria species. Attempts have been made to develop continuous cultures of Plasmodium vivax [11] and the very closely related simian malaria parasite species Plasmodium cynomolgi [12], but the preference for reticulocyte host cells along with other possible re-quirements that have yet to be discovered have so far prohibited the development of routine long-term culture systems for these species [13-15].
While the utility of P. falciparum and P. knowlesi in vitroblood-stage culture systems has been evident for many avenues of research, including genetic manipula-tion to study gene expression characteristics and deter-mine functional traits, the biological states of parasites in host organisms can differ substantially from that of in vitro cultured parasites. For example, this became evident for P. falciparumwith recognition of the loss of non-essential gene segments in culture [16] and reviewed in [17]. Expression of the variant antigen vargene tran-scripts from P. falciparum have also been shown to be-come down-regulated when clinical isolates are adapted to in vitro culture [18,19]. Numerous changing metabolic and physical parameters in the parasite and host factors are either different or lacking in vitro, which may affect the parasite’s normal growth and biology. Investigations have shown that even one altered parameter, such as glu-cose level, can result in a marked change in gene expres-sion profiles in cultured P. falciparum, with 560 genes exhibiting a two-fold or greater change in the presence of 0.6 mM glucose compared to 11.1 mM glucose [20].
Notably, P. knowlesi can readily be studied in vivo, ex vivo and in vitro, and it can potentially serve as a model for P. falciparum or P. vivax; depending on the scientific question. Plasmodium knowlesi is currently also recognized as a species that can be transmitted to and cause illness and death in humans [21-23]. Given its broad utility, many critical basic malaria research discov-eries have been made using P. knowlesi. These include classic investigations of merozoite attachment to and in-vasion of erythrocytes after the formation of a tight junc-tion [24,25], the first report of the phenomenon of antigenic variation (in rhesus monkeys) [26], and the first identification of parasite-encoded variant antigens expressed at the surface of infected RBCs; known as the Schizont Infected Cell Agglutination (SICA) antigens [27]. The SICA antigens are encoded by a large multi-gene family known as SICAvar [28-30], which is func-tionally analogous and evolutionarily related to the var gene family in P. falciparum [31,32]; both gene families are highly expressed in ring stages [28,30,33]. Expression
of the SICA proteinsin vivoin rhesus monkeys is associ-ated with the increased virulence of P. knowlesi, and both the expression of these proteins and switching of variant types at the surface of the infected host cells is dependent on the presence of the spleen [34]. Recent studies demonstrate for the first time that SICA[−] para-sites lack full-length SICAvar transcripts and lack SICA protein, consistent with apparent post-transcriptional processing and translational repression [30].
Particularly now with the expanding potential for post-genomic exploration ofPlasmodium biology and patho-genesis, and the use of comprehensive systems biology approaches to understand host-pathogen interactions, it is important to define and be cognizant of the similar-ities and differences in gene expression that may occur when Plasmodium is grown in a living host, compared to in vitro. Here, these parameters are examined by studying the stage-specific gene expression profiles ofP. knowlesi blood-stage parasites when grown in a rhesus monkey followed by one cycle ofex vivogrowth and de-velopment compared to long-term in vitro culture. The majority of the observed microarray signals correspond to genes that are annotated in the current P. knowlesi genome database as hypothetical. Of the various differ-entially expressed (DE) known genes, it is striking that signals representing a large number of SICAvar gene transcripts were strongly up-regulated in the ex vivo (ring-stage) samples, but not in the in vitro samples. These observations in totoare germane for understand-ing the biology of theP. knowlesiintraerythrocytic devel-opment cycle (IDC) and the pathogenesis and virulence of this species. The results are also highly pertinent as indicators of what biological or biochemical networks and pathways may likewise be affected when other spe-cies including P. falciparum are grown and propagated long-term underin vitroconditions.
Methods Ethics statement
enrichment. In addition, destructible enrichment is dis-tributed as prescribed to monkeys. Rhesus macaques re-ceive jumbo biscuits (15% protein). Animals are fed twice daily. The amount of food is adjusted depending on species, sex, age, weight and specific number of ani-mals living in a group. Consumption is monitored and adjustments are made as necessary so that animals get enough food with minimum waste. Enrichment produce is fed twice weekly. All animals are monitored daily by veterinary staff for potential health problems. Experi-enced personnel trained all animals to voluntary present at the front of the cage for skin prick using positive reinforcement. For blood collection, as required by this study, animals are sedated with Ketamine (10 mg/kg IM), which is allowed no more than twice per 24 hours. Per IACUC guidelines, maximum blood volume col-lected cannot exceed 10 ml/kg/month. The one rhesus macaque assigned to this study was treated and available for other studies at the Yerkes National Primate Re-search Center.
Parasite samples for microarray analysis
Anex vivo P. knowlesi blood-stage culture was initiated using iRBCs from a rhesus macaque infected with the Pk1(A+) clone of P. knowlesi [27]. The Pk1(A+) clone was selected since the genomic DNA from this clone was used to develop the first reported P. knowlesi gen-ome sequence [35]. Briefly, a cryopreserved vial of ring-stage parasites was thawed, processed and inoculated into a rhesus monkey using standardized procedures. Parasitaemia was monitored daily and whole blood was collected into heparin-treated tubes when it reached 8% ring-stage infected RBCs (iRBCs). The monkey was treated with 15 mg/kg of chloroquine for 3 days to clear the parasites. Collected whole blood was treated with a final concentration of 2 mg/ml ADP (adenosine diphos-phate bis salt) for 5 min before passage through a glass bead column equilibrated with Hank’s balanced salt so-lution to remove platelets, followed by passage through a Plasmodipur filter. The filtered blood was centrifuged for 5 min at 800 g and the pellet resuspended in RPMI with L-glutamine, supplemented with 0.25% sodium bi-carbonate, 50 ug/ml hypoxanthine, 7.2 mg/ml HEPES, 2 mg/ml glucose, 10% human AB+ serum. The iRBCs were cultured at 1 × 10⁷iRBCs/ml in multiple 175 cm2 flasks (one per time point, TP) and gassed with 5%: 5%: 90%, O2:CO2:N2. One culture flask was processed every four hours over a 24-hour period for extraction of para-site RNA, and these samples were designated as ex vivo TP #s 1–6.
For the in vitro time course samples, a cryopreserved vial of culture-adapted Pk1(A+) parasites was thawed using standardized procedures, and expanded in RPMI with L-glutamine, supplemented with 0.25% sodium
bicarbonate, 50 ug/ml hypoxanthine, 7.2 mg/ml HEPES, 2 mg/ml glucose, 10% human AB+ serum. Fresh rhesus RBCs were added as necessary, and the parasitaemia was maintained at less than 10%. The culture was synchro-nized by consecutive Percoll (52%) and sorbitol treat-ment in which RBCs were suspended in 5X volume of pre-warmed 5% sorbitol, incubated for five minutes and washed three times in RPMI [36]. Since thein vitro cul-tured parasites develop at a slightly slower rate than in vivo, a 28- or 32-hour time course plan was designed for RNA extraction, with iRBC collection every four hours. Samples were generated representing two bio-logical replicates (I and II), with samples for seven TPs collected for the first replicate and eight for the second; the eighth TP was particularly aimed at collecting very mature segmenting schizonts.
RNA extraction
For the first two time points from the ex vivo culture, 1 × 10¹⁰ iRBCs were collected and put into Trizol LS (Invitrogen) at a 1:10 pellet to reagent ratio, vigorously shaken for 1 min, incubated at 37°C for 5 min, and stored at −80°C. For all other time points from the ex vivo culture, 5 × 10⁹ iRBCs were collected. At the last time point, a 1:20 pellet to Trizol LS ratio was used to extract RNA. All samples were immediately stored at −80°C. For the in vitro cultures, approxi-mately 5 × 10⁹ parasites were collected for the first two time points, and 1 × 10⁹ parasites were collected for the remaining time points. To purify the total RNA, the parasite/Trizol samples were thawed at room temperature and transferred to 30 ml Teflon tubes. One ml chloroform per 5 ml sample volume was added and vigorously shaken for 1 min before centri-fuging at 12,000 g for 30 min at 4°C. The aqueous layers were removed to a 30 ml polypropylene tube, 0.8 volume of isopropanol added, and incubated over-night or for at least 2 hours at −20°C before centrifu-ging at 12,000 g for 30 min at 4°C. The supernatant was carefully removed and the pellet was allowed to dry for 5–10 min at room temperature and then resus-pended in 1 ml of RNase-free water. The sample was purified using the RNeasy midi kit (Qiagen) following the manufacturer’s instructions.
Proteomic analysis
37°C overnight with 0.4 g of proteomics grade trypsin (Sigma, St. Louis, MO, USA). The resulting peptides were then extracted with 0.1% trifluoroacetic acid in 50% acetonitrile (Sigma), desalted and concentrated using ZipTip pipette tips containing C18 reversed-phase media (Millipore, Billerica, MA), and then washed in 0.1% trifluoroacetic acid and eluted in 0.1% trifluoroace-tic acid/50% acetonitrile (Sigma). Cleaned peptides were analysed by reverse-phase LC-MS/MS using an LTQ-Orbitrap mass spectrometer (Thermo Finnigan). A reverse database strategy using the SEQUEST algorithm was im-plemented to evaluate false discovery rate; the matched peptides were filtered according to matching scores to re-move all false matches from the reverse database [37]. Only proteins that were matched by at least two peptides were accepted to further improve the confidence of identi-fication. The peptides were then searched against the NCBI database, with searches being limited to Plasmo-dium results. The P. knowlesi identified protein sequences were then used to BLAST (Basic Local Alignment Search Tool) against the NCBI database for sequence homologies.
Data analysis
Reannotation of oligonucleotide probes
A set of 60-mer oligonucleotide probes (Additional file 1) developed prior to the publication of the P. knowlesi genome was reannotated based on the genome sequence reported in PlasmoDB V8.2. All the oligonucleotides in the array were BLASTed against the PlasmoDB V8.2 sequences using NCBI BLAST 2.2 with the parameter of E-value cutoff at 0.1. Only oligonucleotides with unique hits to protein-coding regions were kept for further ana-lysis. The unique hit oligonucleotides were defined as probes having high first-hit bit scores (>85) and low second-hit bit scores (<60) or probes having second-hit bit scores equal to 0. Of the 4,799 P. knowlesi probes found to have unique hits, 4,755 representing 4,700 protein-coding genes were used in the analysis.
Determining the periodicity of gene expression
Microarray hybridization, data filtering and normalization
All data were processed using R and Perl language. The workflow is shown in Additional file 2. cDNA synthesis, Cy dye labelling, as well as microarray hybridizations of the time course samples were carried out as described previously [38]. For each P. knowlesi time course, sam-pling time point RNAs labelled with Cy5 were hybrid-ized against a reference RNA pool labelled with Cy3 (consisting of equal amounts of P. knowlesi RNA from each time point). Microarray hybridizations were carried out on a chip with 4,992 60-mer oligonucleotides repre-senting 4,700 coding genes designed forP. knowlesi, with the remainder representing P. vivax genes. Microarray
data acquired with GenePix Pro 6.0 software (Axon Instruments, USA) were filtered for quality control by accepting only features with Cy3 and Cy5 signal inten-sities higher than two-fold of the microarray background intensities. The log2 ratio of Cy5/Cy3 intensity was calculated after background subtraction and was nor-malized using locally estimated scatterplot smoothing (LOESS) in marray package of R. To reduce technical noise between experiments, robust quantile normalization was applied to the data across all time points to achieve the same distribution of log2 ratios (Affy package of R). After normalization, probes were filtered out that had more than two missing values across all time points for any one of the three time courses, resulting in 4,198 probes, representing 4,165 protein-coding genes that were used for further analysis (Additional file 3). The micro-array probe ratios were averaged for multiple probes of a particular gene. Data for the microarrays and probe infor-mation are available at the Gene Expression Omnibus database at the National Center for Biotechnology Infor-mation [GEO: GSE62886, GPL19374].
Sine wave modelling
To compare gene transcription between the iRBC sam-ples without knowing the exact time post-invasion, a sine wave model was applied. The function is described in Figure 1d. t is the time (hours) at each time point, and y(t)is the corresponding transcription levels at each time point. Equilibrium is the average level of one complete sine curve. It was assumed to be the balanced transcription level of a gene across the life cycle, an ori-ginal state that a gene would return after expression peak, valley and any expression changes. Amplitude is the transcription level change according to equilibrium, visually represented as the vertical distance between the extrema of the sine curve and the equilibrium value.his the period of one complete life cycle expressed in hours and phase is the fraction of one life cycle indicating the time offset of an expression peak to the time point at one quarter of the life cycle. For each gene, the parame-ters equilibrium, amplitude, and phase were determined andhoptimized within 12 to 48 by the sine wave model to find a sine function that best fits the periodical pat-tern of gene transcription levels across the life cycle.
Phase adjustment
Using the established sine wave model, expression levels were estimated for each gene at each hour during its life cycle to give rise to 25 time points (ex vivo) and 33 time points (in vitro). Thein vitro time points were mapped to ex vivotime points by determining the highest corre-lated time point betweenex vivoand in vitroexpression profiles (Additional file 4). To make the result more reli-able, only 219 genes having significant periodical expres-sion patterns were used (p value < 0.05 and amplitude >0.3 of their sine curve) in all three samples. Phase shift was estimated for each in vitrotime point based on the correspondingex vivosample. The average of phase shift then was used as the delta phase, 0.85 betweenin vitroI and ex vivo, 1.4 between the biological replicatein vitro II andex vivo.
Functional enrichment analysis
Gene set enrichment analysis (GSEA) was carried out based on GO terms, KEGG pathway and MPM pathway annotated for eachP. knowlesigene according to theirP. falciparum orthologs (PlasmoDB v8.2) [39]. 4,570 of 5,197 protein-coding genes inP. knowlesihave orthologs in P. falciparum (3,838 P. knowlesi genes with at least one GO term, 761 genes with at least one KEGG identi-fication, and 2,346 genes with at least one MPM identifi-cation). In the gene enrichment analysis, only functional groups with more than 10 genes were considered. In addition, another eight functional groups were added in-cluding SICAvar, kir and others derived from recent work [40].
Differential expression analysis by time point
For each microarray, logarithms of fold changes between the various experimental time point sample RNAs and reference RNAs were first computed for all genes. Then cross-array normalization was applied to remove global technical biases brought by different arrays. For each array the log-fold changes were shifted and rescaled so that they have the same means and variances. There are expression values for each gene at six time points for the ex vivo time course and seven time points for the two in vitrotime courses. To make the data comparable for different samples, the seven expression values for the
in vitro samples were mapped into six time points by interpolation (Additional file 5).
Assessing global differences in gene expression among the three time courses
To assess the global differences in gene expression among the ex vivo and in vitro samples, the pair-wise differences of expression were computed among the three samples for all genes. For a gene, the difference score between two samples is defined as the Euclidean distances for its expression at all time points. Smaller distance means greater similarity. By doing so three dif-ference scores were obtained for each gene, whereby each represents the difference between a pair of samples. For a gene, if the difference score between the two in vitrosamples is the smallest among the three, it indi-cates that the expression of that gene is more similar be-tween thein vitrosamples.
To rigorously assess the significance of this propor-tion, a randomization test was performed. In each per-mutation, gene labels were randomly shuffled for all samples but the time points were kept unchanged. Then the pairwise difference scores were recomputed for all genes, and the number of genes with difference scores between the in vitro samples being the smallest was computed.
Detecting individual differentially expressed (DE) genes To detect individually DE genes from ex vivo and in vitro samples, the two sets of in vitro samples were treated as biological replicates. DE genes at each time point were detected using limma R/Bioconductor soft-ware package [41]. To detect DE genes considering data from all time points, a functional t-test procedure was adopted [42]. Specifically, for each gene a modified t-statistic was computed at each time point, and then the maximum of the t-statistics from all time points was ob-tained as the test statistics for the gene. The critical value for differential expression can be obtained through a per-mutation test. Because of the small sample size, stringent criteria were used and the maximum of all t-values from all permutations were used as the threshold for defining DE genes.
(See figure on previous page.)
Figure 1Periodical transcription ofP. knowlesigenes during the IDC.Transcriptomes showing 4,165 PK genes of theex-vivo(a)and two
in-vitrosamples(b,c)of the time course sampled at 4 hour intervals over 24–32 hours in culture. First column represents raw data during time courses; second column represents raw data after median centered normalization and third column represents equilibrium value centered data after smoothing by sine functions with H = 27 forex vivoand H = 33 forin vitro.(d)Sine wave model and its equation.tis the time (hours) at each time points, andy(t)is the corresponding transcription levels at each time point. Equilibrium is the average level of one complete sine curve. Amplitude is visually represented as the vertical distance between the extrema of the sine curve and the equilibrium value.his the period of one complete life cycle expressed in hours and phase is the fraction of one life cycle indicating time offset of an expression peak to the time point at one quarter of life cycle.(e)Prediction of duration for a complete cycle ofex vivoandin vivosamples (period time). 873 genes from
Results and discussion
Microarray experiments were performed to evaluate the global gene expression profiles of P. knowlesi blood-stage parasites as they mature in host red blood cells, from ring to trophozoite and schizont stages of develop-ment, and compare the profiles betweenex vivocultures andin vitroadapted cultures. An overarching purpose of this research was to determine which gene expression patterns if any may be dependent on the presence of host factors.
A P. knowlesiinfection was established in a naïve rhe-sus monkey and the maximum blood volume allowed by IACUC guidelines and approved protocols (10 ml/kg/ month) was drawn to obtain ring-stage iRBCs forex vivo culture and the collection of stage-specific samples every 4 hours over the parasite’s 24-hour IDC. Plasmodium knowlesi asexual stage development is synchronous in vivo, making this readily feasible, beginning with ring-stage iRBCs collected from a blood draw. It would have been ideal from a scientific standpoint to obtain blood col-lections throughout the IDC, but, per IACUC guidelines, animals may only be sedated twice/day, and in addition to logistical limitations of the availability of animal resource staff over a 24-hr period,ex vivocultures were by neces-sity initiated when the iRBCs were at the ring stage of development.
For comparison, two biological replicates were gener-ated fromin vitroadapted cultures, which do not main-tain synchronous growth [9]. Acquiring these samples for comparison with the ex vivo cultures, therefore, re-quired synchronization steps (see Methods). The first in vitrotime course was collected over 28 hours. For the secondin vitrotime course an additional sample TP was collected at 32 hours to obtain segmented schizonts, the final stage of the parasite’s growth before the release of merozoites. These cultures were maintained by the addition of freshly acquired RBCs from a different rhe-sus macaque than the one used for the ex vivo time course; in our view the specific host RBCs themselves would have negligible impact on the transcription pro-files over one cycle compared to the culture environ-ment (ex vivo versus long term in vitro). Notably, the Pk1(A+) line is routinely grown in culture medium sup-plemented with human AB+ serum. An overarching goal of this work is to compare parasite biology when adapted to widely available long-term culture conditions versus ex vivo. For this reason and consistency through multiple experiments, human AB+ serum pooled from 10 different donors was used in lieu of rhesus macaque serum.
Periodicity of gene expression in theP. knowlesiIDCs To test for periodicity of gene expression in theP. know-lesiIDCs, sine wave regression was carried out for each
expressed gene during the established time courses. 3,684 (~88.5%) out of the 4,165 genes examined on the array significantly fit to a sine curve with a p value <0.05 (F test) for at least one of the time courses. These ana-lyses confirm that a majority of the parasite’s genes are transcribed periodically during the blood-stage cycle (Figure 1a, b and c), and each gene’s transcriptional pro-file can be fit to a sine wave with a determined equilib-rium, amplitude and frequency (Figure 1d). For each time-course experiment, the time required for the para-site to complete the blood-stage cycle of growth and de-velopment was estimated. For each gene, varying the cycle length from 12 hours to 48 hours identified the best-fit sine curve, and the optimized sine function with the minimum F test p-value was gained. Based on this assumption, the length of each blood-stage cycle was es-timated from genes that were significantly fitted by a sine curve (p value < 0.05) and amplitude above the me-dian (based on 873 genes for the ex vivo time course, and 879 and 1,117 genes for the in vitro I and II time courses, respectively).
Parasites grown underin vitroconditions developed at a significantly slower rate (25 hours ex vivo versus 33 hours in vitro) (p value < 2.2e-16) (Figure 1e). Sine wave models were therefore established separately with the periodic time as 25 hours and 33 hours for the ex vivo and in vitro samples, respectively. Smoothed transcription profiles are shown in the second columns of the heat maps in Figure 1a, b and c. In addition, the age of the parasite at the start of the TP collections (TP1) was markedly different for each time course when the pair-wise correlation of TP1 was calculated between the time courses. This is a reflection of the inherent difficulty in precisely matching the ages of ring-iRBCs acquired directly from a rhesus macaque infection with those from synchronized in vitro cultures. Hence, data processing and adjustments were necessary to compare theex vivoandin vitrotranscriptomes.
Comparative overview of the transcriptomes
to each other compared to the gene expression data from the ex vivosamples (Figure 2b). The pairwise differences in amplitude (p value < 2.2e-16) and equilibrium (p value < 2.2e-16) are significantly smaller between in vitro sam-ples than between in vitro and ex vivo samples. In addition, the amplitudes of gene expression were found to be significantly higher for theex vivoTPs than thein vitro TPs (p value < 2.2e-16), which is likely a result of the greater degree of synchronicity of the ex vivo culture. In the phase analyses, as expected, no significant changes were observed among the ex vivo and in vitro samples (Figure 2c).
Differentially expressed genes in equilibrium and amplitude
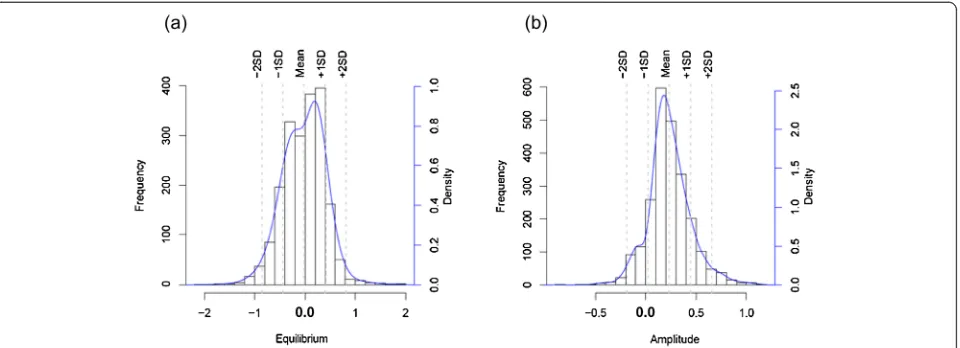
Differentially expressed genes were defined in equilib-rium and amplitude based on the criterion that the minimum differences among theex vivoand each of the two in vitro cycles were greater than the differences noted from the in vitro replicates. Taking all 4,165
considered genes into account, 2,009 transcripts were identified with changes in equilibrium and 2,355 tran-scripts with changes in amplitude. The distributions of gene numbers at each fold change are shown in Figure 3. GSEA was performed as described using P. knowlesi orthologs ofP. falciparumgenes belonging to annotated functional gene sets/pathways from KEGG, GO and MPM databases [43-45], in addition to several P. know-lesi specific gene sets including the predominant large SICAvarandkirmultigene families.
[image:8.595.58.539.89.404.2]Importantly, among the 1,029 (~51%) genes that were up-regulated in equilibrium in theex vivosamples, there was significant enrichment in genes coding for SICA proteins (FDR = 0). Other genes noted in this category are associated with biological processes relating to RNA transport, translation initiation, and phagosomes. Con-versely, 980 (~49%) of the genes that were down-regulated in equilibrium showed enrichment in transcripts involved in multiple biochemical pathways associated with nucleo-some and chromatin assembly and organization, as well as
Figure 2Overall differences betweenin vitroandex vivotime courses. (a)The distributions of pair-wise difference scores for all genes showing the similarity of the twoin vitroexperiments and how they differ from theex vivoexperiment(b)the distributions of pair-wise difference scores from a permutation showing that the difference scores do not occur by chance.(c)Comparison of amplitude, equilibrium and phase betweenex vivoandin vitrosamples. These plots show the distribution of pair-wise difference of amplitude, equilibrium and phase values of
ex vivoandin vitroI (red),ex vivoandin vitroII (pink), andin vitroI andin vitroII (blue). The amplitude difference was defined betweenex vivo
andin vitroas the minimum difference betweenex vivoand the twoin vitronamed as D-EVampand the amplitude difference between the two
DNA replication, proteasome-mediated proteolysis of proteins, and Maurer’s cleft related proteins (FDR < 25%, Figure 4a). Genes associated with ribosomal structure and fatty acid synthesis and certain organellar specific proteins (plastid, mitochondrion and ER) are among those that were less so, but also noticeably down-regulated in the ex vivoculture.
A majority (2,108 or ~89%) of genes with changes in amplitude were up-regulated in theex vivocultured par-asites. These genes mainly include ribosomal associated genes, SICAvar genes, Maurer’s Cleft related protein genes and histone acetylation pathway genes, while the down-regulated genes (247, ~11%) showed an enrich-ment to just a few invasion-related genes (FDR < 25%, Figure 4b). As a whole, the results reveal that theex vivo parasite has an overall higher capacity for transcribing certain genes involved in the interaction of host-parasites with larger stage-specific amplitudes, an effect apparently resulting directly from the in vivo growth of the parasite in rhesus monkeys, and in support of predic-tions to this effect. The up-regulated genes are accompan-ied by lowered transcription of various metabolic pathway genes such as for DNA replication, protein degradation and chromatin organization.
Significant DE genes were defined by applying the cri-terion that the minimum difference between the ex vivo and each of thein vitro cycles was greater than 1.5-fold (equal to Mean ± ~1.5 SD) of the difference between the in vitro replicates. 95 and 130 genes were up-regulated, and 162 and two genes were down-regulated, in equilib-rium and amplitude, respectively.
Differentially expressed genes by stage specificity To determine if the DE genes were biased towards any particular stage in the IDC, the transcription profiles of
all DE genes were averaged, as shown in Figure 5a, b and c. Genes that were up-regulated in equilibrium in the ex vivo culture were most highly expressed in the early ring stage and late stage schizonts (Figure 5a), while genes that were down-regulated in the ex vivo culture had peak expression in the trophozoite and early (2–4 nuclei) schizont stages (Figure 5b). Simi-larly, genes that were up-regulated in amplitude in the ex vivo culture were also highly expressed in the trophozoite stage (Figure 5c). The major significantly enriched functional pathways for the DE genes had peak expression that coincided with the stage of peak expression observed here.
[image:9.595.60.540.89.263.2]Taking all TPs into consideration using an alternative method that assesses calculated pairwise differences, 650 genes were found to be DE (FDR adjusted p-value < 0.01) between theex vivoandin vitrosamples. The majority of these genes (403; 62%) were annotated in theP. knowlesi genome database (Pk4 assembly) as hypothetical genes [1,35]. Of note, sequences representing 32 SICAvar gene IDs were shown to be differentially up-regulated at the ring stage, which corresponds to 38% of the 101SICAvar gene oligonucleotides present on the array (Figure 6). These 101 oligonucleotides represent 99 unique SICA-var gene IDs plus two contigs with SICAvar gene se-quences with most annotated at the time of this study as gene fragments [35]. Some have since been con-firmed as contiguous sequences that are part of the same gene [30]; others occur next to gaps in the assem-bly [35]. Thus, the SICAvar oligonucleotides on the microarray do not represent the entire reported SICA-var gene family, which had been estimated at 107 or 108 members [29,35]. An updatedP. knowlesigenome is forthcoming, which resolves many of these gaps (Chappellet al., personal communication).
In contrast, only three out of 53 (5.6%) of kir gene family members represented on the array were identified as DE over all TPs. Unlike the SICAvar genes, the kir genes were not up-regulated preferentially in the ring stages. Twokirgenes were identified as being DE at TP1 (rings), four at TP2 (early trophozoites), and two at TP6 (schizonts). The remaining DE genes include 31 riboso-mal genes (4.5%) and various genes involved in either protein synthesis or processing.
Genes differentially up-regulatedex vivo
A number of other genes were found to be specifically up-regulated in theex vivocultured parasites (Additional file 6, Panels 1–6). The majority of these were more highly expressed in the earliest and latest stages of
[image:11.595.59.535.360.704.2]development (Figure 6). This subset includes genes in-volved in proteolysis (PKH_011450, proteasome subunit beta typegene) and radical-based catalysis (PKH_144460, radical S-adenosyl methyltransferase protein gene), rele-vant for diverse metabolic reactions including biodegrad-ation pathways. Interestingly, PKH_143910, the putative ApiAP2 transcription factor exhibited similar dynamics ex vivoandin vitro, but at a much higher levelex vivo, es-pecially at earlier stages. Differential expression of genes involved in transcription in early stages has been docu-mented before in P. falciparum [2,4]. Some unexpected transcripts were also detected such as the P. knowlesi homolog ofpfg377 (PKH_146780), which encodes a pro-tein that is specifically found on female gametocytes, and the PSOP12 homolog (PKH_101880) that encodes a
Figure 5Average transcription profile and heatmap of DE genes during time courses (fold change > 1.5). (a)95 genes up-regulated in equilibrium(b)162 down regulated in equilibrium(c)130 up-regulated in amplitude.
(See figure on previous page.)
secreted protein at the ookinete stage. Gametocytes are often produced when the parasitaemia reaches high levels in rhesus macaques, and this could explain the detection of the pfg377 homolog transcript. The ookinete protein could either have a separate function in the blood-stage parasites, or it is possible that the transcript is produced and maintained early, prior to its ultimate translation in the insect stage.
Genes differentially up-regulatedin vitro
Only a few genes were found to be up-regulated in the in vitrocompared toex vivo-cultured parasites (Additional file 6, Panels 6–8). Most of these genes were expressed at higher levels in the later stages of the IDC. Several genes involved in metabolism and cell growth were significantly up-regulated in thein vitrocultures: e.g.,porphobilinogen deaminase (PBGD) (PKH_130850) and protein tyrosine phosphatase(PKH_122120). The former is involved in the haem biosynthesis pathway, catalyzing porphobilinogen to uroporphyrinogen III (UROGEN III) (EC 2.5.1.61) [1,46]. The host PBGD, also called hydroxymethylbilane synthase, is most highly expressed in the spleen and bone marrow in humans based on tissue-specific ESTs (Additional file 7) [47].Plasmodiumparasites utilize host haem synthesis proteins in their erythrocytic life cycle in addition to their own de novo pathway [48], however the host PBGD is much more efficient [46]. It could be expected, then, to see parasite PBGD up-regulated when the host enzyme is dysregulated, as in a splenectomized host, or in in vitro culture. Conversely, if erythropoiesis is stimulated in the bone marrow during malaria infection, host PBGD
may become up-regulated, decreasing the requirement of parasitede novosynthesis. Finally, oneSICAvargene (PKH_020570) was highly up-regulated in vitro in the schizonts (TP6), and less so in the ring-stage (TP1 and TP2) samples. While this could mean that thisSICAvar gene or encoded protein has a unique role for the para-site’s biology, the protein encoded by PKH_020570 was not identified in any blood-stage samples so far ana-lysed by LC-MS/MS. It is also intriguing that this gene was also found to be up-regulated in P. knowlesi in-fected RBCs from a splenectomized animal (manu-script in preparation).
Invasion and basic metabolic functions
The basic invasion, growth and multiplication mecha-nisms ofP. knowlesiparasitesin vivo,ex-vivoandin vitro are similarly efficient. In each case, within a similar time frame (25 to 33 hours), the merozoites effectively enter RBCs and transform through the trophozoite and schizont stages of development to produce progeny merozoites. As anticipated, transcripts representing genes encoding pro-teins known to be involved in the invasion of RBCs were similarly detected, reflecting common IDCs for both the ex vivoandin vitroparasite samples; e.g.apical membrane antigen 1[49],merozoite surface protein 3[50,51],rhoptry associated proteins [52], and reticulocyte binding protein homologs [53,54] (see Additional file 6 Panels 14–22). Merozoite surface protein 1 (PKH_072850) did exhibit an oscillating pattern over time in one of thein vitroreplicate experiments. All in all, while similarities were noted in many such comparisons, it remains possible that subtle differences and unnoticed temporal factors may make a big difference in the expression of various genes and the timely function of the encoded proteins. Small or subtle differences in transcript patterns detected may have an impact on protein expression and function, but overall the data are consistent with the fact that the ex vivo and in vitro-derived parasites efficiently invade and grow in rhesus RBCs. The differences in the timing of the blood-stage cycles, likely simply reflect the adjustment of the parasites from the synchronization procedures. It is also worth noting that similar transcript levels were found for genes with various basic metabolic functions. For example, 14-3-3andactintranscripts were detected at similar levels (Additional file 6, Panels 25–26). Genes annotated as encoding blood-stage membrane proteins and integral membrane proteins were also examined, and with the ex-ception of the SICAvar gene family (discussed below), found no significant differences (Additional file 6, Panels 23–24).
Epigenetic regulation
[image:12.595.57.292.88.297.2]It is important to know whetherPlasmodiumgenes that encode proteins involved in epigenetic regulation are
differentially expressed in vivo compared to in vitro culture, especially given increasing knowledge of the importance of epigenetic regulation in Plasmodium [55-59], including the specific role of epigenetic regu-lation originally attributed tovargene expression inP. falciparum [60,61]. Overall, genes encoding histone and histone-modifying proteins exhibited similar levels of expression throughout the IDCs in the parasites grownex vivoand in vitro. Interestingly, however,sir2 transcripts (PKH_122390) were more abundant in the late stages of ex vivo parasites compared to in vitro (Additional file 6, Panel 13). Further analysis is re-quired to determine if this difference in expression is critical for thein vivoexpression of SIR2 in relation to the specific regulation of the SICAvargene family and the up-regulated expression of many SICAvar tran-scripts in the ring-stage parasitesex vivo.
SICAvargene expression is dramatically down-regulated
in vitro
The normalized intensity values of SICAvar genes were inputted into the Cluster program and visualized with TreeView (Figure 7). These data clearly show that the
SICAvar gene family as a whole is down-regulated
when the iRBCs are grown in vitro.In the ex vivo cul-ture, the SICAvar gene IDs with the highest level of transcript expression demonstrated by the microarrays are PKH_050020 and PKH_072700/PKH_072710 (the latter two gene IDs represent a single SICAvar gene). These gene IDs were identified by LC-MS/MS for the P. knowlesiclone known as Pk1(A+), from which theP. knowlesi microarray oligonucleotides were based, but not for the Pk1(B+)1+ clone [30]. Also detected at a high level was PKH_113950, which is highly expressed in the Pk1(B+)1+ clone [30]. However, a recent BLAST search revealed that the PKH_113950 oligonucleotide probe hits another SICAvar gene, PKH_020270, with 100% identity.
It was also determined if SICA proteins could be de-tected in the in vitro cultured parasites using LC-MS/ MS and found only one unique peptide corresponding to one SICA protein (PKH_030540); this contrasts to a high level of expression of multiple SICA proteins in established clones from rhesus macaque infections [30]. These findings are comparable to what is observed when P. knowlesiSICA[−] blood-stage parasites are grown in a splenectomized rhesus monkey, in which case neither functional full-lengthSICAvartranscripts nor SICA pro-teins are observed [30]. It has been known that the pres-ence of the spleen is necessary for the expression and switching of SICA phenotypesin vivo[34], and that the spleen also has an apparent role in the expression of PfEMP1 encoded by the var genes and cytoadherence [62-64]. Whether only host splenic factors are critical
for the expression of the SICAvar gene family or also other host influences is unknown. Similar questions re-main valid with regards to the expression of the P. fal-ciparum var genes in vivo. The stage-specific ex vivo microarray data are consistent with published expression library screening and standard RT-PCR experiments showing that manySICAvar genes are expressed as tran-scripts in the ring stage of development, without any evi-dence for the predominant transcription of any particular SICAvartranscript(s) [28-30,65].
One possible interpretation of these microarray data with regard to antigenic variation is that the default state for SICAvar genes inP. knowlesi is ‘off’, and that there are host cues that turn them‘on’. The spleen is one pre-dicted source of these cues, since it has been shown that SICA protein expression at the surface of iRBCs is lost after passage in splenectomized hosts [34], and it has been shown quantitatively that the level ofSICAvar tran-scripts detectable in splenectomized hosts is minimal in comparison with intact hosts. Moreover, full-length SICAvar transcripts are not detected in RNA extracted from SICA[−] parasites [30].
Conclusions
This stage-specific microarray analysis shows a marked difference in gene expression betweenP. knowlesi blood-stage parasites derived from a rhesus monkey infection andP. knowlesiparasites adapted forin vitroculture. Most strikingly, expression of the SICAvar variant antigen genes, which are related to the P. falciparum var genes and associated with increased virulencein vivo[28,31,34] is up-regulated in theex vivocultures. Thus,in vitro cul-tures can provide a negative phenotype (in the“off state”) for SICAvar gene expression in comparison with ex vivo samples (in the“on state”), similar to what has been dem-onstrated in splenectomized hosts [30,34,63,66]. Ex vivo cultures would therefore be important for unraveling the molecular mechanisms that controlSICAvargene expres-sion and switching. Further investigations are required to evaluate what other genes may be implicated in the regu-lation of the SICAvar and potentially vargene family in the context of thein vivo host environment. Subsequent studies (Lapp, Chappel et al., personal communication) using RNA-Seq technologies will provide useful compari-sons to expand upon the findings reported here.
Additional files
Additional file 1:MA oligos.List of gene IDs and oligo sequences used in the analysis.
Additional file 2:Workflow.Data analysis workflow.
Additional file 3:PK4165genes_vivo_vitro.Data table of raw and centered intensities of the genes used for analysis.
Additional file 4:DE by stage.Differential expression of genes in
ex vivoandin vitroby time point.
Additional file 5:Phase.Phase correlation betweenex vivoand the twoin vitrotime courses.
Additional file 6:Panels showing comparative gene expression dynamics betweenex vivoandin vitrotime courses.
Additional file 7:ESTs of HMBS.Tissue-specific expression of HMBS in human.
Competing interests
The authors declare that they have no competing interests.
Authors’contributions
SL designed and carried out the time course experiments, participated in the data analysis, and wrote the manuscript. SM performed the microarray experiments and statistical analyses. LZ performed statistical analyses and participated in the writing of the manuscript. HW performed statistical analyses. PP participated in designing the microarrays and critically reviewed the manuscript. ZB designed the microarrays, participated in strategic discussions and guided analyses. MG conceived the experiments, analyzed the data, and wrote the manuscript. All authors read and approved the final manuscript.
Acknowledgements
This project was funded in part by Federal funds from the US National Institute of Allergy and Infectious Diseases, National Institutes of Health, Department of Health and Human Services under grant #R01-AI065961 and contract # HHSN272201200031C, and supported in part by the Office of Research Infrastructure Programs /OD P51OD011132 (formerly National Center for Research Resources P51RR000165), as well as National Medical Research Council (Singapore) grant no. NMRC/1292/2011. We would also like to thank Kevin Lee for critical review and discussion of this work.
Author details
1Emory Vaccine Center, Yerkes National Primate Research Center, Emory
University, Atlanta, GA, USA.2School of Biological Sciences, Nanyang Technological University, Singapore, Singapore.3Department of Biostatistics and Bioinformatics, Rollins School of Public Health, Emory University, Atlanta, GA, USA.4Department of Medicine, Division of Infectious Diseases, Emory University, Atlanta, GA, USA.
Received: 14 November 2014 Accepted: 12 February 2015
References
1. Aurrecoechea C, Brestelli J, Brunk BP, Dommer J, Fischer S, Gajria B, et al. PlasmoDB: a functional genomic database for malaria parasites. Nucleic Acids Res. 2009;37:D539–43.
2. Bozdech Z, Llinas M, Pulliam BL, Wong ED, Zhu J, DeRisi JL. The transcriptome of the intraerythrocytic developmental cycle ofPlasmodium falciparum. PLoS Biol. 2003;1:E5.
3. Llinas M, Bozdech Z, Wong ED, Adai AT, DeRisi JL. Comparative whole genome transcriptome analysis of threePlasmodium falciparumstrains. Nucleic Acids Res. 2006;34:1166–73.
4. Le Roch KG, Johnson JR, Florens L, Zhou Y, Santrosyan A, Grainger M, et al. Global analysis of transcript and protein levels across thePlasmodium falciparumlife cycle. Genome Res. 2004;14:2308–18.
5. Galinski MR, Meyer EV, Barnwell JW.Plasmodium vivax: modern strategies to study a persistent parasite’s life cycle. Adv Parasitol. 2013;81:1–26.
6. Le Roch KG, Chung DW, Ponts N. Genomics and integrated systems biology inPlasmodium falciparum: a path to malaria control and eradication. Parasit Immunol. 2012;34:50–60.
7. Mwangi JM, Ranford-Cartwright LC. Genetic and genomic approaches for the discovery of parasite genes involved in antimalarial drug resistance. Parasitology. 2013;140:1455–67.
8. Trager W, Jensen JB. Human malaria parasites in continuous culture. Science. 1976;193:673–5.
9. Zeeman AM, der Wel AV, Kocken CH.Ex vivoculture ofPlasmodium vivax
andPlasmodium cynomolgiandin vitroculture ofPlasmodium knowlesi
blood stages. Methods Mol Biol. 2013;923:35–49.
10. Moon RW, Hall J, Rangkuti F, Ho YS, Almond N, Mitchell GH, et al. Adaptation of the genetically tractable malaria pathogenPlasmodium knowlesito continuous culture in human erythrocytes. Proc Natl Acad Sci U S A. 2013;110:531–6.
11. Golenda CF, Li J, Rosenberg R. Continuousin vitropropagation of the malaria parasitePlasmodium vivax. Proc Natl Acad Sci U S A. 1997;94:6786–91.
12. Nguyen-Dinh P, Gardner AL, Campbell CC, Skinner JC, Collins WE. Cultivationin vitroof the vivax-type malaria parasitePlasmodium cynomolgi. Science. 1981;212:1146–8.
13. Noulin F, Borlon C, Van Den Abbeele J, D’Alessandro U, Erhart A. 1912–2012: a century of research onPlasmodium vivax in vitroculture. Trends Parasitol. 2013;29:286–94.
14. Udomsangpetch R, Kaneko O, Chotivanich K, Sattabongkot J. Cultivation of
Plasmodium vivax. Trends Parasitol. 2008;24:85–8.
15. Galinski MR, Barnwell JW.Plasmodium vivax: who cares? Malar J. 2008;7 Suppl 1:S9.
16. Pologe LG, Ravetch JV. Large deletions result from breakage and healing of
P. falciparumchromosomes. Cel. 1988;55:869–74.
17. LeRoux M, Lakshmanan V, Daily JP.Plasmodium falciparumbiology: analysis ofin vitroversusin vivogrowth conditions. Trends Parasitol. 2009;25:474–81. 18. Peters JM, Fowler EV, Krause DR, Cheng Q, Gatton ML. Differential changes
inPlasmodium falciparumvar transcription during adaptation to culture. J Infect Dis. 2007;195:748–55.
19. Zhang Q, Zhang Y, Huang Y, Xue X, Yan H, Sun X, et al. Fromin vivoto
in vitro: dynamic analysis ofPlasmodium falciparumvar gene expression patterns of patient isolates during adaptation to culture. PLoS One. 2011;6:e20591.
20. Fang J, Zhou H, Rathore D, Sullivan M, Su XZ, McCutchan TF. Ambient glucose concentration and gene expression inPlasmodium falciparum. Mol Biochem Parasitol. 2004;133:125–9.
21. Singh B, Kim Sung L, Matusop A, Radhakrishnan A, Shamsul SS, Cox-Singh J, et al. A large focus of naturally acquiredPlasmodium knowlesiinfections in human beings. Lancet. 2004;363:1017–24.
22. Galinski MR, Barnwell JW. Monkey malaria kills four humans. Trends Parasitol. 2009;25:200–4.
23. Hakimi H, Kawai S, Kawazu S. Molecular epidemiology of the emerging human malaria parasite“Plasmodium knowlesi”. Trop Parasitol. 2014;4:20–4. 24. Bannister LH, Butcher GA, Dennis ED, Mitchell GH. Studies on the structure and invasive behaviour of merozoites ofPlasmodium knowlesi. Trans R Soc Trop Med Hyg. 1975;69:5.
25. Aikawa M, Miller LH, Johnson J, Rabbege J. Erythrocyte entry by malarial parasites. A moving junction between erythrocyte and parasite. J Cell Biol. 1978;77:72–82.
26. Brown KN, Brown IN. Immunity to malaria: antigenic variation in chronic infections ofPlasmodium knowlesi. Nature. 1965;208:1286–8.
27. Howard RJ, Barnwell JW, Kao V. Antigenic variation ofPlasmodium knowlesi
malaria: identification of the variant antigen on infected erythrocytes. Proc Natl Acad Sci U S A. 1983;80:4129–33.
28. Al-Khedery B, Barnwell JW, Galinski MR. Antigenic variation in malaria: a 3’ genomic alteration associated with the expression of aP. knowlesivariant antigen. Mol Cell. 1999;3:131–41.
29. Corredor V, Meyer EV, Lapp S, Corredor-Medina C, Huber CS, Evans AG, et al. A SICAvar switching event inPlasmodium knowlesiis associated with the DNA rearrangement of conserved 3’non-coding sequences. Mol Biochem Parasitol. 2004;138:37–49.
30. Lapp SA, Korir-Morrison C, Jiang J, Bai Y, Corredor V, Galinski MR. Spleen-dependent regulation of antigenic variation in malaria parasites:
31. Korir CC, Galinski MR. Proteomic studies ofPlasmodium knowlesiSICA variant antigens demonstrate their relationship withP. falciparumEMP1. Infect Genet Evol. 2006;6:75–9.
32. Frech C, Chen N. Variant surface antigens of malaria parasites: functional and evolutionary insights from comparative gene family classification and analysis. BMC Genomics. 2013;14:427.
33. Kyes S, Pinches R, Newbold C. A simple RNA analysis method shows var and rif multigene family expression patterns inPlasmodium falciparum. Mol Biochem Parasitol. 2000;105:311–5.
34. Barnwell JW, Howard RJ, Coon HG, Miller LH. Splenic requirement for antigenic variation and expression of the variant antigen on the erythrocyte membrane in clonedPlasmodium knowlesimalaria. Infect Immun. 1983;40:985–94.
35. Pain A, Bohme U, Berry AE, Mungall K, Finn RD, Jackson AP, et al. The genome of the simian and human malaria parasitePlasmodium knowlesi. Nature. 2008;455:799–803.
36. Lambros C, Vanderberg JP. Synchronization ofPlasmodium falciparum
erythrocytic stages in culture. J Parasitol. 1979;65:418–20. 37. Peng J, Elias JE, Thoreen CC, Licklider LJ, Gygi SP. Evaluation of
multidimensional chromatography coupled with tandem mass
spectrometry (LC/LC-MS/MS) for large-scale protein analysis: the yeast prote-ome. J Proteome Res. 2003;2:43–50.
38. Mok S, Imwong M, Mackinnon MJ, Sim J, Ramadoss R, Yi P, et al. Artemisinin resistance inPlasmodium falciparumis associated with an altered temporal pattern of transcription. BMC Genomics. 2011;12:391.
39. Subramanian A, Tamayo P, Mootha VK, Mukherjee S, Ebert BL, Gillette MA, et al. Gene set enrichment analysis: a knowledge-based approach for interpreting genome-wide expression profiles. Proc Natl Acad Sci U S A. 2005;102:15545–50.
40. Tachibana SI, Sullivan SA, Kawai S, Nakamura S, Kim HR, Goto N, et al.
Plasmodium cynomolgigenome sequences provide insight intoPlasmodium vivaxand the monkey malaria clade. Nat Genet. 2012;44:1051–5.
41. Smyth GK. limma: Linear Models for Microarray Data. In: Gentleman R, Carey V, Huber W, Irizarry R, Dudoit S, editors. Bioinformatics and Computational Biology Solutions Using R and Bioconductor. New York: Springer; 2005. p. 397–420. Statistics for Biology and Health.
42. Coffey N, Hinde J. Analyzing time-course microarray data using functional data analysis - a review. Stat Appl Genet Mol Biol. 2011;10:10–32. 43. Kanehisa M, Goto S, Kawashima S, Okuno Y, Hattori M. The KEGG resource
for deciphering the genome. Nucleic Acids Res. 2004;32:D277–80. 44. Malaria Parasite Metabolic Pathways. [http://sites.huji.ac.il/malaria/] 45. Ashburner M, Ball CA, Blake JA, Botstein D, Butler H, Cherry JM, et al. Gene
ontology: tool for the unification of biology. The Gene Ontology Consortium. Nat Genet. 2000;25:25–9.
46. Nagaraj VA, Arumugam R, Gopalakrishnan B, Jyothsna YS, Rangarajan PN, Padmanaban G. Unique properties ofPlasmodium falciparum
porphobilinogen deaminase. J Biol Chem. 2008;283:437–44.
47. Liu X, Yu X, Zack DJ, Zhu H, Qian J. TiGER: a database for tissue-specific gene expression and regulation. BMC Bioinformatics. 2008;9:271.
48. Nagaraj VA, Sundaram B, Varadarajan NM, Subramani PA, Kalappa DM, Ghosh SK, et al. Malaria parasite-synthesized heme is essential in the mosquito and liver stages and complements host heme in the blood stages of infection. PLoS Pathog. 2013;9:e1003522.
49. Thomas AW, Narum D, Waters AP, Trape JF, Rogier C, Goncalves A, et al. Aspects of immunity for the AMA-1 family of molecules in humans and non-human primates malarias. Mem Inst Oswaldo Cruz. 1994;89 Suppl 2:67–70.
50. Hudson DE, Miller LH, Richards RL, David PH, Alving CR, Gitler C. The malaria merozoite surface: a 140,000 m.w. protein antigenically unrelated to other surface components onPlasmodium knowlesimerozoites. J Immunol. 1983;130:2886–90.
51. Jiang J, Barnwell JW, Meyer EV, Galinski MR.Plasmodium vivaxmerozoite surface protein-3 (PvMSP3): expression of an 11 member multigene family in blood-stage parasites. PLoS One. 2013;8:e63888.
52. Counihan NA, Kalanon M, Coppel RL, de Koning-Ward TF.Plasmodiumrhoptry proteins: why order is important. Trends Parasitol. 2013;29:228–36.
53. Meyer EV, Semenya AA, Okenu DM, Dluzewski AR, Bannister LH, Barnwell JW, et al. The reticulocyte binding-like proteins ofP. knowlesilocate to the micronemes of merozoites and define two new members of this invasion ligand family. Mol Biochem Parasitol. 2009;165:111–21.
54. Semenya AA, Tran TM, Meyer EV, Barnwell JW, Galinski MR. Two functional reticulocyte binding-like (RBL) invasion ligands of zoonoticPlasmodium knowlesiexhibit differential adhesion to monkey and human erythrocytes. Malar J. 2012;11:228.
55. Duffy MF, Selvarajah SA, Josling GA, Petter M. Epigenetic regulation of the
Plasmodium falciparumgenome. Brief Funct Genomics. 2014;13:203–16. 56. Gupta AP, Chin WH, Zhu L, Mok S, Luah YH, Lim EH, et al. Dynamic
epigenetic regulation of gene expression during the life cycle of malaria parasitePlasmodium falciparum. PLoS Pathog. 2013;9:e1003170. 57. Cui L, Miao J. Chromatin-mediated epigenetic regulation in the malaria
parasitePlasmodium falciparum. Eukaryot Cell. 2010;9:1138–49. 58. Hoeijmakers WA, Salcedo-Amaya AM, Smits AH, Francoijs KJ, Treeck M,
Gilberger TW, et al. H2A.Z/H2B.Z double-variant nucleosomes inhabit the AT-rich promoter regions of thePlasmodium falciparumgenome. Mol Microbiol. 2013;87:1061–73.
59. Cortes A, Carret C, Kaneko O, Yim Lim BY, Ivens A, Holder AA. Epigenetic silencing ofPlasmodium falciparumgenes linked to erythrocyte invasion. PLoS Pathog. 2007;3:e107.
60. Voss TS, Tonkin CJ, Marty AJ, Thompson JK, Healer J, Crabb BS, et al. Alterations in local chromatin environment are involved in silencing and activation of subtelomeric var genes inPlasmodium falciparum. Mol Microbiol. 2007;66:139–50.
61. Petter M, Lee CC, Byrne TJ, Boysen KE, Volz J, Ralph SA, et al. Expression of
P. falciparumvar genes involves exchange of the histone variant H2A.Z at the promoter. PLoS Pathog. 2011;7:e1001292.
62. Hommel M, David PH, Oligino LD. Surface alterations of erythrocytes in
Plasmodium falciparummalaria. Antigenic variation, antigenic diversity, and the role of the spleen. J Exp Med. 1983;157:1137–48.
63. Munasinghe A, Ileperuma M, Premawansa G, Handunnetti S, Premawansa S. Spleen modulation of cytoadherence properties ofPlasmodium falciparum. Scand J Infect Dis. 2009;41:538–9.
64. Pongponratn E, Viriyavejakul P, Wilairatana P, Ferguson D, Chaisri U, Turner G, et al. Absence of knobs on parasitized red blood cells in a
splenectomized patient in fatal falciparum malaria. Southeast Asian J Trop Med Public Health. 2000;31:829–35.
65. Galinski MR, Corredor V. Variant antigen expression in malaria infections: posttranscriptional gene silencing, virulence and severe pathology. Mol Biochem Parasitol. 2004;134:17–25.
66. Barnwell JW, Howard RJ, Miller LH. Altered expression ofPlasmodium knowlesivariant antigen on the erythrocyte membrane in splenectomized rhesus monkeys. J Immunol. 1982;128:224–6.
Submit your next manuscript to BioMed Central and take full advantage of:
• Convenient online submission
• Thorough peer review
• No space constraints or color figure charges
• Immediate publication on acceptance
• Inclusion in PubMed, CAS, Scopus and Google Scholar
• Research which is freely available for redistribution