The microstructural and metamorphic history preserved within garnet porphyroblasts from southern Vermont and northwestern Massachusetts
21
0
0
Full text
(2) Volume II. A-1. SECTION A. The orientation of textural discontinuities in garnets with complex spiral inclusion trails.
(3) Volume II. A-2. List of Tables and Figures. Table A-1: Trend and plunge of Foliation Intersection/Inflection Axes (FIAs) for selected samples.. A-3. Figure A-1: Diagram showing how curved inclusion trails can be produced without porphyroblast rotation.. A-4. Figure A-2: Diagram showing how orthogonal foliations can be produced.. A-5. Figure A-3: Diagram showing examples of textural discontinuities.. A-7. Figure A-4: Diagram showing how textural discontinuities can form in a rotating porphyroblast and a non-rotating porphyroblast. Figure A-5: Diagram of a rhombododecahedron, a common garnet crystal form.. A-8 A-9. Figure A-6: Map showing the location of samples mentioned in the text.. A-10. Figure A-7: Equal area rose diagrams showing the pitch of discontinuities.. A-11.
(4) Volume II. A-3. Table A-1: Trend and plunge of Foliation Intersection/Inflection Axes (FIAs) for selected samples. For samples with more than one FIA the trend and plunge shown are for the core FIA.. Sample. Trend. Plunge. BG7 BG19 BG33 BG46 BG48 BG50 BG59 BG94 BG102B. 065 095 045 215 175 160 075 035 165. 25 15 15 15 15 25 25 15 45.
(5) Volume II. A-4. Figure A-1: Diagram showing how curved inclusion trails can be produced without porphyroblast rotation. A: Progressive flattening with simultaneous growth of porphyroblasts can produce curved inclusion trails with up to 90° of apparent rotation. Differential flattening around porphyroblasts results in curvature of the surrounding schistosity and as the crystals increase in size they preserve the curved foliation as sigmoidal inclusion trails (after Ramsay, 1962). B: Spiral inclusion trails with more than 90° apparent rotation can be produced by the episodic overgrowth of successive foliations. In this example, based on a real garnet porphyroblast, the first stage of growth occurs in the crenulation hinge of a horizontal foliation. Inclusion trails curve smoothly into matrix where protected by garnet edge (top left), while others are truncated (bottom edge). The second stage of garnet growth occurs in the crenulation hinge of a vertical foliation and the third stage of garnet growth in crenulation hinge of a horizontal foliation, creating a complex spiral inclusion trail with 270° of apparent rotation. (Modified from Bell et al., 1992, Figure 6).
(6) Volume II. A-5.
(7) Volume II. A-6. Figure A-2: Diagram showing how orthogonal foliations can be produced. A: Production of orthogonal foliations by the passage of thrust sheets over flats and ramps. (i) A gently dipping foliation forms when thrusting occurs across a nearly horizontal surface. (ii) A steeply dipping foliation forms when the rocks move over a ramp and undergo layer-parallel shortening. B: Production of orthogonal foliations by orogenic collapse (Modified from Bell and Johnson, 1989, figure 24). (i) Crustal compression causes horizontal shortening and vertical thickening of the crust associated with a steeply dipping foliation. This causes gravitational sliding off the crown and extension in the uppermost levels. (ii) Collapse of the over-thickened crust and gravitational spreading due to gravitational instability of the thickened pile. Localised zones of high shear strain form within the collapsing pile producing horizontal foliations. C: Production of orthogonal foliations by back-rotation of crenulation hinges (Modified from Johnson 1999, figure 8). (i) A porphyroblast overgrows an early foliation, preserving it as inclusion trails. (ii) During crenulation cleavage development there is ‘back-rotation’ of the crenulation hinges, relative to the crenulation limbs, and the crenulation hinges eventually become orthogonal to the developing cleavage seams. The porphyroblast rotates with the crenulation hinges so that the porphyroblast inclusion trails also end-up orthogonal to the crenulation cleavage..
(8) Volume II. Figure A-3: Diagram showing examples of textural discontinuities. A: Sketch of a garnet porphyroblast to illustrate the two main types of textural discontinuity. B: Photomicrographs of garnet porphyroblasts from one vertical thin-section from sample BG62. C: Interpretive line drawings showing inclusion trails (dashed lines) and textural discontinuities (bold lines) for the porphyroblasts from sample BG62. D: Photomicrographs of garnet porphyroblasts from one vertical thin-section from sample BG15A. E: Interpretive line drawings showing inclusion trails (dashed lines) and textural discontinuities (bold lines) for the porphyroblasts from sample BG15A.. A-7.
(9) Volume II. A-8. Figure A-4: Diagram showing how textural discontinuities can form in a rotating porphyroblast and a non-rotating porphyroblast (After Johnson, 1993). A: Initial porphyroblast growth and rotation creates a smoothly curving inclusion trail then growth stops. If rotation continues zones of sharp curvature, and ultimately truncations, form between the inclusion trails and the external foliation. If rotation stops at the same time growth stops continued deformation and foliation development might create sharp truncations between the inclusion trails and the external foliation. B: Garnet growth initiates when crenulation cleavage development begins. The porphyroblast grows in a crenulation hinge and includes the curved foliation. At a certain point porphyroblast growth stops because the porphyroblast is unable to grow out over the crenulation limb where active shearing and dissolution is taking place. Continued crenulation cleavage development results in a zone of differentiation between the inclusion trails and the external foliation. Further crenulation cleavage development results in a pervasive foliation that wraps around the porphyroblast and truncates the inclusion trails. In all cases further porphyroblast growth is needed to preserve the textural discontinuity..
(10) Volume II. A-9. Figure A-5: Diagram of a rhombododecahedron, a common garnet crystal form. A: A perfect rhombododecahedron has 12 identical rhombic faces and a dihedral angle of 120°. Like a cube it has three fourfold axes of symmetry, four threefold axes, and six twofold axes. B: When viewed along a fourfold axis of symmetry the rhombododecahedron appears square in profile. If the crystal were rotated around this axis it would rotate in 90° increments. C: When viewed along a threefold axis of symmetry the rhombododecahedron appears hexagonal in profile. If the crystal were rotated around this axis it would rotate in 60° increments..
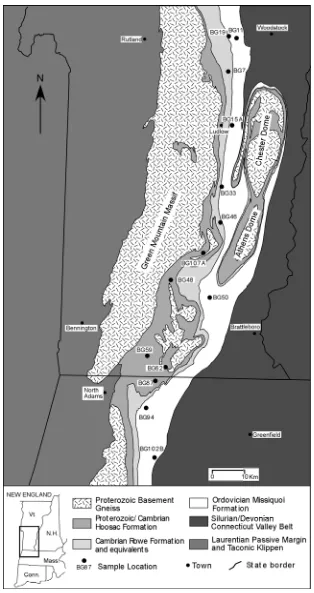
(11) Volume II. Figure A-6: Map showing the location of samples mentioned in the text. Regional geology based on Doll et al. (1961) and Zen et al. (1983).. A-10.
(12) Volume II. A-11. Figure A-7: Equal area rose diagrams showing the pitch of discontinuities. Zero is horizontal and 90 degrees is vertical. For each sample measurements were made from between 8 and 12 vertical thin-sections with different strikes..
(13) Volume II. B-1. SECTION B. Foliation Intersection/Inflection Axes in garnet porphyroblasts and the relationship between garnet growth and deformation.
(14) Volume II. B-2. List of Tables and Figures. Table B-1: FIA orientation and allocated FIA set for each sample.. B-3. Table B-2: FIA orientations and allocated FIA sets for multi-FIA samples of Bell and Hickey (1997) and Bell et al. (1998). Figure B-1: Map showing the location of samples.. B-4 B-5. Figure B-2: Equal-area rose diagrams showing total FIA data from southern Vermont and north-western Massachusetts.. B-6. Figure B-3: Diagram showing the sequence of FIAs preserved from the core to rim in multi-FIA samples. Figure B-4: Rose diagrams and maps showing the spatial distribution of FIA sets.. B-7 B-8.
(15) Volume II. B-3. Table B-1: FIA orientation and allocated FIA set for each sample. For multi-FIA samples the core FIA is listed first, followed by the median FIA (if present) and the rim FIA. (a) Single FIA data Sample Number. FIA Orientation. Continuous with matrix. FIA Set. Sample Number. FIA Orientation. Continuous with matrix. FIA Set. BG3 BG4 BG6 BG7 BG8 BG9 BG11 BG13 BG14 BG17 BG19 BG20 BG24 BG30 BG33 BG35 BG38 BG40 BG41A BG42 BG43 BG44 BG45 BG46 BG47 BG48. 145 005 165 065 160 015 165 015 155 045 095 025 155 175 045 155 025 175 175 105 075 145 160 035 025 175. No Yes Yes Yes No Yes Yes Yes Yes Yes Yes Yes Yes Yes Yes Yes Yes Yes Yes No Yes Yes Yes Yes Yes No. 3 3.5 3 2 3 3.5 3 3.5 3 4 2 4 3 3.5 4 3 4 3.5 3.5 2 2 3 3 4 4 3.5. BG50 BG51 BG52 BG53 BG54 BG55 BG56 BG57B BG58B BG59 BG66B BG69 BG70 BG71 BG72 BG78 BG80 BG81 BG83 BG84A BG85 BG86 BG88 BG94 BG102B BG107A. 160 155 025 015 175 015 035 175 035 075 145 015 075 175 030 025 155 175 155 045 175 005 075 035 165 140. No Yes Yes No No No Yes No No No No Yes Yes Yes No Yes No Yes No Yes Yes Yes Yes Yes Yes No. 3 3 4 3.5 3.5 3.5 4 3.5 1 2 3 3.5 2 3.5 1 4 3 3.5 3 4 3.5 3.5 2 4 3 3. BG49. 155. Yes. 3. (b)Multi FIA data Sample Number. FIA Orientations. BG15A 070 - 010 BG21 125 - 155 BG32 065 - 180 BG60 015 - 045 BG62 005 - 045 BG87 050 - 030 BG104 145 - 175 BG105A 145 - 175 BG108 090 - 145 - 175. Continuous with matrix. FIA Sets. Yes Yes Yes Yes Yes Yes No Yes No. 2 - 3.5 0-3 2 - 3.5 3.5 - 4 3.5 - 4 1-4 3 - 3.5 3 - 3.5 2 - 3 - 3.5.
(16) Volume II. B-4. Table B-2: FIA orientations and allocated FIA sets for multi-FIA samples of Bell and Hickey (1997) and Bell et al. (1998). Data is from Bell et al. (1998) Table 3 and Table 8. The core FIA is listed first, followed by the median FIA (if present) and the rim FIA.. Sample Number. FIA Orientations. FIA Sets. v200A v209 v212E v213 v214 v443C v444B v450A v450B v203 v257 v261A v261C v360 v436A v436D. 161-011 031 - 096 046 - 021 111 - 011 091 - 176 091 - 001 061 - 086 165 - 009 176 - 001 - 011 171 - 001 - 011 036 - 166 026 - 161 041 - 141 071 - 171 - 016 156 - 001 - 011 101 - 151. 3-4 1-2 1-4 2-4 2-3 2-4 1-2 3-4 3-4-4 3-4-4 1-3 1-3 1-3 2-3-4 3-4-4 2-3. Sample Number. FIA Orientations. FIA Sets. v438 v447A v447B v3 v17A v300A v334 v338A v375B v384A v384B v396 v413A v453A v458A. 167 - 017 101 - 011 156 - 161 - 176 016 - 161 091 - 156 086 - 016 156 - 171 166 - 011 161 - 006 086 - 016 081 - 016 176 - 021 - 036 146 - 156 151 - 021 086 - 146. 3-4 2-4 3-3-3 1-3 2-3 2-4 3-3 3-4 3-4 2-4 2-4 3-4 3-3 3-4 2-3.
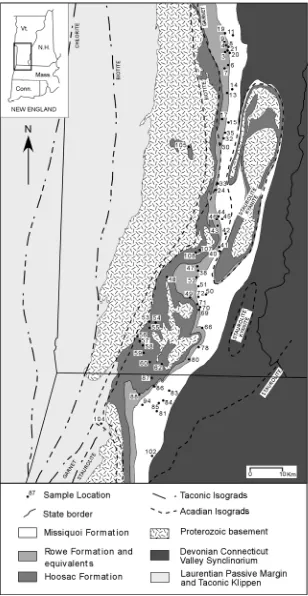
(17) Volume II. B-5. Figure B-1: Map showing the location of samples mentioned in the text. Regional geology based on Doll et al. (1961) and Zen et al. (1983). Taconic and Acadian isograds after Sutter et al. (1985)..
(18) Volume II. B-6. Figure B-2: Equal-area rose diagrams showing total FIA data from southern Vermont and north-western Massachusetts. The boundaries of the FIA sets are shown around the outside of the diagrams. A: Data from this study. B: Data from Bell et al. (1998)..
(19) Volume II. B-7. Figure B-3: Diagram showing the sequence of FIAs preserved from the core to rim in multi-FIA samples. A: Data from this study. B: Data from Bell et al. (1998)..
(20) Volume II. B-8.
(21) Volume II. B-9. Figure B-4: Rose diagrams and maps showing the spatial distribution of FIA sets 1-4. For each sample the orientation of the rectangle indicates the orientation of the core FIA from that location. Where there has been more than one phase of growth the core growth is indicated by a black rectangle, or a white rectangle with a black border, and the median and/or rim growth is indicated by a dark grey rectangle. For geological unit names and sample numbers refer to Figure B-1. A: FIA sets 1 (white rectangles with black border) and 4 (black rectangles). B: FIA set 2 C: FIA set 3 D: FIA set 3.5.
(22)
Figure


+4


Related documents
The additional analysis has established that the most important component for distributors encompasses following quality characteristics: (1) coffee inventory
School of Public Health and Tropical Medicine, James Cook University (Cairns) and ARC Fellow, Centre for Aboriginal Economic Policy Research (Australian National University),
proyecto avalaría tanto la existencia de una demanda real e insatisfe- cha de este servicio por parte de la población titular de derechos como la capacidad de ambos
It was decided that with the presence of such significant red flag signs that she should undergo advanced imaging, in this case an MRI, that revealed an underlying malignancy, which
Experiments were designed with different ecological conditions like prey density, volume of water, container shape, presence of vegetation, predator density and time of
19% serve a county. Fourteen per cent of the centers provide service for adjoining states in addition to the states in which they are located; usually these adjoining states have
The objective of this study was to develop Fourier transform infrared (FTIR) spectroscopy in combination with multivariate calibration of partial least square (PLS) and
FESTA has several advantages over other methods for assessing walking activity; it can measure different gait parameters such as number of steps, mean-step-length, distance and
