VISUAL FUNCTIONS IN CHILDREN AND YOUNG
ADULTS WITH REFRACTIVE ERRORS
DISSERTATION SUBMITTED TO
THE TAMIL NADU Dr. M.G.R. MEDICAL UNIVERSITY CHENNAI – 600 032, INDIA
M.S. DEGREE EXAMINATION
BRANCH – III OPHTHALMOLOGY
ENDORSEMENT BY THE HEAD OF THE INSTITUTION
This is to certify that the dissertation entitled
“VISUAL
FUNCTIONS IN CHILDREN AND YOUNG ADULTS WITH
REFRACTIVE ERRORS”
is a bonafide work done by
Dr. L.K.LALI,
M.B.B.S., D.O., postgraduate student in M.S (Ophthalmology)
during
JUNE 2014 to MARCH 2016,
under the guidance of
Dr. TANUJA
BRITTO, M.S., D.O.,
Professor and HOD, Department of Low Vision,
Joseph Eye Hospital, Trichy, in partial fulfillment for the award of M.S
degree in Ophthalmology for the Tamil Nadu Dr. M.G.R. Medical
University, Chennai.
Prof. Dr. C.A.NELSON JESUDASAN, M.S, D.O.M.S.,
Professor and Head of the Institution
Institute of Ophthalmology,
CERTIFICATE
This is to certify that the dissertation entitled
“VISUAL
FUNCTIONS IN CHILDREN AND YOUNG ADULTS WITH
REFRACTIVE ERRORS”
is a bonafide work done by
Dr. L.K.LALI,
M.B.B.S., D.O., postgraduate student in M.S (Ophthalmology)
during
JUNE 2014 to MARCH 2016,
under the guidance of
Dr. TANUJA
BRITTO, M.S., D.O.,
Professor and Director,Institute of Ophthalmology,
Joseph Eye Hospital, Trichy, in partial fulfillment for the award of M.S
degree in Ophthalmology for the Tamil Nadu Dr. M.G.R. Medical
University, Chennai.
Dr. TANUJA BRITTO, M.S, D.O.,
DECLARATION BY THE CANDIDATE
I,
Dr. L.K.LALI, M.B.B.S.,D.O.,
solemnly declare that the
dissertation entitled
“VISUAL FUNCTIONS IN CHILDREN AND
YOUNG ADULTS WITH REFRACTIVE ERRORS
” has been prepared
by me, under the direct guidance of
Dr. TANUJA BRITTO, M.S., D.O.,
Professor and HOD, Department of Low Vision, Joseph Eye Hospital,
Trichy, and
Dr. B. ANTONY AROCKIADASS, M.S.,
Assistant
Professor, Department of Pediatric Ophthalmology, Joseph Eye Hospital,
Trichy, during the period from August 2014 to May 2015,
in partial
fulfillment for the award of
M.S Degree in Ophthalmology
for the
Tamilnadu
Dr. M.G.R., Medical University
, Chennai.
I have not submitted this work previously to this or any other
university for the award of any Degree or Diploma.
Place: Trichy
Date:
Dr. L.K.LALI, M.B.B.S., D.O.
(Reg.No.221413404)
ACKNOWLEDGEMENT
I have immense pleasure in expressing my heartfelt gratitude and sincere thanks to Dr. C.A. Nelson Jesudasan, Professor and Director, Institute of Ophthalmology, Joseph Eye Hospital, Trichy for this study for giving me the opportunity to work under his expert guidance to me to complete this study.
I would specially thank Dr Philip Thomas, who has been a role model to me in that while he is a true scientist in search for answers, he has in him the compassion and the humane touch that is such an important part of medicine. I thankfully acknowledge his guidance and support, without which this study may not have been possible.
I wish to place on record my deep gratitude to Dr Tanuja Britto, Professor and head of department of Low vision and pediatric ophthalmology and my guide, for all the help and encouragement at every step of the way. Her dynamism, patience and competence were an unfailing source of inspiration to me.
I would specially thank Dr. Antony Arokiadoss, Asst. Professor of Pediatric Ophthalmology and my co-guide,for his valuable guidance and advice, without which this study may not have been possible. I feel blessed to have such a mentor who has guided me with patience and sincerity.
I am extremely grateful to Dr. Kaliyamurthy, for his help in the preparation of this dissertation.
I would like to thank L.Princy, for her support and helping me to do this study.
I am grateful to Mr. R. Venkatraman, Mr. B.E. Rajkumar and Mr. Daniel Prince, for their help in completion of this study.
I am extremely grateful to all my patients and their parents who consented to participate in this study and made its completion possible.
INTRODUCTION
The World Health Organisation (WHO) and VISION 2020 report states
that uncorrected refractive errors (43%), unoperated cataract (33%), and
glaucoma (2%), are the important causes of blindness and low vision globally.
Of these, refractive errors has been identified as one of the main cause of visual
impairment in children and young adults, leading to drastically reduced
productivity, educational opportunities and quality of life.1
Normal visual functioning depends not only on patient's visual acuity but
also on many other parameters, such as the visual fields, perception of colour,
contrast and visual skills2. Clinically, objective measurements, such as those of
acuity or the visual fields, provide an assessment of a patient’s visual status but
do not reflect the degree of visual impairment that the patient experiences in his
or her daily activities, sufficiently.
It has been documented that there is no correlation between subjective
complaints and objective measurements of difficulty in patients with visual
impairment3. There is a paucity of literature on how functional visual
performance improves with correction of refractive errors. The improvement of
visual functions after correction of refractive error has been inferred based on
improvement in visual acuity only.
In general, visual impairment and low vision affects the visual
functioning of a person in areas like orientation and mobility, in day-to-day
such as reading4. The effect on these four areas depends on the type and degree
of impairment. Visual impairment also affects various aspects of life which
include a person's educational status, occupation and leisure activities.
Impairment of vision affects the quality of life which is related to health,
and affects the daily activities of life, including social activities (Elliot AF,
2009). The efficacy of interventions should be validated by patient's visual
functions and by assessing visual or impact of visual impairment on daily
activities.5
Children and young adults with low vision have different needs from that of
their peers, necessitating residual vision enhancement. Residual vision can be
enhanced by thorough clinical assessment and correction of refractive errors by
glasses or contact lenses6. These patients should also be trained to use optical
and non-optical aids if needed, through adaptation of environment and teaching
methods. This is very important especially in children, because any delay in
development of visual skills will affect their education. Early referral and
intervention have great potential to impact on visual outcome as well as on
participation in family, school and community life.
The current study was done to identify the differences in visual functions
like visual acuity, contrast sensitivity, colour vision, stereopsis, visual fields etc.
in patients with refractive errors between individuals with normal best corrected
visual acuity and individuals suffering from visual impairment This study also
aimed to document the improvements in subjective and objective visual
AIM OF THE STUDY
To evaluate visual functions and visual performance in children and
young adults, aged 5-30 years with refractive errors, and the effectiveness of
ophthalmological interventions on functional visual skills like reading and
writing.
SPECIFIC OBJECTIVES OF THIS DISSERTATION
a) To document refractive errors in patients aged 5-30 years,
b) To assess the visual functions in patients with refractive errors and
compare these between two groups, namely
o Group1, with a best -corrected visual acuity better than or equal to
6/18.
o Group 2, with a best-corrected visual acuity worse than 6/18.
c) To compare the visual functions among the subgroups in Group 1 and
Group 2,
o Subgroup 1A, with BCVA ≥ 6/18 presenting for the first time.
o Subgroup 1B, with BCVA ≥ 6/18 already using interventions
o Subgroup 2A, with BCVA < 6/18 presenting for the first time.
o Subgroup 2B, with BCVA< 6/18 already using interventions.
d) To provide necessary optical correction and ophthalmological
interventions on the study patients; and
e) To document the effect of interventions on visual status of patients
REVIEW OF LITERATURE
According to the WHO (2011), Low Vision is defined as the best
corrected visual acuity (BCDV) less than 6/18 to light perception or visual field
of less than 10 degree in the better eye after the best possible correction7.
According to WHO (2012) estimates, approximately 285 million people
across the world live with low vision and blindness. Out of this estimation, 39
million people are blind and 246 million live with moderate to severe visual
impairment. Of the latter, 145 million of the visually impaired people suffer
from uncorrected refractive errors, where restoration of normal vision can be
done with the help of optical devices such as spectacles7.
In the 1260s, Marco Polo, who was an explorer, found that aged people in
China were reading with the help of lenses which magnified the images. Four
hundred years later, Descartes invented similar lenses in France. George
Hellinger developed a program on low vision aids which were mainly optical in
the Industrial Home for the Blind which is situated in the city of New York, in
the 1950s. This was done 300 years after Descartes invention, and is known as
Helen Keller Services for the Blind8.Later, Gerald Fonda and Eleanor Faye,
coined the term "low vision" 9.
The definition given by the Parliament of Britain in 1893 described
blindness as "that level of visual impairment which prevents children from
Von Rohr, in 1918, was responsible for designing a telescopic lens for Zeiss,
and after this, the use of prisms for hemianopia were introduced10 (Baunschnig,
1922). The working principles of low vision aids were conceptualised by about
1930s and the micro lens was introduced about 20 years later. In 1954, the first
presentation of aids for the low vision people was organised by the International
Congress of Ophthalmologists11 (Goodrich & Arditi, 2000) and about 10 years
later, a closed- circuit television was introduced first by the RAND
Corporation12 (Genensky, 1969). Visual aid techniques in the rehabilitation of
low vision people, which include computers, is developing at a fast rate.
Magnitude of problem of low vision
Patient with low vision is one, who has impaired visual functions even
after treatment, for example, after surgery in the eye or by refractive correction
glasses/contact lenses. Such an individual has reduced visual acuity13 i.e. less
than 6/18 to light perception or a visual field of less than 10 degrees, but the
patient is potentially able to use, vision for the planning or completion of a
task13. Patients with low vision require special care and attention in their
education and continuing eye care, in order to prevent further deterioration of
their vision. Children with low vision are also in a complicated position from a
socioeconomic point of view because they are not blind enough to be permitted
to rehabilitation and social services. They also do not have enough sight to lead a
life with good visual functions.
Visual disturbances that can be reported by patients are dimness of vision
abnormal sensitivity to light, colour distortions, field defects, night blindness,
difficulties in dark adaptation, entoptic images- floaters/ flashes of light, reduced
contrast sensitivity, asthenopia- eye strain and mental disturbances due to
reduction in vision.
The major causes of low vision in young adults in developing countries
are predominantly infective and nutritional causes. The other various ocular
conditions that might lead to impairment of visual acuity are refractive errors
like myopia/ hypermetropia/ astigmatism, cataract- developmental or traumatic,
glaucoma- infantile or adult, corneal scars, degenerative myopia14 etc.
Low vision is characterised by changes in visual functions such as
decreased visual acuity, stereo acuity, contrast sensitivity, brightness perception,
abnormal contour interaction. These visual functions can be reduced even in
people with normal vision and are highly compromised in low vision1. These
visual parameters determine the quality of vision that are used in daily tasks such
as reading and writing, especially in the school and college years.
Amblyopia is one of the preventable cause of low vision. In amblyopia,
the visual acuity is reduced. Interestingly, patients with amblyopia have
improvement in the visual acuity by one or two lines when examined through a
neutral density filter but patients with organic lesions have further worsening of
visual acuity. Second, patients with amblyopia have reduced visual acuity when
examined with multiple letters in the charts than by using single letter charts and
Snellen's distant visual acuity testing chart, which was developed by
Herman Snellen in 1865, was an inexpensive and easy method to test acuity and
was easily available and was accepted legally. The largest letter in the chart
denoted a distance acuity of 20/200; any patient reading lesser than the first line
was considered as severe visual impairment or legal blindness. This was because
the Snellan acuity chart had only one letter "E" in the first line and it measure a
distance vision of 20/200, the next two letters in the subsequent line represented
the next level of vision (20/100). Thus it has been discovered that the Snellen's
chart is not a valid test to assess the functional level of vision.
The first standardized chart for testing distant vision with Meter (M)
notation was developed in the early 1950s, followed by the logMAR chart which
was used in the 1970s. The chart was designed by Ian Bailey and Jan E Lovie-
Kitchen at the National Vision Research Institute of Australia. The term
"LogMAR" is derived from word Logaritham of the Minimum Angle of
Resolution. The sizes of the letters in LogMAR chart progresses systemically in
from one line to other line in geometric proportion. The size of the letter in each
line is given as the logarithm to the base 10 of decimal visual acuity, so the 6/6
(20/20) line is LogMAR 0.00 The space between two lines and two letters will
also change in proportion keeping the contour constant. For this reason it has
been recommended that whenever visual acuity is measured, the logMAR chart
is commonly used, particularly for research purposes16. (Bailey I L, Lovie J E,
Visual acuity is recorded by using the LogMAR chart in the following
manner. Each letter has 0.02 log units score value. Since there are 5 letters per
line, the total score for a line on the LogMAR chart represents a change of 0.1
log units for a line. The score is calculated as LogMAR visual acuity (VA) =0.1+
LogMAR value of the best line read-0.02 (number of letters read).
The advantages of LogMAR over other charts are that there are an equal
number of letters per line, there is regular spacing between lines and letters,
there is uniform progression in letter size and the final score is based precisely
on the total of all letters read16 (Bailey I L, Lovie J E, 1976).
Once the examiner has established the person's visual acuity for distance,
it is important to measure visual acuity at near. It can be measured with word or
text charts, characters, shapes or numbers. Near vision charts commonly used are
meter (M) notation, reduced Snellen and Jaeger's charts.
Colour vision can be tested clinically by several devices, including
Ishihara's pseudo- isochromatic plates, FM 100 Hue test, FM D15 Hue test and
the anomaloscope. Based on Online Farnsworth D-15 colour blindness test17
(2009), a computerized version of FM D 15 Hue test is available online. This test
was introduced by Farnsworth in 1947. It aims to divide people into two groups :
people who are slightly colour blind or not colour blind (these persons pass the
test) and all other persons (these persons fail the test).
Colour blind individuals do not arrange colours in the correct order but
Vingrys and King- Smith (1988, ) developed a scoring method based on colour
difference vectors. This test identifies the type and severity of colour blindness18.
The type of colour blindness is quantified by the "confusion angle" and the
severity is indicated by the "confusion index"18.
The "confusion angle" identifies deficient colour vision of the individuals.
Thus an angle greater than +0.7 degrees points towards a protan defect, one
which is +0.7 and -55 a deuteran defect and a value below that suggests a tritan
defect.Combining the values of the major radius and minor radius results in the
Total Error Score (TES). The TES ranges from around 11 upto about 40 for
marked deficiencies of vision.
The 'Selectivity index' indicates the parallelism of the confusion vectors
to the confusion angle. This is the ratio of the major radius to the minor radius.
Here it is classified into two types. The patient is diagnosed as either no colour
deficiency or very low, if the ratio is below 2 and patients with colour deficiency
will have high ratios more than 6.
The ratio between the major radius and the minor radius of a perfect
arrangement is the 'Confusion index'. People with normal colour vision or
slightly colour blind persons have a ratio below 1.2. The higher this value (above
a ratio of 4), the more severe is the colour blindness.
Contrast sensitivity refers to the ability to identify slight changes in
luminance which are not separated by definite borders in between two
(difference between light dark band or letter and back ground). The first low
contrast letter was introduced in 1854.
The contrast (Weber fraction) for letters is defined as (Lt-Lb)/ Lb, where
Lt and Lb are the luminance of the target and background, respectively. The
contrast for sine wave gratings is the Michelson contrast = {Lmax- Lmin} /
{Lmax+ Lmin}.Lmax indicates luminances of light bands and Lmin indicates
luminances of dark bands.
The contrast sensitivity functions can be measured by plotting contrast
sensitivity over high spatial frequencies. It shows a peak at intermediate spatial
frequencies of 2-cycles / degree, with a rapid fall off at higher spatial frequencies
and a gradual decline at lower frequencies, under photopic conditions.
Several factors may affect contrast sensitivity. With reference to
refractive errors, the visibility at low spatial frequencies is not limited by the
refractive property of the eye; refractive errors affect only the higher
frequencies.
Interestingly, there is a definite decrease in contrast sensitivity with
increasing age 19 (Campbell.FW, 1968). Early lenticular changes can reduce
contrast sensitivity essentially for low spatial frequencies ; this decrease in
contrast sensitivity is not related to the visual acuity. Contrast sensitivity is also
found to be affected by various ocular diseases, such as glaucoma and
amblyopia, and by systemic diseases, such as multiple sclerosis and pituitary
There are several types of contrast sensitivity deficits. There is increasing
loss of contrast sensitivity at high spatial frequency is called as high frequency
type of contrast sensitivity deficit, loss of contrast sensitivity for all spatial
frequencies indicates level loss type and in patients with selective loss of
contrast sensitivity, the deficits occur in a narrow band of spatial frequencies.
There are several ways of measuring contrast sensitivity. These include
the Arden grating, Cambridge low contrast grating, Pelli- Robson contrast
sensitivity chart and the Vistech chart.
LEA contrast sensitivity is a simple test easily understandable by children
and used to check for contrast sensitivity in children with low vision, amblyopia
and multiple disability. The LEA contrast sensitivity was named ater Dr.Lea
Hyvarinen, a paediatric ophthalmologist who first used symbol charts followed
by number charts to test contrast sensitivity in 1976. The visual information
presented in low contrast settings is necessary for the process of visual
communication20 (Hyvarinen L, 2009). The test kit consists of 10 M LEA
symbols in different contrast settings. The child is asked to identify the symbols,
such as square, triangle, circle, home and apple from the highest contrast to the
lowest at 3 meters first. If the child is not able to read all the 25 letters at 3 m, the
distance is decreased to 2 meters, 1 meter and 0.5 meter. The number of symbols
read at each distance is noted.
Stereopsis refers to the perception of depth and the three dimensional
binocular single vision. It is measured in seconds of arc (1 deg= 60 min of arc; 1
min=60 secs)21 (The normal spatial visual acuity is 1 min and normal stereo
acuity is 60 secs. The lower the value, the better the acuity (Kanski, 2011).
Tests for stereopsis include theTNO and Frisby tests, which provide the
most definite evidence of high -grade binocular single vision, the Titmus test,
which gives more reliable evidence of stereopsis, and the Lang test.
TNO (The Netherlands Organisation) random dot test consists of
randomly -distributed paired red and green dots which are viewed by red- green
spectacles. The TNO cards consists of seven plates and within each plate the
dots with particular colour forms the target shape and are displaced horizontally
in relation to their paired dots of the other colour which gives retinal disparity
from those outside the target. The test targets are visible to an individual with
stereopsis while wearing red- green spectacles. First three plates are used to
identify gross stereopsis and next four plates are used to quantify the stereopsis.
The disparities measured range from 480 to 15 secs of arc tested at 40 cms. Most
children are able to do this from about 4 years of age. The nomal stereopsis is
considered to be less than or equal to 60 arc secs.
Visual field testing can be done by using static or kinetic perimetry.
Bjerrum's screen is a type of kinetic perimetry. Here, the patient is seated at a
distance of about 1 or 2 meters from the tangential screen and a moving stimulus
of white test target of size 0.3 cm, 0.5 cm, 1 cm or 2 cms can be used. It involves
until it is noted. Then the stimulus is moved along various meridians (clock
hours) and the point where the patient is able to perceive the target is recorded
on the chart. By joining all these points, an isopter is plotted for that stimulus
intensity. While evaluating low vision cases, first visual field is tested separately
in each eye and finally the field is examined binocularly. Before prescribing for
near vision, the location of the scotoma should be identified, that may indicate a
need for eccentric viewing of training for the patients.
Normal binocular single vision involves the simultaneous use of both
eyes with bifoveal fixation, so that each eye contributes to a common single
perception of object. Conditions necessary for normal binocular single vision
include normal routing of visual pathways with overlapping visual fields,
binocularly- driven neurones in the visual cortex, normal retinal correspondence,
accurate neuromuscular development and coordination and approximately equal
image clarity and size for both eyes.
Binocular single vision is measured by the Synoptophore, which consists
of 2 cylindrical tubes with a mirrored right- angled bend and a +6.50 D lens in
each eye piece. This optically sets the testing distance equivalent to about 6
metres. The pictures are inserted in a slide carrier and they are moved in relation
to each other and any adjustments are indicated on a scale. The synoptophore
can measure horizontal, vertical and torsional misalignments simultaneously.
The near point of convergence (NPC) is the nearest point on which the
eyes can maintain binocular fixation, measured with RAF (Royal Air Force)
ruler. The RAF rule provides a binocular gauge to measure convergence,
accomodation etc. The RAF rule is 50 cm long rule with a slider holding a four -
sided rotating cube with each side presenting with different target. The first has a
vertical line with a central dot for convergence fixation; next the others provide a
limited number of lines of near- reading. A cheek rest is provided to insure
consistency and height for the patient. Some studies22 (Adler, 2007) have
confirmed that near point of convergence when measured by Royal Air Force
ruler gives accurate measurements. The objective NPC is measured by moving a
target slowly along the rule towards the patient's eyes until fixation is lost in one
eye and deviates laterally. The normal NPC should be nearer than 10 cms
without undue effort.
The nearest point at which the accomodative target is seen clearly is
called the near point of accomodation (NPA). The test is done using the RAF
rule. The test is done on each eye first followed by both eyes together.From the
NPA value recorded in the RAF rule, accomodative amplitude is calculated
which is reduced in the case of amblyopia (Singmann and Matta, 2013). The
near point of accomodation varies depending on the age, such as 7 cm at 10
years, 25 cm at 40 yrs and 33 cm at the age of 45 yrs, respectively23 (Duke-
Elder, Sir Stewart, 1969).
Physical accomodation occurs whenever there is deformation of lens
focusing power of the eye is increased by 1 D, the accomodation will increase by
1D. On the other hand, physiological accomodation refers to the contractile
power of the ciliary muscle required to change the focusing power of the eye by
1D; it is measured in diopters. At a young age, both are equal. In old age, the
lenticular capsule becomes stiffer, and hence, the quantum of physiological
accomodation becomes less than the quantum of physical accomodation. This
change is due to sclerosis of the lens and loss of elasticity of the zonules and
ciliary muscles24 (Duker, Jay S, 2008).
The reading rate refers to the speed and comprehension rate. The child
should read a text school book used in his/ her grade and should read in his/her
usual language. The current way of reading should be chosen; for example, using
distance correction only, large print or school book size print with magnifier.
The child should read as he /she does in school, for example, holding books in
hand or on stand. A text should need a minimum of 5 minutes reading on
average, and time should be measured using a watch with seconds. Five
comprehension questions should then be asked after the reading and the reading
speed and comprehension should be calculated as usual. The rate is the number
of words read per minute which is calculated by the number of words read in the
passage divided by the number of seconds spent in reading and then multiplied
by sixty.
To measure the writing speed, the same text as used for reading speed
should be used, and the text should be read to the client. The client is then asked
calculated by counting the number of letters. The patient should again use the
glasses or device he /she normally uses while writing.
The treatment for low vision includes best glasses and low vision aids. A
low vision aid refers to an optical device that improves or enhances residual
vision by magnifying the image of an object at the retinal level. There are some -
optical aids that may help in enhancing the visual performance. The types of
optical low visual aids available include magnifying spectacles, hand magnifiers,
stand magnifiers, telescopes and electronic magnifiers, (for example, closed
-circuit television {CCTV}, low vision imaging system {LVIS} and
V-max)25.Non-optical devices include approach magnification, lighting, contrast
enhancement, increasing size of the object to be viewed, magnifying mirror,
writing and communication devices and orientation and mobility devices25.
There are several studies reported in the literature on visual functions in
refractive errors.
Luciana and de Figueinedo26 (2011) evaluated the capacity to differentiate
functional vision in children between low vision and normal vision group. In
Group 1, there are 20 children with low vision and in Group 2, there are 20
children without low vision. According to this study, the total functional vision
assessment median was low for the low vision group. In an earlier study,
Khandekar27 et al. (2010) evaluated the refractive status and visual functions of
children with special needs in Oman and found that the prevalence of refractive
healthy first - grade students (group 2) was 58.5% and 2.9%, respectively; the
risk of refractive error with reduced visual functions was significantly higher in
group 1with hyperopia (>1.00 D), myopia (>1.00 D) and astigmatism (>1.00 D)
in 18.6%, 24.3%, and 27.1%, respectively.
Karki28 et al. (2006) conducted a study to investigate the prevalence of
amblyopia in ametropes in a clinical set-up. In this study, individuals from 4-5
years age group to the young adults were selected. A total of 970 ametropic eye
patients with visual acuity below 6/9 were included. Out of 970 ametropic eye
patients a total of 56 (5.97%) patients have amblyopia. In this study, ametropic
amblyopic patients with myopic astigmatism 31 (55.36%) were more common
than other refractive errors and the distribution of ametropic amblyopia was
more in males 32 (57%) than in females 24 (43%)
Karkhene29 et al. (2003) conducted a study to detect colour vision deficit
in axial high myopia in 40 patients aged 17-40 years with refractive error of 6.00
D or more with Farnsworth D-15. In this 26 eyes had colour vision defects
including 24 eyes with tritan (blue-yellow) defect, 2 eyes with deutran (green)
defect and one eye with protan (red) defect. The eyes with refractive error of
more than -12.00 D or less had defective colour vision, and the eyes with less
visual acuity less than 20/30 or more had defect in colour vision test.From this
study he concluded that in high axial myopia there is colour vision defect,
mostly with a tritan defect, and there is also a correlation between axial length of
Liou and Chiu30 (2001) reported myopia and contrast sensitivity function
of the study with 105 myopic eyes and 25 emmetropic eyes collected in
corrected visual acuity of 20/20 or better. The myopic groups were divided into
4 groups. In group 1 and 2, there was no significant difference in contrast
sensitivity between myopes and emmetropes. In group 3, statistically significant
low contrast sensitivity at higher spatial frequencies was found for myopic
subjects corrected only with spectacle lenses. In group 4, myopic subjects
corrected with spectacles showed much reduction in contrast sensitivity
functions at all frequencies. This study concludes that low and medium myopes
with normal contrast sensitivity had no retinal dysfunction. The patients with
early retinal function disruption will present with loss of contrast sensitivity
before retinal changes occurs in severe myopic patients and this cannot be fully
compensated by contact lens correction. For high myopes, contact lenses
correction reduce the optical defocus and improve contrast sensitivity function in
high spatial frequencies.
A study by Donnelly, Stewart and Hollinger31 (2005) evaluated the
prevalence and outcomes of visual disorders in children and young adults. It was
found that hyperopia >3D (15.3%), myopia >0.5 D (10.8%) and astigmatism
>1Dcyl (20.6%) refractive errors correlated with reduced contrast sensitivity.A
study by Martin-Boglind (1991), Herse32 et al. In 1992 and Donahue et al in
1999 found that an error as little as 1D can significantly influence the visual
peripheral visual field as well as reduction in contrast sensitivity along with
slowed reaction time when compared with control subjects.
Ohno-Matsui33 et al. (2011) conducted visual field examinations by
Goldman kinetic perimetry for 492 eyes of 308 patients with high myopia
(myopic refractive error >8D or axial length >26.5 mm) and followed up the
patients for 5 years or more. Patients with posterior fundus changes were
excluded. The study patients were classified as having significant field defect if
10% or more of field loss occurs and further loss of 10% or more during the
follow-up period was classified as a significant progression. Significant fresh
visual field defects developed in 13.2% of these selected highly myopic eyes
during a mean follow-up of 11.6+/-5.5 years. The incidence of significant visual
field defects was significantly higher in myopic eyes and later resulted in
significant progression of defect in visual field. The progression of the visual
field defects depends upon change in scleral curvature. (Ohno-Matsui, 2011).
Li S34 et al (2014) conducted a study on stereoscopic visual acuity in
types of ametropic amblyopia in 205 children with the average of 5.2 years
including amblyopia in 65 cases of astigmatism, 30 myopia and 110 hyperopia.
The distance and near stereoacuity were performed by synoptophore and random
–dot stereoacuity test. Individuals with hyperopia have better central stereopsis
and macular stereopsis, whereas children with astigmatism have significantly
decreased stereoacuity. No difference was identified between the three types in
children with severe amblyopia. The types and degrees of amblyopia were
amblyopic eyes, children with astigmatism had the worst stereoacuity and there
was significant difference (p<0.05) in stereoacuity between different refractive
errors.
Walraven and Janzen35 (1993) clinically evaluated and recorded
stereopsis of 730 school children aged 4-18 yrs by using the TNO test for the
early detection of amblyopia. Important findings were : all amblyopes were
detected by the TNO test’s recommended normal as 240 arc secs; the red- green
anaglyphs used in the test did not create a issue for persons with a colour
deficiency; the ability to discriminate depth improved by a factor of two over the
age interval 4 to 12 years; a stereoacuity of less than or equal to 120 sec arc was
a good predictor of normal or correctable normal vision and there was a greater
chance of disturbed binocular vision; and 75% of amblyopes remained
amblyopic, possibly because of delayed detection, with 60% of the amblyopes in
the population examined not being identified before the age of 5 years.
Some years ago, Chang36 et al. (2007) studied screening of preschool
children for amblyopia with uncorrected vision and stereopsis tests in Eastern
Taiwan. This study aimed at evaluating the validity of uncorrected distant vision,
near vision and random dot stereopsis for screening amblyopia.5232 children
were included, screened by distance visual acuity and near visual acuity values.
It was concluded that screening for amblyopia by using visual acuity tests or
random dot stereopsis test alone did not display a high sensitivity but
simultaneous testing of distant visual acuity and stereopsis test elevated the
In a retrospective study, Taylor37 et al. (2012) noted that 73% of children
were successfully treated with patching, but that this figure dropped to about
50% of children after 3 years. About 25% of successfully- treated children
experienced a recurrence within a year of tailing off of treatment; this was more
likely to occur if treatment was stopped abruptly. Repka38 et al. (2009)
conducted a study on contrast sensitivity following treatment of amblyopia like
patching versus application of atropine eye drops in moderate amblyopic eyes.
The contrast sensitivity was measured by using Pelli- Robson charts in 86
subjects (mean age 10.3 years) who at 3 to 6 years of age. Visual acuity in the
amblyopic and fellow eyes at the time of the exam were 0.17 logMAR units and
-0.04 logMAR units, respectively. There was a statistically significant difference
in mean identification score of contrast letter, and this was slightly more in the
amblyopic eye than in the fellow eye (1.75 versus 1.78).
In a study by Carney39 et al. (1997), the main structural difference
between hyperopic and myopic eyes was found to be the axial length, which was
higher for myopic eyes. Axial length (AL) was measured by the IOL Master in
24 myopic and 22 hyperopic eyes and these eyes did not show any ocular disease
or condition apart from the corresponding ametropia. Both groups were age-
matched, being 30.5+/- 3.8 yrs (range 26-39 yrs) for the myopic and 30.3+/- 5.2
yrs (range 23-40 yrs) for the hypermetropic group. The spherical equivalent was
higher (from -0.8 to -7.6 D) for the myopic group than for the hypermetropic
group (+0.5 to +7.4 D). Astigmatism was less than 2.5D for all the subjects. The
the axial length of myopic eyes (25.16+/-1.23). There was statistically
significant linear correlation of axial length with spherical equivalent of
refractive error, and hyperopic eyes tended to shorten with increasing spherical
equivalent (Carney et al, 1997). Similarly, the axial length/ apical radius of
curvature of the cornea was significantly higher in the myopes (3.2+/-0.2) than
in the hypermetropic group (2.8+/-0.1). There was statistically significant
correlation between AL/CR and spherical equivalent of refractive error.
(p<0.001) (Carney et al, 1997). Larger amounts of spherical aberrations were
also noted in hyperopic eyes compared to moderately myopic eyes. The authors
opined that the corneal radius of curvature and asphericity causes significant
differences in spherical aberration and it was due to ocular growth (hyperopic
eyes were smaller and more spherical whereas myopic eyes tended to flatten
more in the periphery than in the central cornea). As a result of increased corneal
spherical aberration in hyperopic eyes, a total spherical aberration was found to
be significantly higher in hyperopia than in myopia with similar absolute
refractive error and age.
A study by Lueck40 et al. (2003) showed that children with low vision
need minimum three times the acuity reserve to read properly. So patients with
low vision need larger print sizes to gain the optimum acuity reserve. A study by
Lovie-Kitchin41 et al. (2001) showed that acuity reserve between 2.5:1 to 7:1
was necessary to achieve maximum reading rate. Patients with lower visual
acuities tended to achieve maximum reading rate with less acuity reserve. These
acuity in children with low vision. A study by Farmer and Morse42 in 2007
compared between 2 groups of children. Large print sizes were given to the first
group and magnifiers were given to second group of children for reading. The
results showed that the first group had an increase in reading speed rates but no
significant increase in comprehensive skills. The second group of children
showed an increase in their reading speed rates as well as an increase in their
reading comprehensive skills.
According to Leat and Woodhouse43 (1993), the best predictor of reading
speed was contrast sensitivity. Based on a study of 30 adult subjects, the authors
concluded that contrast sensitivity at 0.5c/deg was correlated with reading
performance and contrast sensitivity. The patients with low vision had poorer
reading speed at high spatial frequencies of contrast sensitivity than at the lower
spatial frequencies. These authors concluded that visual reading in children with
low vision depends on visual requirements in terms of acuity (or magnification),
contrast sensitivity and visual field.
In a study by Legge44 et al (1985), 141 adults with low vision were
included. Visual field was examined by Goldmann perimeter or tangent screen.
If the subject had a scotoma that covered all or part of the central 5 degree of the
visual field he/ she was considered to have central visual field loss which was
associated with a slow reading speed. The majority (74%) of slow readers were
G.Burggasser45 et al (2005) conducted a study on monocular and
binocular reading performance in children with microstrabismic amblyopia. The
reading performance of 20 children with microstrabismic amblyopia and 20
normal sighted children were compared by using standard reading charts for
reading acuity and speed. In this study, binocular reading speed was 200
words/min for controls, 173 words/min for binocular reading speed in amblyopic
children but no difference in visual acuity and reading acuity.For monocular
reading, impairment was found in the amblyopic eye than the sound eye. This
study concluded that functionally relevant reading impairment was present in
amblyopic patients eventhough patients had normal binocular visual acuity and
reading acuity.
A putative relationship between writing skills and visual- motor control
was assessed in 42 students with low vision and 26 normal-sighted students
Atasavum Uysal46, 2012). The authors administered the Bruininks- Oseretsky
Proficiency Function Test writing subset, and a legibility assessment. Significant
differences were found between the groups in writing speed, legibility, and
visual motor control. Visual motor control was correlated with both writing
speed and legibility. Students diagnosed as low vision had poorer performance in
handwriting, with slower writing speed. From this study, it was concluded that
patients with low vision had correlation between visual motor control and
writing.
Singman and Matta47 (2013) conducted a study of association between
(GSAR) was used to measure accomodative amplitudes in children with
amblyopia and the result was confirmed by using subjective and objective tests
which includes the minus lens method, the near point of convergence by using
Prince Rule, and retinoscopy. The accomodative amplitude was reduced in
fifty-two children at 1/3 of a meter wearing their glasses correction during
examination.
Ruth E. Manny, Karen D.Fern48 (2011) conducted a study on changes in
fusional vergence, phoria and near point of convergence in myopic children in
114 individuals, aged 7-13 years and followed up annually for 10 years. During
follow-up, measurements like refractive error for distance and near, prism bar
fusional vergence range, near point of convergence were measured.After 10
years, the distance and near base out was decreased from 20 pd and 30 pd to 5.6
pd and 9.4 pd. This study concluded that for myopic children, the near point of
convergence ranges decrease for both distance and near vision viewing as near
phoria becomes more exophoric.
Adler49 et al (2007) conducted a study on measurement of NPC by using
different target types and RAF rule. Five targets were used to measure the NPC,
namely, pencil tip, finger tip, penlight, N5 letter and vertical line target on the
RAF rule. No significant difference was found in NPC measurements by
different target types. The RAF rule was found to significantly influence the
NPC obtained. There was significant difference in NPC measurements between
1.9 times as much as those obtained with other targets. The effect of the RAF
rule was more apparent for more receded NPC points. (Adler et al, 2007).
Mohindra and Molinari 50 (1980) studied a three step approach to further
evaluate convergence insufficiency in patients. First, the NPC was measured
with a penlight and second, the NPC was measured with a penlight and a red
filter over one eye or with a red-green filter and lastly the NPC was measured
with an accomodation target. The results from these three measurements were
compared. In such cases, the measurement with the accomodative target would
be found to be near normal or better than the non- accomodative penlight target.
Patients having good binocular vision for near would get similar results from the
three tests compensating any anomaly with accomodation if present.
A study by Cotter51 et al. (2007) provided an optometric perspective on
the management of hyperopia in children without strabismus or amblyopia.
These authors concluded that variations in prescribing patterns for childhood
hyperopia occur within optometry and within ophthalmology. They opined that
there are also differences in prescribing philosophies between the two
professions. These differences are probably due to a greater level of concern,
possibly more so among optometrists, about associated vision functions such as
accomodation, vergence and stereopsis as well as concern about the potential
impact of uncorrected hyperopia on reading and school performance.
Sethi and Kartha52 (2000) studied the prevalence of refractive errors in
refractive errors. Of these 196 were females and 221 were males. There was no
significant difference between frequency of occurrence of refractive errors
among males and females. In this study, myopia was found in 265 cases,
hypermetropia in 47cases and astigmatism in 85cases. The refractive errors was
found to be 25.3% which included 63.5% myopia, 11.2% hypermetropia and
20.4% astigmatism and this study concluded that myopia was more common in
children. (Sethi and Kartha, 2000).
Brady53 et al. (2012) studied visual functions in patients with refractive
errors after correction of distance refractive error with ready- made spectacles
(RMS) and custom made spectacles (CS). In this study, complete refraction was
done in 363 adults aged 18-45 yrs with >1 D of uncorrected refractive error and
they were randomized to receive custom spectacles (full sphero- cylindrical
correction) or ready- made spectacles based on the spherical equivalent. The
visual function of the patients and quality of life improvement, participant
satisfaction were estimated. The Rasch scores for visual quality of life increased
from 1.14 to 4.37 logits in the RMS group, and from 1.11 to 4.72 logits in the CS
group. Mean satisfaction with vision at one- month follow up also increased by
1.83 points on a 5- point Likert scale in the RMS group and 2.04 points in the
CS group.
Huang54 et al (2014) conducted stereoacuity tests in 11 observers (21.1+/-
5.1 years) with anisometropic or ametropic amblyopia. They were trained to
judge depth in 10-13 sessions. Red -green glasses were used to present 3
duration. Stereoacuity test and visual acuity were assessed with the Tumbling E
chart before and after training. This study showed significantly reduced disparity
threshold from 776.7" to 490.4" (p<0.01) and improved stereoacuity from 200.3"
to 81.6"and also the patient had significantly improved visual acuity from 0.44
to 0.35 logMAR in the amblyopic eye after training.
Wallace55 et al. (2007) studied treatment of bilateral refractive amblyopia
in children about 3-10 years of age.113 children with previously untreated
bilateral refractive amblyopia were corrected with spectacles. Bilateral refractive
amblyopia was defined as best corrected visual acuity of 20/40 to 20/400 with
4.00D or more of hypermetropia, 2.00 D or more of astigmatism, or both in each
eye. Best corrected binocular and monocular visual acuities were measured at
baseline and at 5, 13, 26 and 52 weeks In this study, it was concluded that the
mean binocular visual acuity improved from 0.5 logMAR at baseline to 0.11
MATERIALS AND METHODS
This prospective, comparative study was done to compare the visual
functions in individuals with normal vision and those with low vision and also to
document the improvement in the subjective and objective visual parameters in
children and young adults in whom interventions were made.
All patients aged 5-30 years presenting with refractive error at the out-
patient department of the Institute of Ophthalmology, Joseph Eye Hospital,
Tiruchirappalli were assessed for possible inclusion in the study from August
2014- October 2014 and reviewed after 6 months. Ethical clearance was
obtained from the Institutional Ethics Committee, Institute of Ophthalmology,
Joseph Eye Hospital (IOJEH), Tiruchirapalli. Informed consent was obtained
from the parents or guardian who accompanied the children. The nature and
purpose of the study were explained to the participants /parents.
INCLUSION CRITERIA
1. Patients in the 5-30 years age group ;
2. Literate patients ;
3. Patients with informed consent for participation in the study ;
4. Patients willing for follow-up study; and
5. Ametropic amblyopia.
EXCLUSION CRITERIA
Patients were excluded from the study if they had even one of the
1. Strabismus / anisometropic amblyopia ;
2. Refractive errors <0.5 D (sphere / cylinder) ;
3. Nystagmus ;
4. Any previous ocular surgeries ;
5. Any ocular pathology (in the cornea, retina, lens).
The patients were divided into two groups. Group 1, were those with best
corrected visual acuity (BCVA) > 6/18 (in both eyes) (50 patients), Group1
subgroup A consisted of those presenting for the first time while subgroup B
consisted of those already using interventions. Group 2, were those with
(BCVA) <6/18 (in both eyes) (50 patients); Group 2 subgroup A consisted of
those presenting for the first time while Group 2 subgroup B consisted of those
already using interventions.
All eligible patients underwent a complete clinical and visual function
assessment and were prescribed interventions. Clinical and visual function
assessment include examination of the anterior segment by slit-lamp
biomicroscopy and posterior segment by fundus examination, presenting and
best corrected visual acuity testing by logMAR charts for both distance and near
vision; refraction; contrast sensitivity testing by Lea’s low contrast numbers;
visual field testing by Bjerrums; colour vision by Farnsworth D 15; testing of
visual skills such as reading and writing speed, stereopsis by TNO cards and
binocular single vision parameters by synoptophore, near-point of
Interventions prescribed included prescription of distance and near
correction, optical, non-optical devices and environmental modifications. All
cases were reviewed after 6 months and presenting and BCVA, and visual skills
like reading and writing speed were evaluated at follow up.
Data compiled included age, gender, duration of complaints, previous use
of best glasses and duration of use, type of refractive error, uncorrected and best
corrected distance and near visual acuity values, colour vision, stereopsis,
binocular single vision, visual fields, contrast sensitivity, visual skills like
reading speed, writing speed, comprehension and mobility. The visual functions
of the patients were compared and evaluated between the groups. The
components of visual function and visual skills with the groups was also
Assessment of Stereopsis using TNO Test Card
Assessment of Contrast Sensitivity using LEA Colour Contrast 10 M test
RESULTS
The current study on visual functions in children and young adults with
refractive errors was performed at the Low Vision Department of Institute of
Ophthalmology Joseph Eye Hospital, Tiruchirapalli, Tamilnadu.
The study population was enrolled over a period of three months (August
2014 to October 2014) with a detailed evaluation of uncorrected and best
corrected distant and near visual acuity, contrast sensitivity, colour vision,
stereopsis, binocular single vision, near point of accommodation, near point of
convergence and functional skills like reading and writing skills, being
performed at the time of enrolment and again after 6 months.
1. Sample size
Eligible patients enrolled in the study were sought to be categorised into
two main groups (two arms) based on best- corrected visual acuity (BCVA) at
the time of initial presentation, namely, with BCVA ≥ 6/18{better than or equal
to 6/18) or with BCVA< 6/18. Given a population size of 150, a response
distribution of 70%, a margin of error of 5% and a confidence level of 95%, a
recommended sample size of 103 individuals per arm of the study was calculated
(calculated online at www.raosoft.com, accessed on August 20, 2014).
Due to various constraints (limited time duration of the study, reluctance
of patients to participate), it was finally possible to enroll only a total of 100
2. Study population
It was finally possible to enroll 100 individuals (58 males and 42 females)
ranging in age from 5 to 30 years. These individuals were categorised into two
groups, with each of the main groups having two subgroups as:
• Group 1: Individuals (n1=50) with BCVA ≥ 6/18
o Subgroup 1A (25) = Those presenting for the first time.
o Subgroup 1B (25) = Those who are already using interventions.
• Group 2: Individuals (n2=50) with BCVA < 6/18
o Subgroup 2A (25)= Those presenting for the first time
o Subgroup 2B (25)= Those who are already using interventions.
3. Demographic Aspects of the Study Population
3.1 Age of the individuals enrolled
Mean age of the individuals enrolled in Group 1 was 15.96 ± 6.45 years
and that in group 2 was 12.78 ± 6.67 years. This difference was statistically
significant [Mann-Whitney U test; (U= 850); P=0.006).
The mean age of the individuals studied was 15.8 ± 7.1 years in Group
1A and 16.2± 5.8 years in Group 1B, 10.0 ± 5.9 years in Group 2A and 15.0 ±
6.7 years in Group 2B. The difference in mean ages between subgroups 1A and
1B was not statistically significant, while the difference in mean ages between
subgroups 2A and 2B was statistically significant (U=170; P=0.006) (Table1,
Table 1: Mean ages of individuals enrolled in the current study. Group (no.of individuals) Mean Age (yrs) Statistical analysis (Mann-Whitney ‘U’ test) Subgroups (100) Mean Age (yrs) Statistical Analysis (Mann-Whitney ‘U’ test) Group 1 (50) 15.96 ±
6.45 Group 1 vs
Group 2 U=850 P=0.006
1A (25) 15.8 ± 7.1 Group 1A vs
1B U=292, P=0.690
1B (25) 16.2 ± 5.8
Group 2 (50)
12.78 ± 6.67
2A (25) 10.0 ± 5.9 Group 2A vs
2B U=170, P=0.006
2B (25) 15.0 ± 6.7
Subgroup 1A=. Individuals (n=25) with BCVA ≥ 6/18 presenting for the first
time.
Subgroup 1B= Individuals (n=25) with BCVA ≥ 6/18 already using
interventions.
Subgroup 2A=Individuals (n=25) with BCVA < 6/18 presenting for the first time.
Subgroup 2B=Individuals (n=25) with BCVA< 6/18 already using interventions.
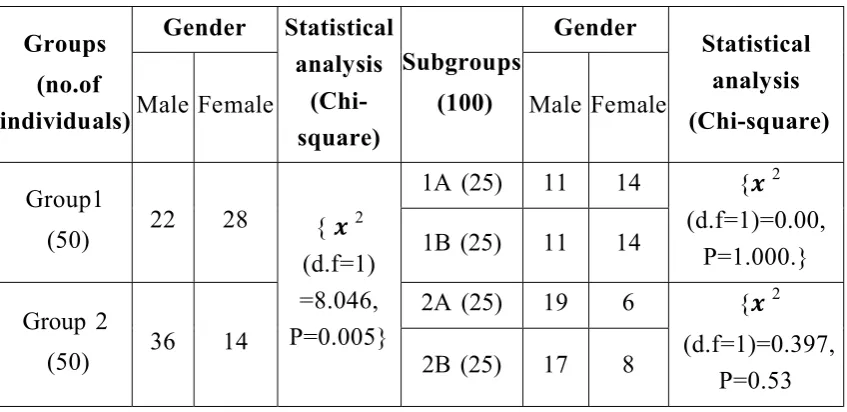
3.2 Gender of the individuals enrolled
There were 22 males and 28 females in Group 1 (11 males and 14 females
each in Group 1A and in 1B), 36 males and 14 females in Group 2 (19 males and
six females in Group 2A and 17 males and eight females in Group 2B). The
difference between the proportions of males and females in Group 1 and 2 was
statistically significant (Table 2) (Chi-square test ࢞ 2 (d.f=1)=8.046, P=0.005).
However, there was no statistically significant difference between the
Table 2: Gender distribution of the individuals enrolled. Groups (no.of individuals) Gender Statistical analysis (Chi-square) Subgroups (100) Gender Statistical analysis (Chi-square)
Male Female Male Female
Group1
(50) 22 28 { ࢞2
(d.f=1) =8.046, P=0.005}
1A (25) 11 14 {࢞2
(d.f=1)=0.00, P=1.000.}
1B (25) 11 14
Group 2
(50) 36 14
2A (25) 19 6 {࢞2
(d.f=1)=0.397, P=0.53
2B (25) 17 8
Subgroup 1A=. Individuals (n=25) with BCVA ≥ 6/18 presenting for the first
time.
Subgroup 1B= Individuals (n=25) with BCVA ≥ 6/18 already using
interventions.
Subgroup 2A=Individuals (n=25) with BCVA < 6/18 presenting for the first time.
Subgroup 2B=Individuals (n=25) with BCVA< 6/18 already using interventions.
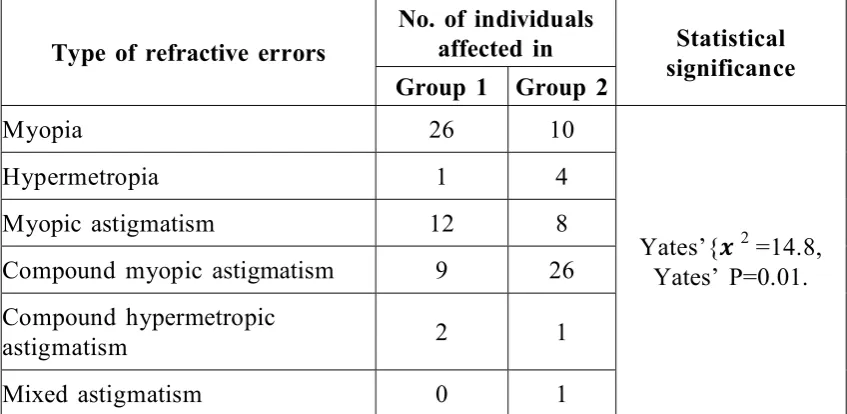
3.3 Diagnosis of refractive errors in both eyes of the individuals enrolled
in the current study.
In group 1, twenty six (52%) patients had myopia, one (2%) had
hypermetropia, twelve (24%) had simple myopic astigmatism, nine (18%) had
compound myopic astigmatism, two (4%) had compound hypermetropic
astigmatism in both eyes.
In group 2, ten (20%) patients had myopia, four (8%) had hypermetropia,
eight (16%) had simple myopic astigmatism, twenty six (52%) had compound
(2%) had mixed astigmatism in both eyes. These differences were statistically
significant (Yates’ correction was applied because atleast one expected
frequency was <1, Yates’{࢞2 =14.8; Yates’P=0.01} (Table 3).
Myopia was present in 10 (40%) of 25 individuals in group 1A and in 16
(64%) of 25 individuals in group 1B; this difference was not statistically
significant (࢞2 [d.f=4]=8.4;P=0.83). Compound myopic astigmatism was present
in 11 (44%) of 25 individuals in group 2A and in 15 (60%) of 25 individuals in
group 2B; this difference was not statistically significant (࢞2 [d.f=5]=6.2;P=0.3)
[image:51.595.93.517.407.614.2](Table 3, Fig 3).
Table-3. Refractive errors in both eyes of the individuals enrolled in the current study.
Type of refractive errors
No. of individuals
affected in Statistical
significance
Group 1 Group 2
Myopia 26 10
Yates’{࢞2 =14.8,
Yates’ P=0.01.
Hypermetropia 1 4
Myopic astigmatism 12 8
Compound myopic astigmatism 9 26
Compound hypermetropic
astigmatism 2 1
Mixed astigmatism 0 1
Yates’ correction was applied atleast 1 expected frequency was <1.
Group 1= Individuals (n=50) with BCVA ≥ 6/18.
3.4. Evaluation of mean spherical equivalent in both eyes of individuals
enrolled.
The mean spherical equivalent was -1.85±1.94 in Group 1 and -5.9±7.85
in Group 2; this difference was statistically significant (Mann- Whitney U test
[U=679]; P<0.001).
The mean spherical equivalent was 1.2±2.85 D in subgroup 1A,
-2.50±2.75 D in subgroup 1B (Table 4); this difference was statistically
significant (Mann-Whitney ‘U’ test, U=173.5; P=0.007). The mean spherical
equivalent values in subgroups 2A and 2B were -5.9±7.8 D and -5.9±8.5 D,
respectively (Table 4); this difference was not statistically significant
(Mann-Whitney ‘U’ test, U=279.5; P=0.5) (Table 4).
Table 4: Mean spherical equivalent in both eyes of the individuals enrolled in the current study
Groups (no.of individuals) Mean Spherical Equivalent (dioptres) Statistical analysis (Mann-Whitney ‘U’ test) Subgroups (no.of individuals) Mean Spherical Equivalent (dioptres) Statistical analysis (Mann-Whitney ‘U’ test) Group 1
(50) -1.85±1.94 U=679,
P<0.000
1A (25) -1.2±2.85 U=173.5,
P=0.007
1B (25) -2.50±2.75
Group 2
(50) -5.9±7.85
2A (25) -5.9±7.8 U=279.5,
P=0.5.
2B (25) -5.9±8.5
Subgroup 1A=. Individuals (n=25) with BCVA ≥ 6/18 presenting for the first
time.
Subgroup 1B= Individuals (n=25) with BCVA ≥ 6/18 already using
interventions.
Subgroup 2A=Individuals (n=25) with BCVA < 6/18 presenting for the first time.
4. Interventions prescribed for individuals enrolled in the study
In Group 1 and 2, distance vision correction was prescribed to all patients
except three patients in subgroup 1B and one patient in subgroup 2B, who were
advised to continue using the same spectacles. In addition, patients in Group 2
were advised to use non-optical aids/ for near work (Table 5, Fig 4).
In Group 1A, new glasses were prescribed for all (100%)25 patients while
in Group 1B, new glasses were prescribed for 22 (88%) of 25 patients; this
difference was not statistically significant (Yates’{࢞2 =1.42; P=0.23). In Group
2A, new glasses were prescribed for all (100%)25 patients, while in Group 2B,
new glasses were prescribed for 24 (96%) of 25 individuals; this difference was
not statistically significant ({࢞2 [d.f=1]=1.0;P=0.3).
None of the patients in Group 1 were provided Low vision aids. There
was no significant difference in the prescription of low vision aids between
[image:53.595.93.519.525.734.2]Group 2A and 2B ( ({࢞ 2 [d.f=4]=7.754, ;P=0.2).
Table 5. Interventions prescribed to the individuals enrolled in the study.
Interventions Group 1 Statistical analysis Group 2 Statistical analysis
1A 1B 2A 2B
Glasses 25 22 Yates’=1.42,
P=0.23.
25 24 {࢞2 [d.f=1]=1.020,
P=0.312}
Same glasses 0 3 0 1
Low vision aids
CCTV 0 0
No significant difference.
0 2
(࢞2 (d.f=4)=7.754,
P=0.2
Magnifiers 0 0 1 1
Lamp 0 0 2 1
Telescope 0 0 2 0
5. CLINICAL VISUAL ASSESSMENT (Assessment of visual functions)
(As the difference in clinical visual parameters in between the eyes are minimal,
the clinical visual evaluation is considered for both eyes together).
5.1. Evaluation of best corrected distant visual acuity (BCDV) of both
eyes of individuals enrolled:
The mean BCDV (logMAR units) was 0.03±0.09 in Group 1 and
0.61±0.13 in Group 2 (Table 6);this difference was statistically significant
(Mann- Whitney ‘U’ test ;U=679, P<0.001).
The mean BCDV (logMAR units) was 0.05 ± 0.12 in subgroup 1A and
0.00 ± 0.0 in subgroup 1B; this difference was statistically significant
(Mann-Whitney ‘U’ test, U=262.5; P=0.04).
The mean BCDV (logMAR units) was 0.65 ± 0.15 in subgroup 2A and
0.57 ± 0.09 in subgroup 2B (Table 6); this difference was statistically significant
(Mann-Whitney ‘U’ test;U=199.5, P=0.02). In both the groups comprising of
patients with normal and low vision, review patients had a statistically
Table 6: Evaluation of best corrected distant visual acuity of both eyes of the individuals enrolled in the study
Group (no. of individuals) Mean BCDV (logMAR units) Statistical analysis (Mann-Whitney ‘U’ test) Sub groups (no.of individuals) Mean BCDV (logMAR units) Statistical analysis (Mann-Whitney ‘U’ test) Group 1
(50) 0.03 ± 0.09
Group 1 vs 2 U=0.00, P=0.000
1A (25) 0.05 ± 0.12 Group 1A vs
1B U=262.50,
P=0.039
1B (25) 0.00 ± 0.00
Group 2
(50) 0.61 ± 0.13
2A (25) 0.65 ± 0.15 Group 2A vs
2B U=199.50,
P=0.020
2B (25) 0.57 ± 0.19
BCDV=best corrected distant visual acuity.
Subgroup 1A=. Individuals (n=25) with BCVA ≥ 6/18 presenting for the first
time
Subgroup 1B= Individuals (n=25) with BCVA ≥ 6/18 already using
interventions.
Subgroup 2A=Individuals (n=25) with BCVA < 6/18 presenting for the first time
5.2 Evaluation of best corrected near vision (BCNV) of both eyes of the
individuals enrolled in the study
The mean BCNV (logMAR units) was 0.63 in Group 1 and 1.22±0.73 in
group 2 (Table 7); this difference was statistically significant (Mann-Whitney
‘U’ test, U=400; P<0.001).
There were no statistically significant differences between subgroups 1A
and 1B and also no statistically significant differences between subgroups 2A
[image:56.595.135.475.375.525.2]and 2B with reference for mean BCNV values (Table 8).
Table 7: Evaluation of best corrected near vision (BCNV) of both eyes of the individuals enrolled in the current study
Group (no.of individuals)
Mean BCNV (logMAR units)
Statistical analysis (Mann-Whitney ‘U’
test) Group 1
(50) 0.63±0.00 Group 1 vs Group 2
U=400 ;P<0.001 Group 2
(50) 1.22 ±0.73
Group 1= Individuals (n=50) with BCVA ≥ 6/18.
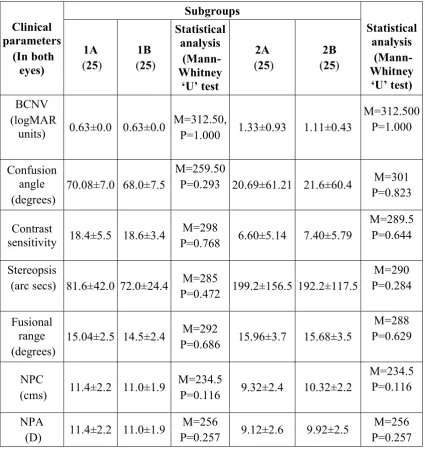
Table-8: Evaluation of clinical parameters in both eyes of the individuals within the subgroups enrolled in the study
Clinical parameters (In both eyes) Subgroups Statistical analysis (Mann-Whitney ‘U’ test) 1A
(25)
1B (25)
Statistical analysis (Mann-Whitney ‘U’ test 2A (25)
2B (25)
BCNV (logMAR
units) 0.63±0.0 0.63±0.0
M=312.50,
P=1.000 1.33±0.93 1.11±0.43
M=312.500 P=1.000 Confusion angle (degrees) 70.08±7.0 68.0±7.5 M=259.50
P=0.293 20.69±61.21 21.6±60.4 M=301 P=0.823
Contrast
sensitivity 18.4±5.5 18.6±3.4
M=298
P=0.768 6.60±5.14 7.40±5.79
M=289.5 P=0.644
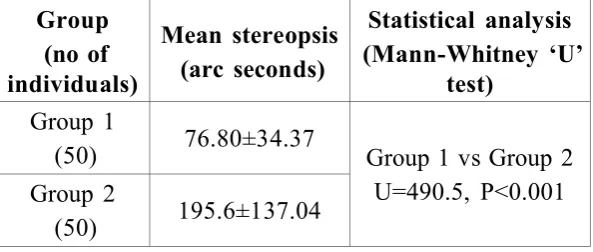
Stereopsis
(arc secs) 81.6±42.0 72.0±24.4 M=285
P=0.472 199.2±156.5 192.2±117.5
M=290 P=0.284
Fusional range (degrees)
15.04±2.5 14.5±2.4 M=292
P=0.686 15.96±3.7 15.68±3.5
M=288 P=0.629
NPC
(cms) 11.4±2.2 11.0±1.9
M=234.5
P=0.116 9.32±2.4 10.32±2.2
M=234.5 P=0.116
NPA
(D) 11.4±2.2 11.0±1.9
M=256
P=0.257 9.12±2.6 9.92±2.5
M=256 P=0.257
BCNV=best corrected near visual acuity. NPC=near point of convergence.
NPA= near point of accommodation.
Subgroup 1A=. Individuals (n=25) with BCVA ≥ 6/18 presenting for the first
time
Subgroup 1B= Individuals (n=25) with BCVA ≥ 6/18 already using
interventions.
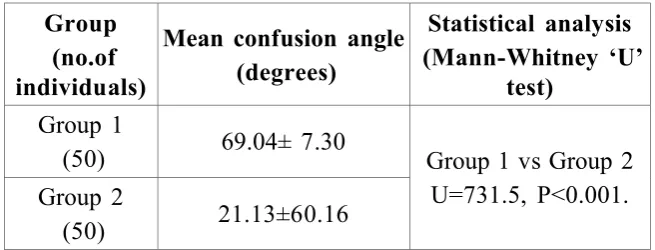
5.3 Evaluation of Colour Vision in both eyes of the individuals enrolled
in the study.
The mean confusion angle was 69.04±7.30 (degrees) in Group 1 and
21.13±60.16 in Group 2 (Table 9); this difference was statistically significant
(Mann-Whitney’U’ test;U=731.5;P<0.001).
The mean confusion angle was 70.08 ± 7.0 in 1A, 68.00 ± 7.5 in 1B,
20.69 ± 61.21 in 2A and 21.57 ± 60.36 in 2B subgroups. There was no
statistically significant difference between subgroups 1A and 1B (U=259.50,
[image:58.595.141.469.396.521.2]P=0.293) or between subgroups 2A and 2B (U=301, P=0.823) (Table 8).
Table-9: Evaluation of the mean confusion angle in both eyes of the individuals enrolled in the current study
Group (no.of individuals)
Mean confusion angle (degrees)