Coral reef health indicators: integrating ecological and perceptual assessments of anchor damage
80
0
0
Full text
(2) APPENDIX 1 Photographic stimuli used in the perceptual survey. The photographs were presented in a separate album from the questionnaire sheet 1. 2. 144.
(3) 3. 4. 145.
(4) 5. 6. 146.
(5) 7. 8. 147.
(6) 9. 10. 148.
(7) 11. 12. 149.
(8) 13. 14. 150.
(9) 15. 16. 151.
(10) 17. 18. 152.
(11) 19. 20. 153.
(12) 21. 22. 154.
(13) 23. 24. 155.
(14) 25. 26. 156.
(15) Appendix 2. Proceedings 9th International Coral Reef Symposium, Bali, Indonesia 23-27 October 2000, Vol. 2.. Abundance of black-band disease on corals from one location on the Great Barrier Reef: a comparison with abundance in the Caribbean region. E. A. Dinsdale. 1. Abstract Black-band disease (BBD) occurs on the Great Barrier Reef, Australia, with at least 21 species in five families being affected. Surveys of reef crest corals at Lizard Island found 2.8% of 4569 coral colonies were affected with BBD. Acroporidae, in particular Acropora hyacinthus, Acropora intermedia and Acropora millepora, were susceptible to BBD, compared with the Caribbean where acroporid corals are resistant to BBD. Pocilloporidae, including Pocillopora damicornis, Pocillopora verrucosa and Stylophora pistillata, were identified as important host species. The abundance of BBD varied between sites, ranging from 1.3% to 4.9% of colonies affected. The percentage of BBD-affected colonies varied between coral families. The percent of colonies affected with BBD were: 6.0% for the Pocilloporidae, 3.6% for the Acroporidae, 3.0% for the Faviidae and 2.1% for the Poritidae. The level of BBDaffected colonies on the GBR was within the range of affected colonies reported in the Caribbean. Keywords Black-band disease, Great Barrier Reef, Coral disease. Introduction Black-band disease (BBD) affects scleractinian and gorgonian corals from the Caribbean and Red Sea (Antonius 1981a, 1988a; Garret and Ducklow 1975; Feingold 1988; Peters 1993). Over half of the 34 species of scleractinian corals that have been reported as susceptible to BBD occur in the Caribbean region (Rützler et al. 1983; Antonius 1988b; Edmunds 1991; Green and Bruckner 2000). BBD in the Caribbean region has caused partial mortality of individual colonies and led to reduced coral cover on some reefs (Santavy and Peters 1997; Kuta and Richardson 1996; Bruckner and Bruckner 1997; Bruckner et al. 1997). In contrast, there are few reports of BBD affecting corals in the Pacific region. Antonius (1985) found two susceptible coral species, Goniastrea pectinata and Platygyra lamellina, in the Philippines. BBD has been observed but not quantified on reefs of the Great Barrier Reef (GBR) and Fiji (Miller 1996; Littler and Littler 1996). As noted by Green and Bruckner (2000), there is a “relative scarcity” of records of coral diseases in the Pacific region compared with the Caribbean. The lack of reports of BBD from the GBR 1. could be related to a lack of studies specifically focused on BBD or to a genuine lack of BBD on these reefs. In this paper, I quantify for the first time the prevalence of BBD at one location within the GBR. Researchers have quantified BBD by describing the prevalence of the disease within coral communities and identifying susceptible coral species. Prevalence “refers to the number of cases of disease that exist, in a defined population, at some point in time” (Christie et al. 1997). The prevalence of BBD has been found to vary spatially and temporally. Surveys have recorded a range of 1% to 10% BBD-affected colonies within a population (Green and Bruckner 2000). Edmunds (1991) found that BBD prevalence in individual coral species at 7 locations in the Virgin Islands varied from 0% to 5.5%, with a mean of 0.25%. Dustan (1993) surveyed 19 reefs in the Florida Keys and found 6.2% of all colonies affected with BBD. The prevalence of BBD fluctuated from 0% to 3.2% on three different reefs in the Key Largo region (Kuta and Richardson 1996). The prevalence of BBD varies seasonally, with higher levels of BBD-affected colonies occurring during summer (Edmunds 1991). Coral taxa appear to have different susceptibility to BBD (Peters 1993). In the Caribbean region, coral species from the family Faviidae are most often affected with BBD (Santavy and Peters 1997). Faviidae are important framework corals and have the highest diversity in Caribbean reefs (Walton-Smith 1971). Diploria strigosa and Montastraea annularis are most often affected with BBD, with lower levels of infections in closely related species, Montastraea cavernosa, Diploria labyrinthiformis and Diploria clivosa (Antonius 1981b; Rützler et al. 1983). Non-faviid corals are also susceptible to BBD (Green and Bruckner 2000). Siderastrea siderea was thought to be resistant to BBD (Antonius 1981a). However, infections on this species were recorded in 1992 on reefs of Jamaica and this species is now frequently recorded with BBD (Bruckner et al. 1997). Natural infections of BBD have not been recorded on corals in the families Acroporidae and Pocilloporidae in the Caribbean region. Experimental inoculations conducted on acroporids from the Caribbean suggest they are able to resist the BBD pathogens (Antonius 1981b, 1985; Rützler et al. 1983). However, in aquarium studies in the Red Sea, BBD was transferred. EA. Dinsdale: School of Tropical Environment Studies and Geography, James Cook University, Townsville, Q. 4811, Australia. Email: elizabeth.dinsdale@jcu.edu.au.
(16) successfully to Acroporidae and Pocilloporidae after colonies were injured, suggesting that these species may be susceptible to the disease when stressed or injured (Antonius 1988b). If some species are susceptible to disease while others are not, there is a possibility for susceptible species to be lost from the community and be replaced by non-susceptible species. The different levels of affected colonies within certain taxa could indicate that these species are more susceptible to BBD. Four major coral diseases; black-band disease, white-band disease type II, white plague type II and Aspergillosis, have been described (Santavy and Peters 1997; Richardson 1998; Green and Bruckner 2000). The effects of diseases on coral communities have ranged from partial mortality of a few individuals to community-level changes (Edmunds 1991; Aronson and Precht 1997). White-band disease has caused profound effects on coral communities in the Caribbean region. Acropora palmata stands in the US Virgin Islands have been decimated by a combination of white-band disease (Gladfelter 1982) and hurricane damage (Bythell et al. 1993). D. strigosa and Porites species were the major corals recruiting after these events (Bythell et al. 1993), suggesting a community shift mediated by disease and disturbance. Aronson and Precht (1997) described a disease-induced replacement of the dominant shallow water coral Acropora cervicornis by the less dominant Agaricia species in Channel Cay, Belize. The aims of my study were to identify species of corals from the Great Barrier Reef that are susceptible to BBD and to determine the prevalence of BBD-affected colonies. I investigated whether the characteristics of BBD on the GBR are similar to those in the Caribbean region. The important characteristic of different levels of BBD-affected colonies between individual taxa was investigated by quantifying the prevalence of BBD in major coral families. Different susceptibility of coral species to BBD was investigated by comparing the number of individuals within a species to show signs of BBD when experimentally placed in direct contact with necrotic tissue.. Methods o. colony was defined as any autonomous coral skeleton with living tissue. BBD was identified in the field using these gross morphological characteristics: a black band of necrotic tissue abutting relative healthy tissue on one side and bare white skeleton on the other (Fig. 1). I quantified the number of BBDaffected colonies and the numbers of non-affected colonies in each transect. Fig 1. Acropora intermedia from Lizard Island affected with black-band disease, illustrating the typical gross morphological features of the disease. Apparently healthy tissue (H) is abutted by a black band of necrotic tissue (arrow), with white (W) skeleton denuded of tissue posterior to the necrotic band.. To analyze the distribution of BBD between the four sites at Lizard Island, the percentages of BBD-affected colonies were compared using a one-way analysis of variance (anova). A post hoc Tukey’s test was used to analyze if sites within habitats displayed similar prevalence of BBD (Underwood 1997). Due to the lack of normality in the data, an arc-sin square root transformation was performed prior to the analysis and homogeneity of variance was tested using the Levene statistic. Alpha level was set at P < 0.05. To analyze whether BBD-affected colonies were spread evenly between taxa, a Pearson chi-square test (Zar 1999) was conducted. Data were pooled for all sites, since there were no obvious groupings of sites from the Tukey’s test. To meet the assumptions of a chi-square test, it is necessary to minimize the number of cells with frequencies of less than five. Therefore, coral species were grouped into five categories; Acroporidae, Faviidae, Pocilloporidae, Poritidae and other Cnidaria (composed of the remaining scleractinian families, alcyonaceans, gorgonians and hydrozoans). A subdivided chisquare analysis with Yates’ continuity correction was performed to identify which coral family was causing the variation in levels of BBD prevalence (Zar 1999).. o. Corals on four reefs around Lizard Island (14 40'S, 145 28'E), Australia were surveyed for the presence of BBD during summer (January – February), 1994. Replicate belt transects (10 x1m) were surveyed on the reef crest of the four sites in 1 to 3m water depth. Seven to ten transects were laid haphazardly parallel to the shoreline, at South Island, Lizard Head, Osprey Island and Patch Reef. Within each transect, benthos in the categories Scleractinia, Alcyonacea, Gorgonia and Hydrozoa were counted. Coral colonies displaying signs of BBD were recorded and identified to species, when possible. For disease studies, the number of colonies in an area is usually recorded (Edmunds 1991; Kuta and Richardson 1996). A. To examine whether the different levels of affected colonies within a species were due to differences in susceptibility of that species, I compared the rate of infection of BBD on five individuals in each of eight coral species. It would be predicted that if a species was highly susceptible, all individuals would become affected with BBD. BBD was transferred by attaching a piece of BBD-affected A. hyacinthus to the experimental colony in the field. The necrotic area was placed in direct contact with a healthy colony, and fixed using plastic coated wire. Although care was taken not to injure the experimental corals, two control groups were established. In the first control group, five individuals from each species had a piece of healthy A..
(17) hyacinthus attached using plastic coated wire, to control for the effects of contact between corals. The second control group was a tagging control, where five individuals in each species were tagged and handled. The experimental group and two control groups were collected after 48 h and presence or absence of BBD was noted. The time period was chosen due to the rapid movement recorded for BBD (Rützler et al. 1983). Coral species used during the trial were, A. hyacinthus, and A. cuneata in the family Acroporidae; P. damicornis, and Seriatopora hystrix in the family Pocilloporidae; Hydnophora ridiga, and Platygyra daedalea in the family Faviidae; Symphyllia recta in the family Mussidae; and Porites lichen in the family Poritidae. Colonies used in this experiment were located 1 to 3m deep within a 30m2 area on a reef in the Lizard Island lagoon. The rates of transmission and levels of BBD-affected colonies recorded during the survey were compared to identify if differences in susceptibility between species were apparent.. Results Seventeen species of corals in five families (Pocilloporidae, Acroporidae, Faviidae, Poritidae and Mussidae) were affected by BBD in transects surveyed at Lizard Island (Table 1). Corals in the family Acroporidae and Pocilloporidae had 69 and 33 colonies affected with BBD. The species affected with BBD varied between sites. A. hyacinthus, A. millepora and P. damicornis were affected with BBD at all sites. A. intermedia was affected at Osprey Island and Patch Reef and Goniastrea retiformis, P. verrucosa and Acropora gemmifera were affected with BBD at South Island and Lizard Head. Four. additional species, Goniopora stokesi, Acropora polystoma, Acropora divaricata and Montipora tuberculosa, were recorded with BBD off-transect. Based on a sample size of 4569 corals, 2.8% of all colonies surveyed at Lizard Island were affected with BBD. The percentage BBD-affected colonies was variable between sites and ranged from 4.9% at South Island to 1.3% at Patch Reef (one-way anova MS=2.52*10-2, df = 3, F = 4.6, P<0.001). However, a Tukey’s test did not distinguish any patterns in BBD abundance between the sites. The prevalence of BBD was not spread evenly between the five coral families affected with BBD (chi-square test Χ2 = 54.266, df = 4, P < 0.001). Pocilloporidae had the highest level of affected colonies with 6.0% affected (Table 2). The subdivided chi-square analysis showed that Pocilloporidae colonies were affected at a higher rate than corals in the families Acroporidae, Poritidae and Faviidae (Χ2 = 6.546, df = 1, P < 0.05). The percentage of BBD-affected colonies was spread evenly between the Acroporidae, Poritidae and Faviidae (Χ2 = 2.125, df = 2, P = 0.346). This suggests that pocilloporid corals may be more susceptible to BBD than corals in other families. Apart from one BBD-affected colony in the family Mussidae on Lizard Head, other Cnidaria, such as alcyonaceans, gorgonians and hydrozoans, were not identified with BBD during this survey.. Table 1. Seventeen species were identified with black-band disease (BBD) on Lizard Island, suggesting multiple host species are a feature of BBD. The numbers of BBD-affected colonies compared with the numbers of unaffected colonies (in parentheses) are given for each site. The total number BBD-affected and unaffected colonies for each family are listed. Only BBD-affected colonies that were identified to species are listed. (NQ, species not quantified) Family. Species. Pocilloporidae Pocillopora damicornis Pocillopora verrucosa Stylophora pistillata Acroporidae Acropora hyacinthus Acropora intermedia Acropora gemmifera Acropora millepora Acropora microclados Acropora monticulosa Acropora florida Acropora microphthalma Acropora robusta Acropora humilis Acropora palifera Acropora sarmentosa Faviidae Goniastrea retiformis Favia matthaii Poritidae Mussidae. South Island. Lizard Head. Osprey Island Patch Reef. Total. 13(105) 3 (82) 5 (48) 5 (20) 18(459) 4 (114) 0 (11) 5 (58) 1 (29) 3 (3) 0 (16) 0 (1) 0 (0) 0 (0) 0 (10) 0 (0) 1 (7) 9(79) 4 (12) 1 (NQ) 3(38) 0(2). 16(203) 4 (111) 6 (53) 6 (33) 20(766) 5 (121) 0 (3) 3 (154) 1 (17) 0 (5) 2 (118) 1 (4) 0 (0) 0 (5) 1 (17) 0 (0) 0 (0) 6(115) 3 (23) NQ 4(155) 1(7). 3(111) 2 (77) 0 (0) 1 (17) 20(421) 5 (47) 4 (121) 0 (7) 2 (32) 0 (3) 0 (0) 1 (23) 2 (12) 2 (12) 0 (3) 1 (2) 0 (10) 0(167) 0 (18) NQ 0(72) 0(18). 33(549) 10 (311) 11 (102) 12 (79) 69(1905) 18 (339) 10 (180) 8 (224) 4 (94) 3 (15) 2 (134) 2 (35) 2 (19) 2 (17) 1 (43) 1 (20) 1 (21) 15(496) 7 (97) 1 (NQ) 7(336) 1(47). 1(79) 1 (41) 0(1) 0(9) 11(259) 3 (27) 6 (45) 0 (5) 2 (16) 0 (4) 0 (0) 0 (2) 0 (7) 0 (0) 0 (13) 0 (18) 0 (4) 0(90) 0 (54) NQ 0(71) 0(20).
(18) The percentage of BBD-affected colonies in each family varied with site (Table 2). High levels of affected colonies were found in the Pocilloporidae, Faviidae and Poritidae at South Island with lower levels at Lizard Head. The percentage of affected Pocilloporidae colonies was lower at Osprey Island and Patch Reef, and no affected colonies were found for the Faviidae or Poritidae. Similar percentages of BBD-affected colonies in the family Acroporidae were found at all sites (Table 2). Table 2. Percentage of black-band disease affected colonies in each family at each site. Family Pocilloporidae Acroporidae Faviidae Poritidae Other Cnidaria Total. South Island 8.3 3.9 11.4 7.9 0 4.9. Lizard Head 7.9 2.6 6.3 2.6 0.4 3.3. Osprey Island 2.7 4.5 0 0 0 1.9. Patch Reef 1.3 4.2 0 0 0 1.3. Total 6.0 3.6 3.0 2.0 0.1 2.8. BBD transferred to all nine species in the transmission experiment after a 48-hr period. Of the five colonies tested for each species, A. hyacinthus had four individuals affected with BBD, while P. damicornis, S. hystrix and H. ridiga each had three individuals that were affected. In the other five species, BBD only transferred to two individuals in each species. None of the individuals in the two control groups showed any signs of BBD. Only four control colonies showed the presence of white tissue areas and small patches of denuded skeleton, suggesting handling stresses were low. Discussion I have recorded 129 coral colonies from five scleractinian families affected with black-band disease at one study location on the Great Barrier Reef, out of a total of 4569 colonies surveyed. This would suggest that BBD affects coral communities on the GBR, as well as in the Caribbean region. Corals from the family Acroporidae in the Caribbean region appear resistant to BBD (Rützler et al. 1983; Antonius 1988a). In contrast, Acroporidae from Lizard Island are susceptible to BBD, with 14 species affected. The family Pocilloporidae has eleven species that occur on the GBR; of the five species present on transects three were susceptible to BBD. The high percentage of Pocilloporidae colonies affected with BBD (6.0%) suggests this family may be an important host for BBD on the GBR. A total of 2.8% of coral colonies were recorded with BBD during the survey at four sites around Lizard Island. The percent occurrence of BBD identified was more than the 0.25% of corals affected in US Virgin Island reefs (Edmunds 1991). However, other sites such as Floridian reefs (Dustan 1993) and Jamaican reefs (Bruckner and. Bruckner 1997) had 6.2% and 6.1% of BBD affected colonies respectively, higher than recorded for Lizard Island. Feingold (1988) reported that 13.8% of octocorals were affected over a two-year period on the Northern Florida Keys, which is substantially higher than the prevalence of BBD on Lizard Island. My study suggests BBD is evident within coral populations on Lizard Island and the percent of affected colonies is within the range of BBD reported in the Caribbean region. BBD often occurs seasonally, with the highest prevalence during the summer months (Edmunds 1991). The Lizard Island survey was conducted during the summer and therefore, may represent a maximum prevalence of BBD. Further surveys would be required to determine if seasonal variation also occurs on the GBR. BBD is characterized by affecting multiple species, and there is variation in the level of affected colonies within a species between reefs (Peters 1993; Bruckner et al. 1997; Green and Bruckner 2000). These trends of BBD were also evident during my study on Lizard Island. Pocilloporidae had high levels of affected colonies compared with Acroporidae, Faviidae and Poritidae. The level of affected colonies within families also varied between sites. Bruckner et al. (1997) found similar variation in levels of affected colonies, with M. annularis (morphotype I and II), D. clivosa and D. strigosa most frequently affected in sheltered habitats. Conversely, M. cavernosa and S. siderea were most frequently affected with BBD in fore-reef habitats. BBD transferred to all eight species in the transmission experiment and was found on a large number of species in a range of families during this and other surveys, suggesting that many species are susceptible to BBD. The levels of BBD-affected colonies recorded during a survey may depend on how BBD is transferred, not on differences in susceptibility of the corals. Research directed at testing susceptibility of species in different environments is required to understand the variation in levels of BBD-affected colonies between species. Substantial reduction in living coral tissue occurs with BBD (Bruckner and Bruckner 1997), and <5% to 30% of colonies affected with BBD will eventually die (Green and Bruckner 2000). Mortality can be estimated using the prevalence of BBD recorded during the surveys and the mortality range from the literature. Therefore, if 2.8% of colonies were affected with BBD around Lizard Island, it is estimated <0.14% to 0.84% of coral colonies could die due to the disease. Compared with catastrophic events like Acanthaster planci outbreaks (Moran 1986), hurricane damage (Woodley et al. 1981) or white-band disease (Gladfelter 1982), where 60% to 90% of coral colonies die, mortality due to BBD is probably low at Lizard Island. However, the time between catastrophic events may be greater than for BBD, suggesting BBD may be a chronic mortality agent..
(19) In conclusion, the survey of Lizard Island corals demonstrated that BBD affects coral communities on the GBR. BBD has multiple host species, with the level of affected colonies within a species varying between sites, similar to BBD in the Caribbean region. Corals in the family Acroporidae and Pocilloporidae are important host species on the GBR, in contrast to Faviid corals being important host species in the Caribbean region. The abundance of BBD at four sites surrounding Lizard Island was within the range of BBD recorded in the Caribbean region. Acknowledgments I would like to thank T.P. Hughes and L. Owens for their support and supervision. Thanks to V. Hall, L. Smith and C. Syms for assistance during fieldwork. This work was supported by grants from Australian Research Council to T.P. Hughes. Thanks to A. Baird, J. Wolstenholme and the Coral Ecology Discussion Group at James Cook University for their comments on the manuscript. This is contribution no. 185 of the Coral Group at JCU. References Antonius A (1981a) Coral Reef Pathology: a review. Proc 4th Int Coral Reef Symp 2: 1-6 Antonius A (1981b) The "band" diseases in coral reefs. Proc 4th Int Coral Reef Symp 2: 7-14 Antonius A (1985) Coral disease in the Indo-Pacific: a first record. PSZNI Mar Ecol 6: 197-218 Antonius A (1988a) Distribution and dynamics of coral diseases in the eastern Red Sea. Proc 6th Int Coral Reef Symp 2: 293-298 Antonius A (1988b) Black-band disease behavior on Red Sea reef corals. Proc 6th Int Coral Reef Symp 3: 145-150 Aronson RB, Precht WF (1997) Stasis, biological disturbance, community structure of a Holocene coral reef. Paleobiology 23: 326-346 Bruckner AW, Bruckner RJ (1997) The persistence of blackband disease in Jamaica: impact on community structure. Proc 8th Int Coral Reef Symp 1:601-606 Bruckner AW, Bruckner RJ, Williams EH Jr. (1997) Spread of black-band disease epizootic through the coral reef system in St. Ann’s Bay, Jamaica. Bull Mar Sci 61: 919-928 Bythell JC, Gladfelter EH, Bythell M (1993) Chronic and catastrophic natural mortality of three common Caribbean reef corals. Coral Reefs 12: 143-152 Christie D, Gordon I, Heller R (1997) Epidemiology. An introductory text for medical and other health science students. UNSW Press, Sydney Dustan P (1993) Developing methods for assessing coral reef vitality: a tale of two scales. In: Ginsburg RN, Compiler, 1994, Proceedings of the Colloquium on Global Aspects of Coral Reefs: Health, Hazards and History, Rosenstiel School of Marine and Atmospheric Science, University of Miami, 1993, pp. 38-44. Edmunds PJ (1991) Extent and effect of black-band disease on a Caribbean reef. Coral Reefs 10: 161-165 Feingold JS (1988) Ecological studies of a cyanobacterial infection on the Caribbean sea plume Pseudopterogorgia acerosa (Coelenterata: Octocorallia). Proc 6th Int Coral Reef Symp 3: 157-162 Garret P, Ducklow H (1975) Coral diseases in Bermuda. Nature 253: 349-350 Gladfelter WB (1982) White-band disease in Acropora palmata, implications for structure and growth of shallow reefs. Bull Mar Sci 32: 639-643 Green EP, Bruckner AW (2000) The significance of coral disease epizootiology for coral reef conservation. Biol Conserv 96: 347-361 Kuta KG, Richardson LL (1996) Abundance and distribution of black-band disease on coral reefs in the northern Florida Keys. Coral Reefs 15: 219-223 Littler MM, Littler DS (1996) Black-band disease in the South Pacific. Coral Reefs 15: 20 Miller I (1996) Black-band disease on the Great Barrier Reef. Coral Reefs. 15: 58 Moran PJ (1986) The Acanthaster phenomenon. Oceanogr Mar Biol Ann Rev 24: 379-480 Peters EC (1993) Disease of other Invertebrate Phlya: Porifera, Cnidaria, Ctenophora, Annelida, Echinodermata. In: Couch JA, Fournie JW (Eds.) Pathobiology of marine and estuarine organisms. CRC Press, Boca Raton, FL pp 393-449. Richardson LL (1998) Coral diseases: what is really known? TREE 13: 438-443 Rützler K, Santavy DL, Antonius A (1983) The black-band disease of Atlantic reef corals. III. Distribution, ecology and development. PSZNI Mar Ecol 4: 329-358 Santavy DL, Peters EC (1997) Microbial pests: coral disease in the Western Atlantic. Proc 8th Int Coral Reef Symp 1: 607612 Underwood AJ (1997) Experiments in ecology. Their logical design and interpretation using analysis of variance. Cambridge University Press, UK Walton-Smith FG (1971) Atlantic reef corals. University of Miami Press, Florida Woodley JD, Chornesky EA, Clifford PA, Jackson JBC, Kaufman LS, Knowlton N, Lang JC, Pearson MP, Porter JW, Rooney MC, Rylaarsdam KW, Tunnicliffe VJ, Wahle CM, Wulff JL, Curtis ASG, Dallmeyer MD, Jupp BP, Koehl MAR, Neigel J, Sides EM (1981) Hurricane Allen’s impact on Jamaican coral reefs. Sci 214: 749-755 Zar JH 1999 Biostatistical analysis. 4th Edition. Prentice Hall Inc. New Jersey.
(20) Ecology, 83(2), 2002, pp. 436–451 q 2002 by the Ecological Society of America. DETECTING REGIONAL VARIATION USING META-ANALYSIS AND LARGE-SCALE SAMPLING: LATITUDINAL PATTERNS IN RECRUITMENT T. P. HUGHES,1,6 A. H. BAIRD,2 E. A. DINSDALE,2 V. J. HARRIOTT,3 N. A. MOLTSCHANIWSKYJ,2,4 M. S. PRATCHETT,2 J. E. TANNER,2,5 AND B. L. WILLIS2 1Centre. for Coral Reef Biodiversity, Department of Marine Biology, James Cook University, Townsville, Queensland 4811, Australia 2Department of Marine Biology, James Cook University, Townsville, Queensland 4811, Australia 3CRC Reef Research Center, James Cook University, Townsville, Queensland 4811, Australia 4School of Aquaculture, University of Tasmania, Launceston, P.O. Box 1214, Tasmania 7250, Australia 5SARDI Aquatic Sciences, P.O. Box 120 Henley Beach, South Australia 5022 Australia. Abstract. Regional-scale variation of recruitment by marine organisms may reflect geographic patterns in adult stock sizes or fecundities, large-scale hydrodynamic features that influence the transport of larvae (e.g., currents, upwelling), and patterns of early mortality. In turn, recruitment may play a vital role in determining patterns of adult abundance and community structure, from local to biogeographic scales. We examined spatial variation in recruitment by corals at a regional scale, along 3300 km of the tropical and subtropical coast of eastern Australia (108–318 S). We used two complementary approaches: (1) a metaanalysis of 21 different studies undertaken over a 16-yr period, each of which was generally conducted at a single reef, and (2) a large-scale sampling effort in which recruitment was measured in two years on 33 reefs arrayed along the length of the Great Barrier Reef (GBR). Our goal is to compare the emergent large-scale picture derived from many small-scale studies with patterns revealed by shorter-term regional sampling. The two approaches show very similar large-scale patterns. Recruitment by spawning corals (mainly acroporids) was highest in the central GBR and declined steadily with increasing latitude by up to more than 20-fold. A smaller decline occurred on the northern GBR between Australian and Papua New Guinea. Recruitment by brooding corals (mostly pocilloporids) was greatest in the northern GBR and also declined to the south. The latitudinal decline in brooders was three- to fivefold, i.e., not as great as for spawners. Consequently, the proportion of brooded recruits increased to the south, and they generally exceeded spawners on the southern GBR and on isolated subtropical reefs at higher latitudes. Our meta-analysis shows that fully half of the variation in the ratio of spawners to brooders is attributable to one of 11 variables that we extracted from the published studies: the month when the recruitment panels were deployed. This result suggests that the intensity and timing of spawning have a crucial impact on large-scale patterns of recruitment. Elsewhere, we tested this hypothesis in the field, and confirmed that regional variation in recruitment by spawning acroporid corals was driven by spatial and temporal variation in the extent of mass spawning. Together, large-scale sampling and meta-analyses provide a powerful, combined approach for investigating large-scale patterns and the mechanisms underlying them. Key words: coral reefs; Great Barrier Reef; larvae; meta-analysis; population dynamics; recruitment; spatial scale.. INTRODUCTION The ability to compare and synthesize across studies is crucial for revealing general patterns and for scaling up from small-scale investigations to unveil regional or global phenomena. Meta-analysis (defined as the quantitative analysis of data that originated from several independent studies) provides major advantages over more traditional narrative syntheses and reviews (e.g., Hedges and Olkin 1985, Gurevitch and Hedges Manuscript received 10 January 2000; revised 2 February 2001; accepted 18 February 2001; final version received 9 April 2001. 6 E-mail: terry.hughes@jcu.edu.au. 1993). Following the lead from the social sciences (e.g., Glass et al. 1981) and medicine (e.g., Sachs et al. 1987), applications of meta-analysis to ecological data are becoming increasingly common (see recent overviews by Arnqvist and Wooster 1990, Osenberg et al. 1999). Regardless of whether the primary studies under investigation are descriptive or experimental, the underlying approach and objectives are the same: to quantify emergent patterns by applying statistical procedures, and to test for effects of ecological factors or methodology by analyzing subgroups of the overall data. A growing awareness of scale dependency, advances in technology (e.g., satellite imagery, supercomputers). 436.
(21) February 2002. LARGE-SCALE PATTERNS OF RECRUITMENT. and increasing concern for environmental issues (e.g., habitat fragmentation, global warming) are encouraging ecologists to focus more on larger scale phenomena (e.g., Dayton and Tegner 1984, Edwards et al. 1994, Rosenzweig 1995). However, most ecological experiments and measurements are undertaken at relatively small scales of space and time, using relatively small sampling units (Schneider 1994). Ecologists often implicitly extrapolate their results across scales, typically inferring large-scale patterns from smaller scale investigations that are logistically easier to conduct. Unfortunately, these extrapolations are invalid because numerous processes (e.g., dispersal, evolution) prevail at larger scales which cannot be explored locally in space or time (see, e.g., commentaries by Wiens 1989, Rosenzweig 1995, Thrush et al. 1997). Schneider et al. (1997) suggested several solutions: undertaking largerscale experiments (e.g., Carpenter 1990), combining or replacing small-scale experiments with large-scale surveys (e.g., Eberhardt and Thomas 1991), and iterative cycling between observation, small-scale experiments on components of a larger system, and refinement of theories on how the larger system works (e.g., Rastetter et al. 1992, Wiens et al. 1993). As yet, there is no clear consensus on how best to relate patterns and processes across multiple scales. Meta-analysis is likely to be a useful tool for detecting large-scale patterns that extend beyond the resolution or capability of conventional experimental and descriptive studies. Thus, the limited scale of focus of most ecological investigations does not preclude the detection of large-scale phenomena if results can be integrated across many studies. A classic example is the long-term dynamics of the birds of Great Britain, revealed by censuses conducted since the 1930s by thousands of members of the British Trust for Ornithology (O’Connor 1985, Taylor 1987). Similarly, biogeographers can ascertain even global-scale spatial patterns based on many localized censuses or surveys, each conducted at one or a few locations, often for different purposes and by many different individuals (e.g., Stehli and Wells 1969). In some cases, it may be feasible to examine large-scale processes or patterns in a single intensive study (e.g., Hughes et al. 1999, 2000). Whether the results emerging from a meta-analysis and a large-scale study would actually be similar is an interesting question. We are unaware of any such comparison in the ecological literature. In this paper, we set out to compare a meta-analysis of small-scale investigations with a single large-scale study. Comparing published studies would have been easy if they had all been done and reported in the same way. However, for reasons of logistics or personal choice, each one varied, often in ways that almost certainly affected the results. Our task therefore is to identify extraneous sources of variation in the data (e.g., due to methodology), account for them with statistical models, and explore the remaining variance that is at-. 437. tributable to the variables of interest. The large-scale pattern we investigated is the density and taxonomic composition of coral recruits along a 3300 km tropical– subtropical latitudinal gradient. Recruitment has a major influence on the size and composition of adult populations at all spatial scales (e.g., Gaines and Roughgarden 1985, Hughes 1990, Karlson and Levitan 1990, Caley et al. 1996, Connell et al. 1997, Hughes and Tanner 2000). Biogeographic patterns in the composition of coral assemblages (e.g., Stehli and Wells 1969) and their latitudinal limits (e.g., Crossland 1988) are likely to be strongly influenced by patterns of dispersal and recruitment. We focussed on the Great Barrier Reef and on isolated reefs to its south, where there have been 21 published reports on early recruitment by corals (on 18 separate reefs). In addition to these, we conducted a large-scale investigation of coral recruitment on 33 reefs from 108 S to 238 S, along the length of the Great Barrier Reef (Hughes et al. 1999, 2000). For convenience, we refer here to these two data sets as the small- and large-scale studies, respectively. Harriott and coworkers were the first to compare several small-scale studies to examine latitudinal patterns in the density and composition of coral recruits along the east coast of Australia (Harriott and Simpson 1996). Based on data from seven studies conducted between 168 S and 318 S (see Table 2 in Harriott and Simpson 1996), she concluded that ‘‘there is an apparent decline in the rate of recruitment of broadcasting (spawning) coral species with increasing latitude, with brooding corals being the dominant recruits at highlatitude sites’’ (quote from Banks and Harriott 1996). Similarly, Dunstan and Johnson (1998) stated that ‘‘the emerging picture (from the literature) is a transition from dominance of recruitment on settlement plates by (spawning) acroporids in central and northern regions of the GBR to dominance by (brooding) pocilloporids at the southern extremities of the GBR and on subtropical reefs to the south.’’ However, neither of these conclusions was based on a formal meta-analysis of the literature. These patterns, if they occur, raise important issues concerning the mechanisms involved, and their ecological, biogeographical, and evolutionary consequences. Similar large-scale gradients in recruitment of benthic organisms occur on coastlines elsewhere. For example, changes in the abundance and population structure of echinoids along the west coast of North America (Ebert and Russell 1988), and of barnacles, mussels, and starfish on the east and west of New Zealand (Menge et al. 1999) are due in part to patterns of upwelling and the delivery of larvae. Recent modeling studies by Connolly and Roughgarden (1998, 1999) indicate the potential effects of regional-scale variation in recruitment on latitudinal patterns of adult abundances and community structure. STUDY SYSTEM The Great Barrier Reef (GBR) is a continuous chain of nearly 3000 discrete reefs that stretches in a south-.
(22) 438. T. P. HUGHES ET AL.. easterly direction from 108 S to 238 S, along the coast of Queensland, Australia. Most of the reefs are 35–150 km offshore, depending in part on the width of the continental shelf. Isolated reefs and coral assemblages also occur south of the GBR, as far as Lord Howe Island (318 S), the southernmost coral reef in the world. The species richness of reef-building corals falls by ;25% between the middle and southern end of the GBR (to 245 species; Veron 1993). Eighty-seven of these extend 1100 km further south to Lord Howe Island (Veron and Done 1979, Harriott et al. 1995; T. P. Hughes, unpublished data). Patterns of water flow on the GBR are complex, largely because of the many gyres and eddies created by nearly 3000 reefs, and the effects of tides and variable winds. The main large-scale current flows westward towards Australia from the Coral Sea at 148– 188 S before bifurcating into a long-shore flow to the north and south (the Coral Sea Coastal Current and the East Australian Current, respectively; see Wolanski 1994). Corals can be classified into two reproductive groups, brooders and spawners. Brooders release sperm, but not their eggs, which are fertilized internally to form relatively large planulae. After their release, brooded planulae have a short precompetency period (when they are not yet capable of settling) ranging from minutes to 2 d, depending on the species (Harrison and Wallace 1990). However, planulae may remain competent for weeks if they are deprived of a suitable settlement surface (under laboratory conditions, see, e.g., Richmond 1987). The release of planulae in brooders usually follows a lunar cycle, for up to 12 mo/yr depending on species and location (see review by Tanner 1996). The most abundant brooders on the GBR are species of Pocilloporidae (Pocillopora, Stylophora, Seriatopora), members of the Acropora subgenus Isopora, and some species of Poritidae (Harrison and Wallace 1990). In contrast to brooders, broadcast spawners release both eggs and sperm, and fertilization is external. Most species of spawners on the GBR release their gametes in a multispecies spawning event which occurs over a period of a few days, in one or two months during the early austral summer (see Harrison et al. 1984, Babcock et al. 1986). Consequently, recruitment by most spawners is much more seasonal than brooders, with a major peak of settlement following closely after spawning (e.g., Wallace and Bull 1981, Wallace 1985a, Dunstan and Johnson 1998). The precompetency period of spawners is typically 3–7 d, more than twice as long as brooders. However, like brooders, broadcastspawned larvae can remain viable for weeks (e.g., Wilson and Harrison 1998). Over 85% of coral species on the GBR are spawners. Levels of gene-flow in corals along the GBR range from modest to low (particularly for brooders; Ayre and Hughes 2000), with minimal genetic exchange occurring between the GBR and Lord. Ecology, Vol. 83, No. 2. Howe Island (D. J. Ayre and T. P. Hughes, unpublished data). In this paper we conducted a meta-analysis of the existing literature to (1) quantify large-scale (latitudinal) patterns in recruitment by corals along the east coast of Australia, (2) measure regional changes in the proportion of recruit taxa, specifically brooders vs. spawners, and (3) compare patterns that emerge using the meta-analysis of small-scale investigations to those revealed by a single large-scale study. Our analyses points to the valuable role of meta-analysis in synthesizing results from many studies, but also highlights some limitations compared to large-scale investigations that are explicitly designed to examine regional phenomena. METHODS The small- and large-scale studies share a basic characteristic: they all involved the deployment of replicate artificial substrata (recruitment panels), which were subsequently retrieved and censused. To avoid bias in our selection of cases for the meta-analysis, we included any publications from the study region (east Australia) that examined recruitment by corals onto artificial panels attached to hard substratum. There are 21 such primary studies, published from 1985 to 1999. The universal metric reported in these studies (and in the large-scale study) is the density of coral recruits per panel. In most cases, recruits were also classified into taxonomic categories, which allows us to examine spatial variation in both their total abundance and composition. We first plotted regressions of recruitment vs. latitude, to compare the two data sets. Then we conducted a detailed meta-analysis of the small-scale studies to further explore sources of variation in recruitment (e.g., due to methodological differences).. Meta-analysis of small-scale studies Our task was to account for variation among previously published studies due to differences in methodology and latitude, using multiple regression models. We examined four dependent variables separately in the meta-analysis: total recruits per panel (all coral taxa combined), number of spawners, number of brooders, and the proportion of spawners to brooders. Analyses were done on both the mean number of recruits per panel, and the standardized number per 286 cm2 (the surface area of all panels in the large-scale study). The results were very similar, so we report here only on the latter. We recorded the following 11 independent variables for each small-scale study: the size and composition of panels; the method of deployment; the month, year, and duration of deployment; whether the deployment period included the month when mass spawning occurred; depth and habitat; distance offshore; and latitude. Many of these variables are correlated (see Results). We chose the following variables.
(23) February 2002. LARGE-SCALE PATTERNS OF RECRUITMENT. because they are very likely to have affected the amount of recruitment: 1) Panel size: Large panels should have a greater number of recruits, but they may have a lower overall density (due to ‘‘edge effects’’ which occur when new recruits are clustered close to the edge, presumably in response to gradients of light and water flow). 2) Panel composition: The chemical composition of recruitment panels and their rugosity or texture may affect patterns of settlement and early mortality (e.g., Harriott and Fisk 1987). The small-scale studies used six types of panels that were made of ceramic, fired clay, cement, PVC, and flat slices of dead corals. 3) Method of deployment: The published studies used three methodologies for the deployment of settlement surfaces (individual deployment of panels; panels bolted to racks side by side; panels attached to racks in vertical pairs, forming a ‘‘sandwich’’). 4) Duration: In any recruitment study, the longer panels are submerged the greater the opportunity for receiving multiple cohorts of larvae. However, losses of recruits due to post-settlement mortality will also be greater the longer panels are exposed. We recorded the duration of each study in weeks. 5) Month, year, and the timing of spawning: Temporal patterns of recruitment often reflect variation in the availability of competent larvae, e.g., in response to seasonal breeding cycles, or changes in hydrodynamic conditions (e.g., Babcock 1988, Milicich 1994, Hughes et al. 2000). We recorded the year and the month of initiation (when the panels were deployed) for each study. Whether or not the deployment included the month when mass spawning occurred (for that year and location) was recorded as a discrete variable, herafter called ‘‘spawning.’’ 6) Latitude, distance from shore, habitat, depth: The latitude and distance from shore were recorded for each of the 21 small-scale studies. We categorized the habitat of each study into three types (lagoon, reef crest, reef slope). Finally, we recorded depth as a continuous variable in meters. We used generalized additive regression models (GAM, see Hastie and Tibishirani 1990) to determine the best combination of these 11 factors that explained variation in total recruitment and recruitment by spawners and brooders separately. We first examined the correlations among the independent variables and the proportion of the variation in recruitment that was explained by each one on its own. Subsequently, we used a forward-backwards stepwise method to select the best subset and best sequence of predictors among the independent variables. At each step, we added to the model the next variable with the highest F value and lowest P value (provided P , 0.05). After the addition of each new variable, all existing variables in the model were rechecked to ensure that they still contributed appreciably to the fit, and variables with P , 0.05 were deleted. This process continued iteratively. 439. until no other variable remained which added significantly to the model. We constructed alternative models if at any stage it was unclear which variable to add or delete from the model (e.g., because of similar F and P values), and the completed models were compared using an analysis of deviance (F test). To examine variation in the proportion of spawners and brooders, we followed a similar procedure, except a binomial distribution (rather than a normal one) was used, and alternative models were compared using the x2 distribution. Five of the independent variables were continuous (size of panel, duration of deployment, depth, latitude, and distance from the shore), while four others were categorical (composition of panels, method of deployment, whether or not the deployment overlapped with the annual mass spawning, and habitat). The remaining two independent variables of the 11 we examined, the month and year of deployment, were entered as both continuous and categorical variables, and the one with the best fit was retained. Continuous variables were entered into the model as linear variables with one degree of freedom, or as nonlinear variables using spline functions with four degrees of freedom (if the GAM indicated that the nonlinear component was significant with P , 0.05). One degree of freedom fits a straight line whereas n degrees joins all points. Four produces ‘‘modest’’ smoothing (Hastie and Tibshirani 1990).. Independence of data The definition of an independent result is important, especially for selecting multiple observations arising from a single primary study. Data collected by the same person, on the same reef, and repeatedly over time, are unlikely to be statistically independent. However, identifying which data are spatially or temporally independent from the published literature is usually impossible, or at best very subjective and a potential source of bias (e.g., Downing et al. 1999, Englund et al. 1999). Operationally, meta-analysis of published results precludes rigorous testing for spatial and temporal autocorrelations, since the original raw data are usually unavailable. Because our aim is to explore the published data as much as possible, we used multiple results from each publication wherever we could, i.e., whenever different sets of panels were deployed as part of a single study at different sites, depths, or times. This approach to meta-analysis is not unusual as a descriptive tool, e.g., Goldberg et al. (1999) examined the relationship between competition and productivity in plants using a database of 296 cases from only 14 primary studies. Similarly, our meta-analysis is based on up to 253 cases from the 21 published studies.. The large-scale study The large-scale study examined variation in recruitment by corals at multiple scales, from meters to the length of the Great Barrier Reef (from 108 S to 238 S;.
(24) 440. T. P. HUGHES ET AL.. Ecology, Vol. 83, No. 2. FIG. 1. Map of the Great Barrier Reef (GBR), indicating the location of reefs where recruitment of corals has been measured by the large-scale study. Note the hierarchical design, with 18 reefs in five sectors sampled during 1995-1996 (1), and a further 15 reefs during 1996–1997 (2). Sectors of the GBR are each 250–500 km apart, numbered 1–5 from north to south. The Coral Sea extends eastward, offshore from the GBR.. Fig. 1). We used a hierarchical sampling design which allowed us to partition variation (using nested ANOVAs) among four spatial scales: i.e., among five adjacent sectors from north to south along the GBR, among three to six neighboring reefs nested within each sector, among four replicate sites on each reef, and among 10 recruitment panels deployed at each site (see Hughes et al. [1999, 2000] for these analyses). Deployments were done in two consecutive years, 1995/ 6 and 1996/7 (year one and two, respectively). In year one, we targeted 18 reefs. In year two, panels were. placed on 15 additional reefs. Thus, 40 panels were placed on each of the 33 reefs. Note that the panels were deployed on different reefs in separate years since our objective was to measure the effects of spatial scale rather than the predictability of recruitment at any particular site or reef (which would take many years to establish). To facilitate comparison with the small-scale studies, we report here on reef-scale patterns using the mean amount of recruitment (averaged for the 40 panels) on each reef plotted as a data point against latitude. In contrast to the small-scale studies, the method-.
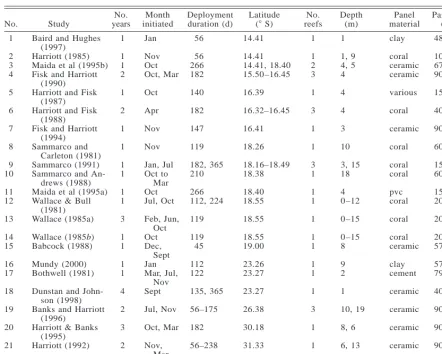
(25) LARGE-SCALE PATTERNS OF RECRUITMENT. February 2002. 441. TABLE 1. Attributes of the 21 small-scale studies used in the meta-analysis (see Fig. 1 for the locations) and of the largescale study.. No. 1. Study. No. years. Month initiated. 1. Jan. 1 1 2. Nov Oct Oct, Mar. 1. 13. Baird and Hughes (1997) Harriott (1985) Maida et al (1995b) Fisk and Harriott (1990) Harriott and Fisk (1987) Harriott and Fisk (1988) Fisk and Harriott (1994) Sammarco and Carleton (1981) Sammarco (1991) Sammarco and Andrews (1988) Maida et al (1995a) Wallace & Bull (1981) Wallace (1985a). 14 15. Wallace (1985b) Babcock (1988). 1 1. 16 17. Mundy (2000) Bothwell (1981). 1 1. 18. Dunstan and Johnson (1998) Banks and Harriott (1996) Harriott & Banks (1995) Harriott (1992) Large-scale study. 2. 2 3 4 5 6 7 8 9 10 11 12. 19 20 21. Deployment duration (d). No. reefs. Depth (m). Panel material. Panel size (cm2). 14.41. 1. 1. clay. 484. 56 266 182. 14.41 14.41, 18.40 15.50–16.45. 1 2 3. 1, 9 4, 5 4. coral ceramic ceramic. 100 675 900. Oct. 140. 16.39. 1. 4. various. 150–800. 2. Apr. 182. 16.32–16.45. 3. 4. coral. 400. 1. Nov. 147. 16.41. 1. 3. ceramic. 900. 1. Nov. 119. 18.26. 1. 10. coral. 600. 1 1. Jan, Jul Oct to Mar Oct Jul, Oct. 182, 365 210. 18.16–18.49 18.38. 3 1. 3, 15 18. coral coral. 150–158 600. 266 112, 224. 18.40 18.55. 1 1. 4 0–12. pvc coral. 150 200. 119. 18.55. 1. 0–15. coral. 200. 119 45. 18.55 19.00. 1 1. 0–15 8. coral ceramic. 200 576. 112 122. 23.26 23.27. 1 1. 9 2. clay cement. 572/286 79. 4. Feb, Jun, Oct Oct Dec, Sept Jan Mar, Jul, Nov Sept. 135, 365. 23.27. 1. 1. ceramic. 400. 2. Jul, Nov. 56–175. 26.38. 3. 10, 19. ceramic. 900. 3. Oct, Mar. 182. 30.18. 1. 8, 6. ceramic. 900. 2. Nov, Mar Nov, Dec. 56–238. 31.33. 1. 6, 13. ceramic. 900. 55–57. 10.28–23.38. 1. clay. 286. 1 1 3. 56. Latitude (8 S). ology of the large-scale study was standardized as much as possible so that nearly all of the 11 independent variables described above were controlled for (the major exception being latitude). In each year, the panels were deployed synchronously at all sites on all reefs, 10 d (61) before the predicted annual mass spawning of corals, and retrieved 8 wk later. This uniform duration allowed enough time for large numbers of corals to settle, and for recruits to grow to a sufficient size (usually 1–2 mm) to allow limited taxonomic resolution (generally at the family level). The habitat and depth was the same on all reefs: shallow reef crests, ;1 m below datum. The panels were identical, unglazed clay tiles (11 3 11 3 1 cm) attached individually to the substratum by a bolt that held them 2–3 cm above the reef surface. A total of 1135 panels (87%) were relocated using GPS at the 132 sites on the 33 reefs. The retrieved panels were bleached and recruits on all surfaces were counted using a dissecting microscope. Juvenile corals were identified to family (or genus where possible), and classified as spawners or brooders.. 33. RESULTS. Comparison of data sets The scope of the large- and small-scale studies was quite similar. The former is based on a total of 58 471 recruits on 1135 panels that were deployed on 33 reefs. The 21 published studies have a combined sample size of 47 682 recruits on 538 panels from 18 different reefs (Table 1). In the large-scale data set, 83% of the recruits were spawners and 17% were brooders. In the smallscale studies, 33 370 recruits (70% of the total) were classified into different taxonomic groupings. Of these, 61% were spawners and 39% were brooders. The higher proportion of brooders in the small-scale studies reflects differences in methodology compared to the large-scale data set, and the greater southerly range of the individual studies. As expected, there were huge differences among the small-scale studies in the 11 independent variables that we examined. For example, the censused surface area of panels was generally constant within studies, but.
(26) T. P. HUGHES ET AL.. 442. Ecology, Vol. 83, No. 2. varied 11-fold among them (from 79 to 900 cm2). Similarly, the duration of each study varied eightfold, from 6.5 to 52 wk. In comparison, the large-scale study used relatively small panels (121 cm2) and had a short, uniform duration of 8 wk. The small-scale studies were conducted in 14 of the 16 separate years between 1979 and 1994 (inclusive), with initial deployments in ten different months (none were in May or August, during the Austral winter). Ten of the 21 primary studies had deployment periods that did not include the peak summer mass spawning of corals. In contrast, the largescale study sampled only 2 yr, and the deployment was highly synchronized to precede the predicted mass spawning by 9–11 d. The depth range of the smallscale studies ranged from zero (intertidal) to 19 m, compared to a uniform 1 m depth for the entire largescale data set. The small-scale studies were located at muddy inshore sites, on mid- and outer-shelf reefs, and on oceanic islands up to 580 km offshore. In contrast, the large-scale study was restricted to midshelf reefs, roughly halfway between the Australian mainland and the edge of the continental shelf (see Fig. 1). The spatial array of study locations differed substantially between the large-scale and small-scale studies. Reefs in the large-scale data set were distributed in five to six sectors from north to south, more or less uniformly along the length of the GBR (Fig. 1). Not surprisingly, the regional spread of reefs comprising the small-scale data set was more haphazard (Fig. 2) since the individual studies were never designed to be a single sampling exercise. No reefs were sampled in the top 30% of the GBR to the north of Lizard Island (148409 S), while over two-thirds of the studies were conducted very close (,100 km) to Cairns or Townsville in the central portion of the GBR (roughly 178 and 198 S, respectively). Only three small-scale studies were undertaken on the southern 40% of the GBR to the south of Townsville, all of them on a single reef, Heron Island (238 S). Three additional studies were conducted south of the GBR (see Table 1), extending the small-scale data set from 148 to 318 S, compared to 108–238 S for the large-scale study. The geographic extent of the overlap between the two data sets is ;1000 km, or 98 of latitude.. cording to the large-scale study, recruitment peaked in the central portion of the Great Barrier Reef in both years, and declined to the north as well as the south (Fig. 3a, b). The smaller-scale studies did not sample the northernmost portion of the Great Barrier Reef, but they confirm the southerly decline and establish that the trend extends beyond the highest latitudes of the large-scale study to the southern limits of coral reefs in the Pacific Ocean. Recruitment by brooders also shows a north–south decline in both data sets (Fig. 3c), although the trend was not significant for the small-scale studies, with latitude explaining only 2% of the variation. In contrast, latitude accounted for a third of the variation in brooders in the large-scale study (adjusted r2 5 0.344, P , 0.001). Brooders did not decline as quickly to the south as spawners in either data set (compare Fig. 3b and c). Consequently, the proportion of spawners declined at higher latitudes (Fig. 4). In the middle twothirds section of the GBR (;128–208 S; Fig. 1), spawners predominated in the large-scale study, making up close to 90% of recruits. The southern and northern ends of the GBR both show a decline in numbers of spawners, with a corresponding rise in the proportion of brooders. Consequently, the proportion of spawners was highly correlated with latitude in the large-scale study (adjusted r2 5 0.330, P , 0.001, Fig. 4). The small-scale studies showed a much more variable and generally lower proportion of spawners than the largescale data set, but also exhibited a significant (but much weaker) trend for a greater proportion of brooders at higher latitudes (adjusted r2 5 0.048, P , 0.05, Fig. 4). In summary, both data sets reveal significant regional-scale variation in the amount and composition of recruits. Less variation in recruitment was explained by latitude in the small-scale data set, i.e., ‘‘unexplained’’ variation within latitudes was greater, particularly for brooders where the latitudinal signal was not statistically significant. Next we use meta-analysis to explore how methodological differences among the small-scale studies contributed to this large residual variation.. Latitudinal patterns of recruitment. Here we use as many cases as possible from the published papers, i.e., multiple deployments of panels at different sites and times were treated as replicates. We found highly significant, but generally weak, correlations among all of the continuous independent variables that we examined (Table 2). Of particular interest, latitude was confounded with the year that the study began (r 5 0.50, P , 0.001), the size of panels (r 5 0.37, P , 0.001), distance from shore (r 5 0.37, P , 0.001), depth (r 5 0.30, P , 0.001), the month of deployment (r 5 0.21, P , 0.001), and the duration of deployment (r 5 20.19, P 5 0.003). Specifically, compared to northern studies, those done in the south were. The large- and small-scale studies both reveal a steady 20-fold decline in total recruitment (all taxa combined) from approximately 148 S to the geographic limit of coral reefs, 2100 km to the south (Fig. 3a; adjusted r2 5 0.288, P , 0.01, and 0.246, P , 0.001, respectively). Recruitment by all taxa and by spawners exhibits a similar large-scale pattern, due to the numerical dominance of spawners (Fig. 3a, b). The largescale study shows a greater effect of latitude, which accounted for 29% of the variance in spawners compared to 20% in the small-scale data set. The trend, however, is not a simple north–south gradient. Ac-. Meta-analysis of small-scale studies.
(27) February 2002. LARGE-SCALE PATTERNS OF RECRUITMENT. 443. FIG. 2. Map of the Great Barrier Reef (GBR), indicating the location of reefs where recruitment of corals has been measured in 18 independent studies. A further three studies (not shown) conducted on islands to the south of the GBR at 268–318 S were also included in the meta-analysis (see Table 1 for details of the 21 studies).. generally undertaken in more recent years, using larger panels that were deployed further offshore and in deeper water, with deployments beginning later in the year and lasting on average for a shorter period. We first examined the effects of each of the 11 independent variables separately, and then entered them sequentially into multiple regression models. In the meta-analysis, latitude on its own explained less variation than the reef-scale regressions presented earlier (Fig. 3) because of the considerable within-reef scatter in the data. Consequently, only 5.7% of the variation in total recruitment (i.e., all taxa combined,. F1, 248 5 15.02, P , 0.001) and 7.3% of the variation in spawners (F4, 164 5 3.22, P 5 0.014) was explained by latitude. Moreover, there was no effect of latitude on the density of brooders (F4, 155 5 1.50, P 5 0.20). Therefore, a significant effect of latitude on the proportion of spawners to brooders (accounting for 11.9% of the variation, P 5 0.027) is attributable to a decline in spawners at southern sites rather than an increase in brooders. Recruitment was often related more strongly to individual variables other than latitude, particularly to those that measure temporal aspects of the deployment of panels. In contrast, three of the independent.
(28) 444. T. P. HUGHES ET AL.. Ecology, Vol. 83, No. 2. FIG. 3. Recruitment of corals vs. latitude along the east Australian coastline. Data from the large-scale study (left) and from 21 published studies (right, see Table 1). Recruitment (A) by all coral taxa; (B) by spawning corals; and (C) by brooders. Each point represents the mean number of recruits per panel on a single reef (all sites combined). ** P , 0.01, *** P , 0.001.. FIG. 4. The proportion of recruitment due to spawners vs. latitude, in the large-scale study (left) and in the 21 published studies (right). Zero on the y-axis represents 100% recruitment by brooders. * P , 0.05, *** P , 0.001..
(29) LARGE-SCALE PATTERNS OF RECRUITMENT. February 2002 TABLE 2.. 445. Pearson correlations among the continuous variables used in the meta-analysis of small-scale studies.. Variable. Latitude. Year Panel size Distance from shore Depth Month initated Duration. 0.497*** 0.372*** 0.372*** 0.299*** 0.205*** 20.194**. Year 0.543** 0.045 0.043 0.131 20.041. Panel size. Distance from shore. Depth. 0.038 0.036 0.227** 20.142*. 0.103 0.074 20.061. 0.149* 20.015. Month initiated. 20.087. Note: Based on 250 records of mean number of recruits per panel, i.e., spawners and brooders combined. * P , 0.05, ** P , 0.01, *** P , 0.001. Tests are two tailed.. variables we examined (the panel composition, method of deployment, and habitat) had no explanatory power for any recruitment measure (each accounting for ,2% of the variation, with P values usually .0.5), and were not considered further. Total recruitment was significantly correlated with the month and year of deployment, whether the deployment included the month of mass spawning (spawning), depth, distance from shore, duration and habitat, and latitude (Table 3a). Each of these variables on their own explained 3–10% of the variation in overall recruitment. Entering latitude first into our GAM analysis provided the best model. Once latitude was accounted for, spawning and then distance from shore explained an additional 7.4% and 10.0% of the variation, respectively (giving a total of 23.1%). These different percentages are both higher than the variation attributable to each variable on its own, because of the correlations between them (see Table 2). No other variable added significantly to the model beyond these three. The pattern for recruitment by spawners was broadly similar, reflecting their overall numerical dominance. The same three variables were important (distance from shore, latitude, and spawning), although their sequence in the model was different (Table 4). Each one explained slightly more variation than for the total recruits model, accounting for a combined total. of 29.9% of the variation in spawners. Thus, the metaanalysis confirms the latitudinal trends that were also detected by the large-scale study. In contrast, recruitment by brooders was correlated only with distance from shore and panel size (Table 5a). Distance from shore became nonsignificant when panel size was entered first into the multiple regression model (because it had the larger F value), and year became significant (F13, 154 5 1.95, P 5 0.029). Together, panel size and year explained 18.2% of the variation in number of brooders (Table 5b). There was no effect of latitude on recruitment by brooders, either on its own (F1, 167 5 1.9, P 5 0.11), or in combination with the other independent variables. In marked contrast, the large-scale study found a significant north– south decline in recruitment by brooders (Fig. 3c). Finally, variation in the ratio of brooders to spawners in the small-scale studies was explained most by the month of panel deployment, and by spawning (whether the deployment included the month of mass-spawning; Table 6). Obviously, these two are strongly correlated. Distance from the shore (P 5 0.008), latitude (P 5 0.027), panel size (P 5 0.029), and year (P 5 0.035), each accounted for 11–15% of the variation. None of these variables remained significant when the month of deployment was entered first into the additive regression model. This single variable accounted for almost. TABLE 3. Generalized additive regression models (GAM) showing the percentage variation in the total number of coral recruits in the small-scale studies that is attributable (A) to individual variables and (B) to sequential combinations of variables. Variable. F. P. Variation (%). 240 245 248 248 245 245 245 247. 3.04 4.65 15.02 13.79 3.41 3.13 2.85 4.04. 0.002 0.001 ,0.001 ,0.001 0.010 0.016 0.024 0.019. 10.24 7.06 5.71 5.33 5.27 4.86 4.45 3.17. 1, 248 1, 247 4, 243. 15.02 21.17 7.88. ,0.001 ,0.001 ,0.001. 5.71 7.44 9.98 23.13. Type. df. A) Individual variables Month initiated Year Latitude Spawning Depth Distance from shore Duration Habitat. discrete continuous continuous discrete continuous continuous continuous discrete. 9, 4, 1, 1, 4, 4, 4, 2,. B) Sequential combination of variables Latitude Spawning Distance from shore Total. continuous discrete continuous.
(30) T. P. HUGHES ET AL.. 446. Ecology, Vol. 83, No. 2. TABLE 4. Regression models showing the percentage variation in the number of spawned recruits in the small-scale studies which is attributable (A) to individual independent variables, and (B) to sequential combinations of variables. Variable. F. P. Variation (%). 160 164 164 164 167. 3.95 6.78 3.22 2.63 8.46. ,0.001 ,0.001 0.014 0.036 0.004. 16.48 14.19 7.28 6.03 4.82. 4, 164 1, 163 1, 162. 6.78 19.93 14.75. ,0.001 ,0.001 ,0.001. 14.19 9.35 6.38 29.92. Type. df. A) Independent variables Month initiated Distance from shore Latitude Year Spawning. discrete continuous continuous continuous discrete. 8, 4, 4, 4, 1,. B) Sequential combination of variables Distance from shore Latitude Spawning Total. continuous continuous discrete. half (47%) of the variation in the proportion of spawners in the small-scale studies. DISCUSSION. Meta-analysis of large-scale patterns Meta-analysis is a developing method for quantitatively synthesizing results across studies. Recent reviews and applications have emphasized its great potential, particularly in relation to experimental data, where studies can be compared in terms of a common metric of effect size (e.g., Gurevitch and Hedges 1993, Osenberg et al. 1999). Meta-analysis also has the potential to reveal large-scale patterns in space or time from smaller-scale descriptive data (e.g., Stehli and Wells 1969, O’Connor 1985, Taylor 1987). Our study is unusual because we have the capacity to compare such a meta-analysis with a large-scale study of the same system. The two approaches we used (large-scale sampling and meta-analysis) both have their strengths and weaknesses. One general conclusion revealed by our comparison is that ‘‘missing data’’ is likely to be a significant impediment to meta-analysis of regional-scale patterns. In many cases, the spatial extent and/or distribution of the small-scale studies will be unsuitable. for detecting latitudinal trends, since individual studies are not designed for this purpose. For example, a strong clustering of studies near centers of research would result in regression analysis of regional gradients being heavily influenced by a handful of points from poorly studied regions. In our study, the uneven distribution of reefs in the small-scale data set (Fig. 2) undoubtedly reflects the easier access to study sites that are located close to maritime centers (Townsville and Cairns), or to two major field research stations on the GBR (on Lizard and Heron Islands at 148 and 238 S, respectively). Furthermore, the hump-shaped pattern in recruitment by all taxa and by spawners from 108 to 238 S on the GBR (Fig. 3) could not be confirmed by the meta-analysis of small-scale studies because none of them extended further north than 148 S. Large-scale studies are more likely to have an evenly distributed spatial arrangement, and a hierarchical design and analysis will reveal small- and medium-scale variation as well as the overall, regional trend (e.g., Hughes et al. 1999, 2000). Undoubtedly, much of the unexplained variation in the small-scale studies is due to local differences from site to site within reefs, which cannot be partitioned out because the overall sampling ‘‘design’’ is not nested or balanced.. TABLE 5. Regression models showing the percentage variation in the number of brooded recruits in the small-scale studies which is attributable (A) to individual independent variables, and (B) to sequential combinations of variables. Variable. Type. df. F. P. Variation (%). discrete continuous continuous. 13, 155 4, 164 4, 164. 1.45 3.04 8.43. 0.140 0.019 0.004. 10.81 6.91 4.80. 1, 167 13, 154. 8.43 1.95. 0.004 0.029. 4.80 13.43 18.23. A) Independent variables Year Distance from shore Panel size. B) Sequential combination of variables Panel size Year Total. continuous discrete. Note: Recruitment by brooders was not significantly correlated with latitude. Year became significant once the effects of panel size were accounted for..
(31) LARGE-SCALE PATTERNS OF RECRUITMENT. February 2002. 447. TABLE 6. Regression models showing the percentage variation in the ratio of spawners to brooders in the small-scale studies that is attributable to individual variables. Variable. Type. Month initiated Spawning Distance from shore Latitude Panel size Year. discrete discrete continuous continuous continuous continuous. df 8, 1, 4, 4, 4, 4,. 151 158 155 155 155 155. P. Variation (%). ,0.001 ,0.001 0.008 0.027 0.029 0.035. 47.02 23.26 15.02 11.86 11.75 11.17. Note: Once the effects of month initiated was accounted for in multiple regression models no other variable remained significant.. The choice of which studies to include in a metaanalysis often has a critical effect on the patterns that emerge (e.g., Englund et al. 1999). Selection of studies is often subjective (e.g., based on a perception of the quality of the data, the amount of replication, experience of the authors, etc.), and there is an unfortunate tendency for bias towards choosing a subset of the available information which support a preconceived outcome (Mahoney 1977). Accordingly, we chose every available study of coral recruitment from the geographic region of interest. Another source of error in meta-analyses is the tendency for authors not to publish negative results (e.g., a nonsignificant experimental outcome), the so-called ‘‘file drawer effect.’’ This could also happen with descriptive data, e.g., if estimates of abundance that were zero or very low were not reported. We canvassed our colleagues working on recruitment of corals in Australia to rule out this possibility. It is no accident, however, that much of the literature on coral recruitment comes from the Great Barrier Reef, because rates of recruitment reported from elsewhere (e.g., in the Caribbean) are often much lower (e.g., Birkeland 1988, Richmond and Hunter 1990, Hughes et al. 1999, and references therein). Consequently, a paucity of published data from locations with very low recruitment would make a global metaanalysis problematical. In general, meta-analysis is unlikely to be fruitful where the range of the whole data set is small or where mean data values are close to zero. In our study, for example, meta-analysis detected the 20-fold latitudinal decline in the density of spawned recruits, but failed to resolve the more subtle regionalscale variation in brooders. The inclusion of multiple years (14 separate years over a 16-yr period) in the small-scale data set potentially provides a major advantage over the large-scale study, because a longer time-scale can reveal spatial patterns that are not wholly consistent among years. Furthermore, a multi-year meta-analysis can explicitly examine longer term temporal variation. In our analysis, the year of each study had no significant effect on total recruitment, recruitment by spawners, or the ratio of brooders to spawners (Tables 3a, 3b, 5), indicting that the regional-scale patterns are consistent over time. However, recruitment by brooders did vary significantly from year to year (Table 3b), which may. account for the failure of the meta-analysis to detect a consistent regional pattern. In contrast to the metaanalysis, the large-scale study was conducted only twice, in two consecutive years, one or both of which conceivably could have been unrepresentative. However, the patterns of recruitment in both years of the large-scale study were very similar (see Hughes et al. 1999, 2000), although this may well have been sheer good luck. Generally, the cost of large-scale sampling is substantial, which makes it difficult to repeat. Metaanalysis, on the other hand, by definition involves no new field costs since multi-year data can be derived from the literature. The main drawback of using small-scale investigations to detect regional patterns is the noise in the data due to differences in methods among published studies. In our analysis, these methodological differences (e.g., distance from shore, panel size, depth, etc.) had surprisingly modest effects (Tables 3–5), but this is unlikely to be generally true, especially where regionalscale trends are more subtle than the order of magnitude variation in recruitment that we examined. Furthermore, latitude was positively or negatively correlated with most of these variables (Table 2). This is likely to be a general (and undesirable) property of metaanalysis: a nonrandom spatial distribution of methodologies arising from different research teams in different locations. These correlations raise the possibility that any large-scale pattern detectable in small-scale studies could simply be due to regional variation in methodology rather than biology. Alternatively, regional patterns could be partially obscured by confounding methodologies. In our study, we explicitly accounted for differences in methodologies, and the concordance between the small- and large-scale data sets gives us some confidence in concluding that the latitudinal patterns in recruitment are indeed real. Moreover, we are beginning to understand some of the processes that are responsible for the regional trends (see Discussion: Mechanisms of large-scale recruitment variation). In summary, a large-scale study has numerous advantages over meta-analysis in terms of the comparability of data from different locations or census intervals. A single regional-scale study is also more likely to be developed in conjunction with predetermined sta-.
Figure


+7


Related documents
Our data are the first to show that an entire array of function- ally related genes normally involved in the implementation of mitotic functions is coordinately upmodulated by
HeLa cell-derived P4R5 Magi cells, which express human CD4, CCR5, and CXCR4, and sMagi cells were infected with SIVmac239wt, the SIVmac239 I324L variant, and the X4-tropic HIV-1
The over all survival of our patients was 67%. Local recurrence of associated with decreased over all survival among our patients. Local recurrence was noted in 20% of our
However, the predicted most stable secondary struc- tures of the monomeric minus strand of all the selected ran- domized mutants lacking L1-L2a complementarity do contain an
Multiple Indian Researchers (Albin Mathew, Sabitha Nayak, 2010; Vandana K 2012) conducted a randomized control study to assess the effectiveness of ambulation versus birthing
Estimation of slope for linear regression model with uncertain prior information and student-t error
Keywords and Phrases : Multiple regression model; Student-t errors; preliminary test and shrinkage estimators; bias, mean square error and relative efficiency; mixture distri- bution
Human T-cell lymphotropic virus type I (HTLV-1) transcriptional activator, Tax, enhances CREB binding to HTLV-1 21-base-pair repeats by protein-protein interaction. Zinc folds
Adenovirus Type 5 DNA Binding Protein Stimulates Binding of DNA Polymerase to the Replication Origin
Since DBP is a helix-destabilizing protein, it may be capable of unwinding the dsDNA terminus of the origin, thereby al- lowing efficient binding of the pTP-Pol complex, leading
