Rochester Institute of Technology
RIT Scholar Works
Theses Thesis/Dissertation Collections
7-2016
From Information Cascade to Knowledge
Transfer:Predictive Analyses on Social Networks
Biru Cui
Follow this and additional works at:http://scholarworks.rit.edu/theses
Recommended Citation
From Information Cascade to Knowledge
Transfer:Predictive Analyses on Social Networks
by
Biru Cui
A dissertation submitted in partial fulfillment of the
requirements for the degree of
Doctor of Philosophy
in Computing and Information Sciences
PhD Program in Computing and Information Sciences
B. Thomas Golisano College of Computing and
Information Sciences
Rochester Institute of Technology
Rochester, New York
From Information Cascade to Knowledge
Transfer:Predictive Analyses on Social Networks
by
Biru Cui
Committee Approval:
We, the undersigned committee members, certify that we have advised and/or supervised the candidate on the work described in this dissertation. We further certify that we have reviewed the dissertation manuscript and approve it in partial fulfillment of the requirements of the degree of Doctor of Philosophy in Computing and Information Sciences.
______________________________________________________________________________
Dr. Shanchieh Jay Yang Date
Dissertation Advisor
______________________________________________________________________________
Dr. Andres Kwasinski Date
Dissertation Committee Member
______________________________________________________________________________ Dr. Christopher Homan Date
Dissertation Committee Member
______________________________________________________________________________
Dr. Linwei Wang Date
Dissertation Committee Member
______________________________________________________________________________
Dr. Victor Perotti Date
Dissertation Committee Member
Certified by:
Acknowledgments
When I start writing this paragraph, the memory refreshes and reminds me the
moments happened in these past years. It is a long and short journey, a journey with
puzzle, confusion, frustration, starting over; a journey with friendship,
encourage-ment, happiness; and a journey will always remind me thatbe positive and don’t
give up.
It is much appreciated to have the guidance during the process of whole study,
my supervisor, my mentors and my friends: Dr. Shanchieh Jay Yang, Dr. Andres
Kwasinski, Dr. Linwei Wang, Dr. Chris Homan, Dr. Justin Domke, Dr. Pengcheng
Shi, Richard Tolleson, Charles Gruener, Emilio Del Plato, Haitao Du, Wenbo Wang.
I cannot achieve this without your support and help.
Finally, I would like to dedicate this dissertation to my parents, my wife, my
Abstract
From Information Cascade to Knowledge Transfer: Predictive
Analyses on Social Networks
Publication No.
Biru Cui, Ph.D.
Rochester Institute of Technology, 2016
Supervisor: Dr. Shanchieh Jay Yang
As social media continues to influence our daily life, much research has
fo-cused on analyzing characteristics of social networks and tracking how information
flows in social media. Information cascade originated from the study of information
diffusion which focused on how decision making is affected by others depending on
the network structure. An example of such study is the SIR (Susceptible, Infected,
Removed) model. The current research on information cascade mainly focuses on
three open questions: diffusion model, network inference, and influence
maximiza-tion. Different from these studies, this dissertation aims at deriving a better
under-standing to the problem of who will transfer information to whom. Particularly, we
want to investigate how knowledge is transferred in social media.
The process of transferring knowledge is similar to the information cascade
information from information container to users who do not have the information.
The study first works on understanding information cascade in term of detecting
information outbreak in Twitter and the factors affecting the cascades. Then we
analyze how knowledge is transferred in the sense of adopting research topic among
scholars in the DBLP network. However, the knowledge transfer is not able to be
well modeled by scholars’ publications since a “publication” action is a result of
many complicated factors which is not controlled by the knowledge transfer only.
So, we turn to Q&A forum, a different type of social media that explicitly
con-tain the process of transferring knowledge, where knowledge transfer is embodied
by the question and answering process. This dissertation further investigates
Stack-Overflow, a popular Q&A forum, and models how knowledge is transferred among
StackOverflow users. The knowledge transfer includes two parts: whether a
ques-tion will receive answers, and whether an answer will be accepted. By investigating
these two problems, it turns out that the knowledge transfer process is affected by
the temporal factor and the knowledge level, defined as the combination of the user
reputation and posted text. Take these factors into consideration, this work proposes
TKTM (Time based Knowledge Transfer Modeling) where the likelihood of a user
transfers knowledge to another is modeled as a continuous function of time and
the knowledge level being transferred. TKTM is applied to solve several predictive
problems: how many user accounts will be involved in the thread to provide answers
and comments over time; who will provide the answer; and who will provide the
accepted answer. The result is compared to NetRate, QLI, and regression methods
Table of Contents
Acknowledgments iii
Abstract iv
List of Tables xi
List of Figures xiii
Chapter 1. Introduction 1
1.1 Knowledge Mining in Social Network (Static) . . . 1
1.2 Information Cascade in Social Network (Dynamic) . . . 3
1.2.1 What is Information Cascade . . . 4
1.2.2 Diffusion Models . . . 5
1.2.3 Network Inference . . . 7
1.2.4 Influence Maximization . . . 8
1.2.5 Influence Estimation . . . 9
1.3 Knowledge Mining in Q&A Forum . . . 9
1.4 Research Problem . . . 11
Chapter 2. Information Flow Detection 13 2.1 Influence Maximization . . . 13
2.2 Sensing Security Vulnerability by using Twitter . . . 14
2.2.1 Problem Definition . . . 15
Reward Functions . . . 17
Total Reward . . . 19
Greedy Algorithm . . . 20
2.2.3 Experiment Design & Result . . . 21
2.2.4 Summary . . . 23
Chapter 3. Information Cascade Prediction 25 3.1 Introduction . . . 26
3.2 Conflicting Observations on Cascade Size Distribution . . . 28
3.3 Phase-Transition and GPC . . . 30
3.4 What Affects the Cascade Size? . . . 33
3.4.1 Temporal Factor . . . 33
Information Attractiveness . . . 33
3.4.2 Spatial Factors . . . 34
Infection at Different Locations . . . 34
Number of Infected Friends(Parents) . . . 35
3.5 Aggregate Cascade Model . . . 35
3.6 Summary . . . 38
Chapter 4. Individual Knowledge Adoption Prediction 39 4.1 Introduction . . . 39
4.2 Influence Factors for Research Topic Adoption . . . 41
4.2.1 Direct Observation . . . 41
4.2.2 Indirect Observation . . . 42
Connections . . . 42
Topic Popularity . . . 42
4.3 Model Formulation . . . 43
4.3.1 NetInf* . . . 43
4.3.2 HetNetInf . . . 44
4.4 Experiments . . . 46
4.4.1 The Dataset and Experimental Setting . . . 46
4.4.2 Prediction Study . . . 47
Chapter 5. Knowledge Propagation Network 53
5.1 Introduction . . . 53
5.2 Q&A forum: StackOverflow . . . 57
5.2.1 Dataset Description . . . 58
5.2.2 User Network . . . 59
5.2.3 Properties . . . 60
Reputation . . . 61
Thread Life Time . . . 62
5.3 Factors affecting knowledge transfer . . . 64
5.3.1 Questioner: Whether a Question will Receive Answers . . . . 64
5.3.2 Answerer: Which Answer will be Selected? . . . 65
5.4 TKTM (Time based Knowledge Transfer Modeling) . . . 68
5.5 Community analysis with TKTM . . . 74
5.6 Evaluation on TKTM . . . 77
5.6.1 Task1: Thread Size Prediction . . . 77
Thread Size Estimation with Regression . . . 78
Thread Size Prediction with Link Weight . . . 78
Result . . . 80
5.6.2 Task2: Thread Size Prediction over Time . . . 82
5.6.3 Task3: Individual Action Prediction . . . 84
5.6.4 Task4: Who will Provide the Accepted Answer . . . 86
5.6.5 TKTM & Semantic Analysis . . . 88
5.7 Summary . . . 91
Chapter 6. Conclusion 92 Appendix 95 Appendix 1. Datasets 96 1.1 DBLP . . . 96
1.2 Digg Network . . . 97
1.3 Twitter Network . . . 99
Appendix 2. Network Analysis 102
2.1 Terminologies . . . 102
2.2 Random Networks . . . 102
2.2.1 Poisson Random Network . . . 102
2.2.2 General Degree Distribution Random Network . . . 104
2.3 Giant Component . . . 105
2.4 K-core size Estimation . . . 107
2.4.1 Methodology . . . 107
2.4.2 Example . . . 109
List of Tables
3.1 Independent cascade generation process . . . 29
3.2 Aggregate cascade generation process . . . 37
4.1 Topic Adoption Prediction Performance . . . 49
4.2 Individual Features Weight . . . 50
5.1 Q&A forum Terminologies . . . 57
5.2 Datasets Summary . . . 59
5.3 Statistics related to accepted answers . . . 63
5.4 Features for predicting #answers. . . 65
5.5 Features for classifying whether an answer will be accepted . . . 66
5.6 MSE of estimation on Q&A thread size . . . 81
5.7 Estimation on Answerer in MRR . . . 85
5.8 Algorithm of estimating who will provide accepted answer . . . 87
5.9 Estimation on Answerer in MRR . . . 87
5.10 Prediction on Answerer in MRR with differentγ . . . 90
1.1 DBLP:Author . . . 96
1.2 DBLP:Paper . . . 97
1.3 DBLP:Citation . . . 97
1.4 DBLP:Term . . . 97
1.5 Digg:Users . . . 98
1.6 Digg:Friendships . . . 98
1.8 Twitter:Users . . . 99
1.9 Twitter:Friendships . . . 99
1.10 Twitter:Tweets . . . 100
1.11 StackOverflow datasets . . . 101
2.1 Terminology List . . . 103
2.2 GPC(k-core) size . . . 110
List of Figures
1.1 Cascades with different number of seeds . . . 6
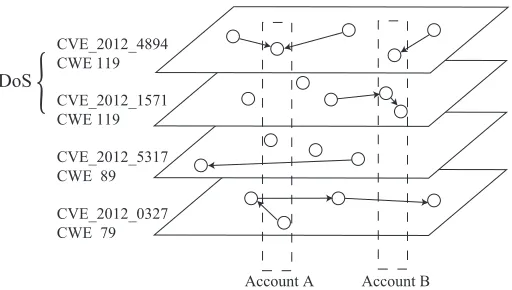
2.1 Each layer stands for a CVE topic; each CVE has a CWE type which belongs to a category. Circles in layers are tweets. Each user may publish tweets among topics. . . 17
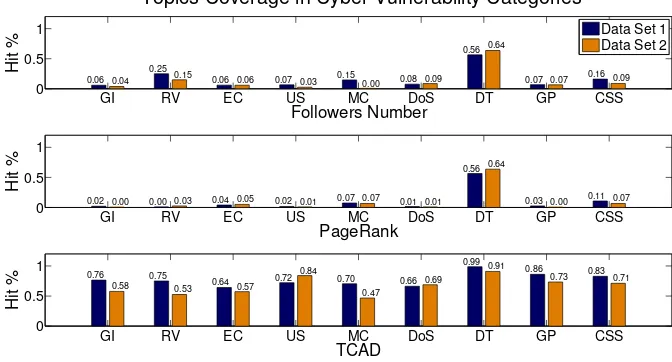
2.2 Topics coverage of selected accounts in security vulnerability cate-gories . . . 22
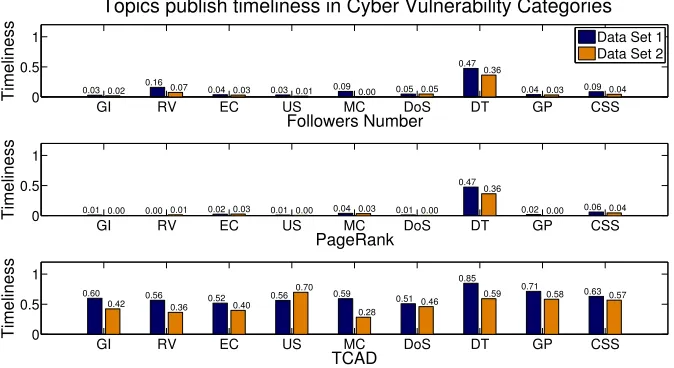
2.3 Topic publish timeliness of selected accounts in security vulnera-bility categories . . . 23
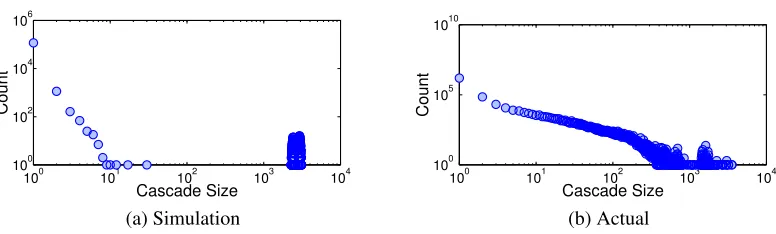
3.1 Cascade size distribution . . . 30
3.2 Cascade size distribution with different uniform infection probabil-ityλ . . . 32
3.3 Number of seeds emerged over time . . . 34
3.4 Exponential fitting of the decay of the infection probability at dif-ferent locations . . . 35
3.5 Distribution of the infection waiting time in the Digg network dataset 36 3.6 Cascade size distribution with the aggregate cascade generation al-gorithm . . . 38
4.1 Individual Popularity . . . 43
4.2 Prediction Performance . . . 49
4.3 Prediction Performance . . . 49
4.4 Feature Weight Distribution . . . 50
4.5 Feature Weight Distribution . . . 50
5.2 Degree Distribution of user network . . . 60
5.3 Distribution of user reputation . . . 61
5.4 Distribution ofTca . . . 62
5.5 Importance of Features . . . 67
5.6 Network with TKTM . . . 75
5.7 Distribution of actors’s reputation, closeness and activeness . . . 76
5.8 Thread Size Distribution . . . 82
5.9 MSE of prediction over time (answers only) . . . 83
5.10 Prediction on Answerer in MRR with differentγ . . . 90
2.1 Poisson Random Network Giant Component Size According . . . . 106
2.2 Graphic solution of u . . . 109
Chapter 1
Introduction
As social media continues to influence our daily life, much research has
fo-cused on analyzing characteristics of social networks and tracking how information
flows in social media. Information cascade is one important component of the
so-cial network analysis. In general, soso-cial network analysis can be grouped into two
categories: static information mining and dynamic information mining, where
in-formation cascade belongs to the later.
1.1
Knowledge Mining in Social Network (Static)
Social network is a heterogeneous network where each node is linked into different
networks based on different properties. For example, an author can be linked into
network based on co-author, and can also be linked into the network of whether two
authors joined the same conference. Most work in this category focus on how to
leverage the rich heterogeneous network information to mine knowledge which is
Existing research can be grouped into following categories:
• Ranking & Clustering Using bibliography network as an example, there
are links between author-paper, paper-venue, author-venue. Sun et al. [1]
used meta-path to define the social connections. In [2], Sun et al.learned
the weights of meta-paths, and further use these meta-path for clustering.
Clustering is also combined with ranking to achieve better performance. Sun
et al. [3] did the ranking and clustering together in bibliography network
based on the concept that authors’ rank distributions on different clusters
should be very different. Ji et al. [4] solved the same problem with a little
different approach where they believe object’s rank in a class is dependent on
its linked features’ rank in the same class.
• Object Reconciliation (Similarity) Sun et al. [5] defined the similarity of
two authors as the meta-path between them. Given the adjacency matrix of
author-venue is Wac, the meta-paths between authors is Wac ×(Wac)T. In
this case, authors are similar if they attend same venues same times.
• Link PredictionLink prediction is another big topic which attracts many
re-searchers. There are, in general, two approaches: supervised learning and
unsupervised learning. Sun et al. [1] analyzed the coauthor probability for
two authors who never coauthor before. They derived social connection
fea-tures to learn a model which best fits coauthor events with max likelihood.
Since the link recommended is the link which has high probability to access,
function to assign edge weights, such that a random walker is more likely to
visit the nodes to which a new link will be created. This function assigns high
weight for node pairs where links is going to be created in the future; and low
weight for node pairs with no link. Heterogeneous network connections are
inputted as features to train the function.
Other unsupervised learning methods in link prediction include: CN
(com-mon neighbors) [7], AA(each CN is weighed by its degree) [8], JA (CN
over their all neighbors) [8] [9], PA (similarity of two nodes is evaluated
by the product of their degree) [10] [7]. Yang et al.[11] proposed a
Multi-Relational Influence Propagation(MRIP) model based on the intuition that
influence propagates through all types of links. The distribution of influence
on these links depends on the correlation between them. A new link is
rec-ommended as the node pair which has high likelihood to pass the influence.
Goyal et al. [12] proposed another unsupervised learning algorithm to
esti-mate the link strength by measuring the ratio of same actions performed by
two actors. Sun et al.[13] further tried to predict when the new link will be
created.
1.2
Information Cascade in Social Network
(Dynamic)
On the other hand, another branch of research is interested in investigating how the
or cascading. The study focuses on solving two problems: how does the
informa-tion propagate over the given network structure; how to infer the inherent network
structure based on information propagation observation.
1.2.1
What is Information Cascade
The study of diffusion models and network inference provides the foundation to
analyze the information cascade. Leskovecet al.[14] first discussed the cascading
behavior in blogs. They raised a fundamental question that how to model the
gen-eration of a cascade such that it is able to understand how blogs cite and influence
each other and old posts popularity drops over time. Blog is the container of posts;
and posts stand for the information. A cascade is defined as a tree structure where
it has a single starting post called cascade initiator with no-links to other posts. A
blog has a link points to another blog if its post refers (contains the url address)
to the second one’s post. Each original post creates a cascade, and the
informa-tion is propagated to other blogs by post referring. The observainforma-tion they found in
large set of blogs (2.5 million blogs, 21.3 million posts) is: most (97%) cascades
are trivial (isolated posts); only a very small number of cascades have relative
com-plex topologies; the distribution of cascade size is power-law. Similar observations
found in but not limited in [15], [16], [17], [18], [19], [20], [21], [22], [23], [24].
Fig. 1.1a shows a network topology, where each circle stands for a node named
from letter AtoQ. The directed edge from nodeitoj representsj is watching i’s
activities or j is a fan (or follower) of i, and j designates i as its friend. If i is
nodes; the digital number is the time a node is infected. The influence network
is composed of the nodes and the directed edges; and all possible cascades are
supposed to be explained by this influence network. The weight of directed edges
and how to learn the directed edges in some cases where the network structure is
unknown will be discussed in Chapter 4. Same to the cascade extracting method
of [14] and [25], if a node is infected with none of its friends infected before it,
this node is selected as the initiator or theseedof the cascade. Other membersof
the cascade are chosen by including infected nodes which are fans of the members
of the cascade and infected later than the existing members of the cascade. Fig.
1.1b shows the extracted cascades from Fig. 1.1a. NodeLbelongs to two cascades
originated from nodeHandQ. ThoughI is a fan ofK, sinceKis infected afterI,
Iis not influenced byK.
1.2.2
Diffusion Models
The purpose of this set of study is to model the information diffusion such that
the cascade can be estimated and predicted. The classic model of Influence model
are SIR and SIS models where Kermacket al.[26] define the population transition
between susceptible, infected, and recovered with immunity. Based on the similar
epidemic disease propagation concept, later works model the infection using
thresh-old model and cascade model. Kermacket al. [26] proposed the SIR (Susceptible,
Infected, and Removed) model to describe the disease infection process among
populations and to estimate the likelihood of an epidemic. Granovetteret al. [27]
E A D F G B H C J I L M K N P Q 1 2 3 4 5 6 9 7 8
(a) Network Topology
N A C H G I Q L K L K
[image:21.612.123.526.107.409.2](b) Extracted Cascades
Figure 1.1: Cascades with different number of seeds
it crosses a threshold. The influence each node receives is the accumulated link
weights from its infected friends. The node is infected once the received influence
crosses the threshold. In [28], Goldenberg et al.defines the cascade model that a
node is independently infected by its neighbor with a probability. Kempeet al.[29]
proved these two models, linear threshold model and probability model, are
sub-modular and can be solved with greedy algorithm which is bounded by 1 −1/e
approximation of the optimal. Gruhlet al.[30] characterized how topics propagate
from individual to individual, and used the theory of infectious diseases to model
Jaewon et al. [31] model the process of infection with a linear influence model
where the number of newly infected node after a new node being infected is
mod-eled as a linear function, such that the total infected nodes at each time point is the
summation of the infection function of all infected nodes. Leskovecet al.[14] also
proposed a simple cascade generation model based on this independent cascade
model. Leskovecet al.[24] developed meme-tracking tool to capture topic-threads
propagated among websites. Besides the social connection features of
heteroge-neous network, the information adoption could be also due to external influence
such as mass media. Myers et al.first discussed the external influence in [32].
Above models are time discrete, while other works extend it to continuous time
based. Gomez-Rodriguez et al.[33] proposed NetRate algorithm where each edge
is associated with an exponential time function. Du et al. [34] extended NetRate
by replacing the hazard function with a linear combination of kernel functions to fit
varies networks.
1.2.3
Network Inference
Previous set of work assume the influence network is known where the information
is propagated through this network. For example, a retweet in Twitter explicitly
shows the information spread from the original tweeter to the retweeter through
the established following relation. However, in practice, such influence network
structure may not be clear.
• Network Structure is Unknown Gomez-Rodriguez et al. [35] discovered
an approximation algorithm to best explain the time sequences the nodes
adopt information. They selected the edges with high weights where the edge
weight is the infection probability. Myerset al. [36] studied the generalized
network inference problem and solve it by transferring it to a equal convex
optimization problem. Gomez-Rodriguezet al.[33] defined the link weight
as NetRate which is decided by a time argument model. Netrate is learned by
fitting all cascades with max likelihood.
• Incomplete Cascade DataSadikovet al.[37] proposed a numerical method
to estimate the whole network properties with partial information diffusion
data. Similar work such as [38] where Kim et al.inferred the unobservable
part of network with partial known data.
1.2.4
Influence Maximization
Above works focused on building the influence model based on intact or partial
data. Another set of works discussed how to use the influence where the
applica-tion based on the influence propagaapplica-tion focused on how to maximize the effect by
selecting a small number of critical nodes to start the cascade. Most applications are
about how to maximize the influence. Kempeet al.[29] proposed an greedy method
to find the the initial seeds set to reach maximum influence which is the fundamental
work of this area. Leskovecet al.[39] proposed a greedy hill-climbing algorithm to
detect the information outbreak among blogs by monitoring less nodes and collect
much information as soon as possible. Chenet al.[40] analyzed the performance
1.2.5
Influence Estimation
The study of influence maximization also introduces another problem, i.e.,
influ-ence estimation. A critical step in the greedy algorithm of influinflu-ence maximization is
to estimate the influence of a node or a set. Kempeet al.[29] left it as an open
ques-tion of finding the exact influence, but noted that it can be approximated by Monte
Carlo simulation. However, a reasonable approximation requires a large number
of simulations (more than 10,000 times) for each seeds set. Subsequent studies
in-vestigate various approaches to speed up such estimates [39], [41], [42], [43], [44],
[45], [46], [47], by either decreasing the simulation times for Monte-Carlo-based
estimations or finding an alternative algorithm. Kimuraet al. [46] proposed two
closely related algorithms based on shortest paths. Chenet al.’s algorithm [47] is a
variant of the shortest path approach. Aggarwal [43] proposed a steady state spread
method to estimate the influence. Yanget al.[44] proposed another way to estimate
the influence by approximating the influence from in-neighbors as a linear
com-bination. While most research worked on cascade size estimation in infinite time,
Du [48] studied cascade size estimation within a time period. Cohen [49] proposed
algorithm based on sketched method which is able to estimate the influence scale
to huge network with billions of edges.
1.3
Knowledge Mining in Q&A Forum
Sec.1.1 and Sec.1.2 list the studies of mining knowledge in static heterogeneous
is the combination of these two that Q&A forum is a heterogeneous network and
knowledge transfer is one particular type of information propagation.
Yanget al.[50] worked on the problem of predicting whether a question will
receive an answer. Andersonet al.[51] analyzed the StackOverflow dataset where
they focused on predicting whether a Q&A thread will have long-lasting value,i.e.,
receive high or low pageviews in the future, and whether a question will receive
satisfied answer. Asaduzzaman et al. [52] investigated the unanswered questions
and tried to predict how long will a question be in unanswered state. Vasilescu
et al. [53] investigated how people’s behavior migrates from the mail-list to the
Q&A forum, particularly in StackOverflow; where they found users are more active
if they contributes to both mail-list and Q&A forum and they answers faster in Q&A
forum than in the mail-list. Hanrahan et al. [54] modeled the question difficulty
according to the waiting time of a question received the accepted answer, and users’
expertise with their reputation. To route question to its potential answerers, Chang
et al.[55] and Liet al.[56] proposed multiple metrics ranking algorithms to select
potential answerers; Zhou et al. [57] proposed a classification approach to route
question and investigated the results of different combination of features. Liuet al.
[58] investigated the importance of features extracted from question, questioner,
answers, and answerers in predicting the questioner’s satisfaction and solved as a
classification problem.
Many Q&A related studies worked on whether a question can be answered
and answered by whom. The classification is a common approach being utilized,
classification is able to find the relation between the features and the result, but
ignores the inherent process of how knowledge is transferred between users.
1.4
Research Problem
As discussed above, current research on information cascade mainly focused on
network inference, diffusion model, influence estimation and influence
maximiza-tion. Different from these studies, we are more interested in solving the problem
of who will adopt the information or who will join the cascade during the process
of the information propagation. Particular, we want to investigate how knowledge
being transferred between persons. Compared to conventional social media that
in-formation can be adopted by anyone which is more casual and mainly depends on
the same interests, the action reflected in knowledge propagation is also dependent
on the knowledge and expertise level of the person. The study is motivated to
com-bine the merits of the studies on these two fields to model the knowledge transfer
process and use the result to perform predictive analysis from an unique
perspec-tive. Thus, the research problem is: how to model the process of knowledge being
transferred among user accounts in social media, and the study tries to model
the process of knowledge being transferred in Q&A forum from the perspective of
information diffusion.
The following chapters will discuss these problems in detail. Chapter 2 and
Chapter 3 investigate the general information propagation problems; while Chapter.4
influ-ence maximization to find critical nodes in the Twitter network to detect the
out-break information as soon as possible. Chapter 3 analyzes the whole information
cascade’s trend and investigates what factors could affect the cascading process.
Chapter 4 investigates how knowledge (research topic) propagates among
schol-ars, and predict who will have relevant publication by incorporating social network
features among scholars. Chapter 5 works on the StackOverflow Q&A forum and
developed a time based knowledge propagation network to model how knowledge
Chapter 2
Information Flow Detection
2.1
Influence Maximization
Social media is a platform which connects people all over the world into a huge
network. Information can be generated at any position and flows to other parts of the
network. One direct application is viral marketing, where the purpose is to spread
the information (advertisement) to other people as many as possible, while keep
the cost (number of originators) within a constraint. In other words, to maximize
information influence.
Define the social network as a network graphG(V, E)which contains|V|=n
nodes and |E| = m edges. σ(·) is the influence function, whereσ(A)is the total
number of nodes activated when A is initial set 1. If every nodev has its weight
wv, let B denote the set activated by the process with initial activation A. Then
1Note, sinceAis a set but not a single seed, the max influence is for the total infection size, but
σ(A) = P
v∈B
wv. The cost of selecting the initial set Aisc(A). So, the problem is
generalized as:
max
A⊆V σ(A)subject toc(A)≤L (2.1.1)
whereLis the constrain (limitation).
The problem is NP-complete which is similar as clique problem. Basically, it
is to find setA fromV which gives the best/maximum gain. [29] is the most
fun-damental work in answering this question where Kempeet al.proved the influence
functionσ(·)is submodular,i.e.
σ(S∪v)−σ(S)≥σ(T ∪v)−σ(T) (2.1.2)
for all nodes v and all pairs of node sets S ⊆ T. This property of submodular
function guarantees the set found by the hill-climbing greedy algorithm
approxi-mates the optimum to within a factor of(1−1/e). The greedy algorithm is briefly
described as: start with an empty set, and repeatedly add a node that gives the
max-imum marginal gain. In this way, the original NP-hard problem can be solved with
a greedy algorithm.
2.2
Sensing Security Vulnerability by using Twitter
The intuition behind this part of work is whether the maximizing influence
algo-rithm can be applied to the security related area. The prevalence of Twitter provides
timely information in a concise format. Besides sharing people’s daily life or
to public when facing nature disasters. Sakakiet al.[59] first use Twitter as social
sensors to detect earthquakes in Japan. Every person who has a connection to
Inter-net can be a potential sensor which collects information and publishes on Twitter.
Similar uses can be applied to cyber security when new vulnerabilities or exploits
are discovered. Unfortunately, as the volume of tweets and the number of Twitter
accounts arise, research has shown that only a small portion of tweets are worth
reading [60]. The overwhelming number of retweets, duplicated data, and trivial
information makes this powerful social media less useful than it should be. So the
question is how to obtain most valuable information from least accounts and least
tweets in the most timely fashion for the cyber vulnerability related information in
Twitter.
2.2.1
Problem Definition
The problem may be formally described as follows. For a specific security
vulner-ability category (C), find the set of critical accountsS ⊂V so that the total reward
functionR(S)is maximized subject to the cost functionC(S) ≤ L. Later on, the
work will integrate the cost constraint into our total reward function and solve the
multi criteria problem heuristically.
max
2.2.2
TCAD (Twitter Critical Account Discovery)
The first challenge to identify critical accounts in a specific topic area, i.e.Cyber
Vulnerabilities for this paper, is to determine a filtering mechanism of tweets related
to the topic. In general, this requires an intelligent semantic processing, allowing to
determine not only the set of relevant tweets but also the context of the tweets. In
the context of Cyber Vulnerability, a well defined and relatively unambiguous set of
keywords is the Common Vulnerabilities and Exposures index (CVE xxxx xxxx),
an 8 digit number following ‘CVE’ - a dictionary of publicly known information
security vulnerabilities [61]. Using CVE tags as keywords finds tweets that are
explicitly addressing the cyber vulnerabilities, and allows this work to concentrate
on developing the algorithm that finds the critical accounts from the relevant tweets.
The semantic meanings of each tweets are not treated in this work and will be
addressed in future work.
Every CVE tag is assigned a CWE (Common Weakness Enumeration) type by
a third party organization [62], which defines a software security weakness. Several
CWEs make up a security vulnerability category. For example, CWE 119 (Failure
to Constrain Operations within the Bounds of a Memory Buffer) and CWE 20
(Im-proper Input Validation) belong to the same category that causes Denial-of-Service
(DoS). Fig. 2.1 illustrates the structure of CVE, CWE and security vulnerability
categories along with the Twitter accounts and retweet relationship using directed
edges.
CVE_2012_4894 CWE 119
CVE_2012_1571 CWE 119
CVE_2012_5317 CWE 89
CVE_2012_0327 CWE 79
DoS
[image:32.612.188.444.114.259.2]Account A Account B
Figure 2.1: Each layer stands for a CVE topic; each CVE has a CWE type which belongs to a category. Circles in layers are tweets. Each user may publish tweets among topics.
topic within a security vulnerability category, and tweets containing this CVE tag
are attached to this topic. Each node in Fig. 1 represents a tweet, an original or
a retweet. The directed edges reflects the retweet(s) cite the information from the
original tweet. Clearly, the original tweets is more timely than the retweets and
the time stamps further differentiate quantitatively the timeliness among all tweets.
Each Twitter account may post tweets on multiple topics. An account is considered
covering a topic if it publishes a tweet in that CVE tag. The more topic an account
covers using fewest and timely tweets, the more critical the account is. Three award
functions are defined as follows to address this multi-criteria problem.
Reward Functions
The reward functions are defined according to what expect to gain from the selected
Timeliness (RT). Given multiple tweets about the same news, the first one
reveal the information is highly valued, with descending value for tweets thereafter.
The reward functionRT for a tweetW published by account A in a CVE topicT is
defined as:
RT(A, W, T) = 1−
D(W, W0(T)) maxT∈CD(WL(T), W0(T))
(2.2.2)
whereW0(T)andWL(T)are the first and last tweet in topicT;D(W, W0(T)) de-fines the time difference between the tweetWandW0;maxT∈CD(WL(T), W0(T)) is the longest time period of CVE topics in categoryC.
Originality (RO). Though retweets help propagate information, it is still the
original tweets that are referenced. People also prefer the original tweets but not
the retweets. The intuition of rewardROis that a tweet’s originality is shared by all
of its retweets. This is similar to the way PageRank defines the relations between
web pages.
RO(A,W , T˜ ) =
RO(P, W, T)
˜
N(W) + 1 (2.2.3)
whereW˜ is a retweet of tweetW;N˜(W)is the total number of retweets forW;P
is the account for the original tweetW. This is a recursive definition.RO(A,W , T˜ )
defines the originality ofA’s retweetW˜ that splits the originality of its parent tweet
RO(P, W, T).
Influence(RF). If two tweets from accounts A and B contain the same
infor-mation, same time stamp and are all original tweets. A should be rewarded more
if its tweet has been retweeted by more accounts, implying more people are
of influence is defined in (2.2.4).
RF(A, W, T) =
˜
N(W)
N(T) (2.2.4)
whereN(T)is the total number of posts in the topicT.
Total Reward
With the three reward functions RT, RO, RF, the problem becomes finding
op-timal setS that maximizes the reward with multiple reward functions. Note that
it is possible to have two candidates sets S and S0, where RT(S) > RT(S0) but RO(S) < RO(S0). A common approach in solving such problem is to find the
Pareto-optimal with respect to the following objective function:
max
S⊆V
X
λ1RT(S) +λ2RO(S) +λ3RF(S) (2.2.5)
whereλi are weights to trade off the importance of the reward functions. As
men-tioned in Sec. 2.2.2, it is ambiguous to decide the reward of an account by selecting
a subset of these three reward functions. There is no reason to strengthen or weaken
one aspect reward. This work uses the same weights for the three rewards while
normalizing the rewards in[0 1].
Recall that the optimization should be subject to the cost of the selected
ac-counts. This work defines the cost to be the total tweetsN(A, T)published by each
selected account A on a topicT. This is equivalent to find the reward an account
T per post can then be written as:
R(A, T) = X
W∈T
RT(A, W, T) +RO(A, W, T) +RF(A, W, T)
N(A, T) (2.2.6)
For a setS, the total reward of this set on a topicT is:
R(S, T) = P
A∈SR(A, T)×N(A, T)
P
A∈SN(A, T)
(2.2.7)
The total reward obtained by selecting a set of accounts in a category is the
summation of the reward on all topics belong to this category. Then the reward by
selecting an account setSin a categoryCis:
R(S, C) = X
T∈C
R(S, T) (2.2.8)
Greedy Algorithm
Based onR(S, C)to selectK fromN Twitter accounts for the optimal total reward
could be computationally complex using a brute force approach which takes time
exponential inK, especially when N is huge. In fact N can be significant since
Twitter has reached 500 million active accounts in July 2012 [63]. R(S, C)is not
monotonic since by selecting an account who always posts outdated retweets may
decrease the totalR(S, C). It is also not submodular because it does not guarantee
∀S ⊆S0, A /∈S0, R(S∪A, C)−R(S, C)≥R(S0∪A, C)−R(S0, C). This work
developed a simple greedy algorithm, which exhibits outstanding performance. The
algorithm, independently executed for each category C, begins by selecting one
from the remaining set into S to maximize R(S,C). This greedy algorithm has a
complexity ofO(KN)that each round iterates left accounts and takesK rounds.
2.2.3
Experiment Design & Result
The experiment collected about 5,000 CVE related tweets between Sep 25 and Nov
2 of 2012. These tweets come from about 1,600 accounts and cover about 900 CVE
topics. Nine common security categories are selected according to [63]: GI (Gain
Information), RV (Reserved), EC (Execute Code), US (Unspecified), MC (Memory
Corruption), DoS (Denial of Service), DT (Directory Traversal), GP (Gain
Privi-lege), CSS (Cross-site Script). The collected data is divided into two sets, one for
selecting critical accounts, another for testing how selected accounts perform on
unknown data.
To evaluate the performance, TCAD is compared to two other approaches:
PageRank and number of retweeters. Account A is B’s retweeter if A has one
or more retweets from B. The same definition is used to define the directed links
between accounts for PageRank. Each approach selects top 10 critical accounts
per category. The performance is evaluated in terms of information coverage and
timeliness. The information coverage is defined as the topics mentioned by critical
accounts over the total topics in a category; the timeliness is defined as the
normal-izedRT(A, W, T)for allW ∈ C. Both of them are normalized in[0 1]. A higher
score stands for a better topic coverage or obtaining information earlier.
Figures 2.2 and 2.3 show the information coverage and timeliness achieved
the selected accounts, TCAD significantly outperforms the other two popularity
(retweeter) based algorithms. The only category the two popularity-based
algo-rithms not perform terribly is DT (Directory Traversal). The reasons is that there
are only 21 accounts in the collected data for DT, while there are typically hundreds
of accounts in other categories. Selecting 10 accounts out of 21 guarantees a
reason-able information coverage and timeliness. Coincidentally, the two popularity-based
approaches choose the same 10 accounts, which is why they have the same
perfor-mance in DT.
GI RV EC US MC DoS DT GP CSS 0 0.5 1 0.06 0.04 0.25 0.15
0.06 0.06 0.07 0.03 0.15 0.00 0.08 0.09 0.56 0.64
0.07 0.07 0.16 0.09
Followers Number
Hit %
Topics Coverage in Cyber Vulnerability Categories
Data Set 1 Data Set 2
GI RV EC US MC DoS DT GP CSS 0
0.5 1
0.02 0.00 0.00 0.03 0.04 0.05 0.02 0.01 0.07 0.07 0.01 0.01 0.56 0.64
0.03 0.00 0.11 0.07
PageRank
Hit %
GI RV EC US MC DoS DT GP CSS 0 0.5 1 0.76 0.58 0.75
0.53 0.64 0.57
0.72 0.84 0.70 0.47
0.66 0.69 0.99 0.91
0.86
0.73 0.83 0.71
TCAD
[image:37.612.147.483.314.495.2]Hit %
Figure 2.2: Topics coverage of selected accounts in security vulnerability cate-gories
Additional experiments are run to test the scenario where the two
popularity-based approaches are executed in a category agnostic manner, i.e.accounts are
se-lected by mixing all tweets from all categories. The results were worse or the same
GI RV EC US MC DoS DT GP CSS 0
0.5 1
0.03 0.02 0.16 0.07 0.04 0.03 0.03 0.01 0.09
0.00 0.05 0.05 0.47
0.36
0.04 0.03 0.09 0.04
Followers Number
Timeliness
Topics publish timeliness in Cyber Vulnerability Categories
Data Set 1 Data Set 2
GI RV EC US MC DoS DT GP CSS 0
0.5 1
0.01 0.00 0.00 0.01 0.02 0.03 0.01 0.00 0.04 0.03 0.01 0.00 0.47
0.36
0.02 0.00 0.06 0.04
PageRank
Timeliness
GI RV EC US MC DoS DT GP CSS 0
0.5 1
0.60
0.42 0.56 0.36 0.52 0.40
0.56 0.70 0.59 0.28
0.51 0.46 0.85
0.59 0.71 0.58 0.63 0.57
TCAD
[image:38.612.149.486.120.304.2]Timeliness
Figure 2.3: Topic publish timeliness of selected accounts in security vulnerability categories
found that “influential accounts hold significant influence over a variety of topics.”
Another interesting observation is that some critical accounts selected are Twitter
machines such as scripts which publish posts when there is a security alert. These
accounts may not be the preferred human expert accounts but do provide the most
valuable information the earliest.
2.2.4
Summary
The work presented in this chapter tries to connect the social network analysis to
the security vulnerability information sensing using Twitter. A Twitter Critical
Ac-count Discovery (TCAD) algorithm is developed to find critical acAc-counts for Cyber
Vulnerabilities based on rewards from three aspects: timeliness, originality and
TCAD algorithm outperforms both in information coverage and timeliness. The
results support our hypothesis that ranking or influence model focusing on node
popularity may not effectively capture information needed. Also, the critical
ac-counts selected from one security category can be very different to another, thus
suggesting that popular accounts across many categories may not be the best
Chapter 3
Information Cascade Prediction
As discussed in Sec.1.2, independent cascade model and linear threshold model
are two classical models well accepted in SNA. In brief, the independent cascade
model is defined as: a nodeu is infected at timet, it has a single chance to infect
each uninfected neighborsv with a probabilityPu,v. If usucceeds,v will become
infected at timet+ 1; otherwise,uwill not make any further attempts to infectv. In
linear threshold model, each nodevhas its thresholdLv, the incoming edge from its
infected neighboruis weighted asWu,v. The total influence the nodev received is
the summation of weights from all infected neighbors P
u∈K
Wu,v. If P u∈K
Wu,v > Lv,
the nodev will be infected. Given influence network and cascading model, a
cas-cade is sampled by randomly selecting an initial seed. Then the cascas-cade distribution
can be derived by sampling many times. The size of the cascade is the total number
of nodes involved. A subsequent question is what’s the cascade size distribution.
Both independent cascade model and linear threshold model are developed from
to estimate the epidemic. Thus, given the influence network and same initial seeds
randomly selection procedure, it is also interesting to see whether there is an
epi-demic of information propagation and what’s the epiepi-demic size (maximum cascade
size) by applying these cascading models.
3.1
Introduction
Leskovecet al.[14] discussed the information cascades in blogs, where a cascade
is defined as a DAG structure which has a single starting post called cascade seed.
Each node of the cascade is a blog post and a child node is any post that contains
the parent post’s URL. A blog has a link pointing to another blog if its post refers
(contains the URL) to the second blog’s post. Each seed creates a cascade, and the
information is propagated to other blogs by post referring. They found that most
(97%) cascades were trivial (isolated posts); only a very small number of cascades
contained multiple levels, and the distribution of cascade size follows a power law
where the cascade size is the total number of nodes involved in the cascade.
Sim-ilar observations were found in [17], [18], [19]. With these observations, existing
works attempted to develop cascade generation models to explain the cascade
pro-cess. Kermacket al.[26] proposed the SIR (Susceptible, Infected, and Removed)
model to describe the disease infection process among populations and to estimate
the likelihood of an epidemic. Thisinfectionconcept was borrowed and applied to
explain the information propagation. The infection is defined as the process where
a person adopts the information after being exposed to the information from her
a predefined threshold. The influence each node receives is the accumulated link
weights from its infected friends. The node is infected once the received influence
crosses the threshold. Goldenberget al.[28] defined an independent cascade model
that a node is infected by its friends independently with a probability. Leskovec
et al.[14] also proposed a simple cascade generation model based on this
indepen-dent cascade model. Besides modeling the cascade process, other studies attempted
to predict the cascade size. Given the initial cascade size, Chenget al. [18]
pre-dicted whether the cascade size could be doubled by including the temporal and
spatial features. They solved the cascade size prediction as a classification
prob-lem, but ignored the step-by-step propagation dynamics. Also, few of the
afore-mentioned studies noticed that the simulated cascade size distribution based on the
conventional cascade generation models are very different from the actual cascade
size distribution.
This part of work attempts to fill the gap by investigating the cascade size and
factors affecting the cascade size distribution. A phase-transition phenomenon is
found in simulated cascades on the Digg social network using the independent
cas-cade model where the size of a cascas-cade is either very small or very large. Also the
probability to have a large size cascade in the actual network is much smaller than
the one in the simulated cases. The work first developed the concept of GPC (Giant
Propagation Component) to explain the phase-transition phenomenon. While the
GPC exists in the social network, the phase transition is not observed in the actual
cascades. To explain the difference, this work hypothesizes that the cascade size
factors. Furthermore, a non-independent cascade model is proposed to explain the
information propagation through “dig/like” actions, where a node is not infected
independently by each of its infected friends, but makes the infection decision upon
the aggregated effects of its friends and other temporal and spatial factors.
3.2
Conflicting Observations on Cascade Size
Distribution
This section first exhibits the difference between the simulated cascade size
distri-bution and the actual cascade size distridistri-bution. For convenience, this work defines
parent and childto represent the friend’s relationship as: child → parent, where
childis watchingparent’s activities, andparent can infectchild. Table 3.1 shows
the independent cascade generation process which is similar to the cascade
genera-tion model of [14].
In Table 3.1,iis the infected parent ofj,Pij is the probability of nodei
infect-ing nodej. According to [12], Pij can be extracted based on the number of same
actions done by two nodes over the number of actions done byi. Each simulation
run generates one cascade. The experiment considers the Digg network as the
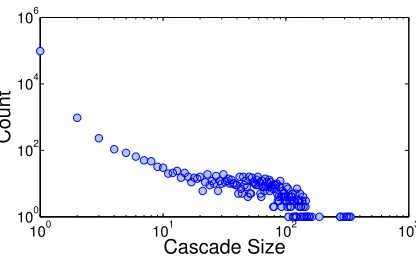
in-fluence network. The simulated cascade size distribution is shown in Fig.3.1a by
running the simulation 100,000 times. However, it is very different from the actual
cascade size distribution2 as shown in Fig.3.1b.
2The cascades are generated using the cascades extraction method specified in [14] on Digg
Algorithm 1Independent Cascade Generation Process
Initializeempty infected and susceptible list; randomly select a nodesas seed;
add each ofs’s uninfected childrenkinto the susceptible list associated with a probabilityPsk;
LoopWhile susceptible list not empty:
check the susceptible nodej against its associated probabilityPij;
if infected:
addjinto the infected list;
add each ofj’s uninfected childrenk0 into the susceptible list
associated with a probabilityPjk0;
removejfrom the susceptible list; End Loop
Table 3.1: Independent cascade generation process
There are two differences. The first difference is that there is a phase transition
in the simulation, but no such gap in the real cascade size distribution. Steeget al.
[17] observed similar phenomenon, where they assumed all link weights are the
same in their experiment. The second difference is that the probability to reach a
large cascade in the actual case is much lower, and the distribution is in a
power-law shape. The simulation has much higher probability (about 0.0134, 1338 out of
100,000 cascades) to have a large cascade (size greater than 2500) than the actual
100 101 102 103 104 100
102 104 106
Cascade Size
Count
(a) Simulation
100 101 102 103 104 100
105 1010
Cascade Size
Count
[image:45.612.132.520.124.241.2](b) Actual
Figure 3.1: Cascade size distribution
3.3
Phase-Transition and GPC
To explain the first difference, the phase-transition phenomenon, we introduce the
concept of GPC (Giant Propagation Component). The key point of the phase
tran-sition is that the cascade is either very large or very small. Intuitively, to have a
large size cascade, the propagation needs to keep on infecting new nodes at each
iteration,i.e., the probability of infecting at least one node must approach 1. Based
on the independent cascade model, the probabilityPi of a nodeiinfecting at least
one of its children is defined as:
Pi = 1−
Y
j∈N(i)
(1−Pij)≥1− (3.3.1)
wherePij is the probability of node i infectingj; N(i)is the set of children that
could be infected by i; is a very small number. The GPC is the maximally
con-nected component where all nodes of the component satisfy (3.3.1). If a node in
the GPC is infected, it will infect at least one other node with a high probability;
and this newly infected node will attempt to infect another new node. Thus, if any
infected with a high probability, and this number is proportional to the size of the
GPC3. Therefore, the existence of the GPC causes the phase-transition scenario in
that:
• If any node of the GPC is infected during the propagation process, the cascade
will reach a large size which is proportional to the size of the GPC plus the
number of nodes adjacent to the GPC in a high probability.
• If no node of the GPC is infected during the propagation process, the cascade
will die quickly and end with a small size.
The algorithm to locate the GPC is by continuously pruning nodes that do not
sat-isfy (3.3.1). In this way, the GPC found in the Digg network has 310 nodes with
= 0.01. 4 By selecting any node of the GPC as seed, it will infect most nodes
(about 290 out of 310) of GPC, and will eventually infect about 3000 nodes by
counting the adjacent nodes of GPC with relevant link infection probability. This
numerical estimation is close to the large cascade size of the simulation result shown
in Fig.3.1a. By checking all cascades in Fig.3.1b with size large than 2500, the
in-fected nodes include most nodes of the derived GPC. This also validates the
state-ment that the activation of the GPC is the necessary condition of a large cascade.
Since the GPC is related to the infection probability, we want to test whether
changing the infection probability will remove the phase transition. The following
3It is possible that all children of infected nodes are already infected, which will cause the
prop-agation to stop.
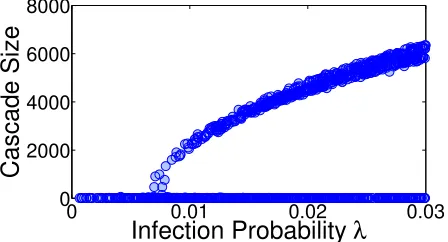
experiment assumes all links weights having the sameλ. Fig.3.2 shows the cascade
size distribution asλincreases. By increasing theλ, each node has a higher chance
to infect new nodes and the GPC size is larger, and thus, a larger cascade. The
phase-transition phenomenon disappears when λ is too small to support a GPC.
Though a low infection probability can eliminate the GPC and phase transitions, it
also greatly constrain the size of a cascade, where no cascade can be large. This
shows that changingλdoes not provide a solution to remove the phase transition.
0 0.01 0.02 0.03
0 2000 4000 6000 8000
Infection Probability λ
[image:47.612.197.421.288.409.2]Cascade Size
Figure 3.2: Cascade size distribution with different uniform infection probabilityλ
The primary issue that causes the GPC is the “independent” infection process.
This motivates us to investigate a non-independent cascade model to explain the
information propagation in the Digg network. This also accords to the “dig/like”
user experience in the Digg social network and Facebook. Intuitively, people make
the “dig/like” decision by reading the story and influenced by the aggregated result
of the parents “dug/liked” the same story, but not being infected independently by
3.4
What Affects the Cascade Size?
Besides the phase transition, the other difference is that the probability to reach
a large size cascade in the actual cascade size distribution is much lower than the
simulation’s based on the independent cascade model. In other words, a cascade can
reach a large size with only a very small chance. So what prevents a cascade to grow
large in the real world? To answer this question, we hypothesize that the infection
probability,i.e., the likeliness of being infected, is affected by several temporal and
spatial factors, and consequently affects the cascade size. The reason of selecting
temporal and spatial factors is based on the intuition that the propagation of the
information is dependent on whether the information is new (temporal) and whether
it is widely (spatial) known.
3.4.1
Temporal Factor
Each story in the Digg network has its lifetime, even for the most popular news. A
typical story in the Digg social network will not last for more than a week. This
motivates us to think about the attractiveness of the information may constrain a
cascade to propagate further. The attractiveness can be represented as the
informa-tion’s infection probability which will decay over time.
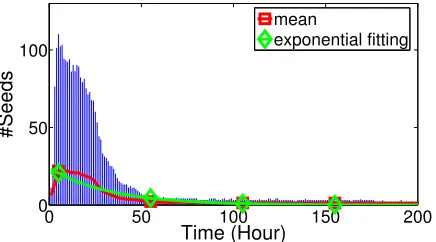
Information Attractiveness
The seeds are the nodes adopt the information without being influenced by other
along the time represents the attractiveness of the information. Imaging the
“infor-mation” as a virtual node, the seeds are infected by the information itself. Fig.3.3
shows the 5% ∼ 95% percentile of the number of the newly emerged seeds for
different stories over time. The red square-marker curve is the mean value, and
the green diamond-marker curve is the relevant exponential function fitting. These
curves show that the infection probability from the information itself to the
unin-fected nodes decays exponentially over time.
0 50 100 150 200
0 50 100
Time (Hour)
#Seeds
mean
[image:49.612.201.419.289.410.2]exponential fitting
Figure 3.3: Number of seeds emerged over time
3.4.2
Spatial Factors
Infection at Different Locations
Location is defined as the number of hops a node is away from the seed where the
information is originated. By monitoring the infection happened in thesame time
period, the dots in Fig.3.4 represents the normalized infection probability (defined
as the number of infected nodes over the total number of children could be infected)
at different locations. The infection probability is smaller if the infection happens
shows the fitted exponential function.
2 4 6 8 10 12
0 0.2 0.4 0.6 0.8 1
Location
Infection Probability
[image:50.612.219.398.146.247.2]data fitted curve
Figure 3.4: Exponential fitting of the decay of the infection probability at different locations
Number of Infected Friends(Parents)
Besides the location where the infection happens, another possible factor is the
infected parents. According to the independent cascade model [28], the conditional
infection probability increases exponentially with the number of infected parents.
However, Steeg et al. [17] observed that it is not true; the infection probability
almost keeps consistent regardless of the number of infected parents in the Digg
network. We repeated their experiment and verified the result. This also implies
that neither the independent cascade model nor the linear threshold model may be
applicable in the information propagation of “dig/like” actions.
3.5
Aggregate Cascade Model
Sections 3.3 and 3.4 discussed the reasons causing the two differences observed in
Fig.3.1. To overcome the limitation of the current independent cascade model, we
• The probability a node is infected depends on the time passed since the
infor-mation is originated.
• The probability a node is infected depends on the distance the node is away
from the seed where the information is originated.
• The infection is not triggered independently by each infected parent, but every
node assesses its situation to make infection decision only once; the time
when the node will assess the infection is defined by an infection waiting
time model.
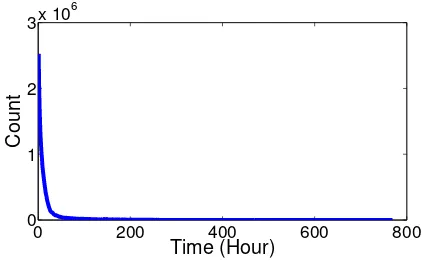
The infection waiting time model comes from the distribution of the infection
time difference between the parent node and its child. Fig.3.5 shows the waiting
time distribution extracted from the actual cascades of the Digg network.
0 200 400 600 800
0 1 2 3x 10
6
Time (Hour)
[image:51.612.208.419.415.546.2]Count
Figure 3.5: Distribution of the infection waiting time in the Digg network dataset
The waiting time distribution follows an exponential distribution µ1 exp(−x µ)
withµ= 9(Kolmogorov-Smirnov goodness-of-fit test, sample size 243483, critical
locationl and drawn from this distribution. Table 3.2 shows the aggregate cascade
generation model: In Table 3.2,K(j)is the set of infected parents which can infect
Algorithm 2Aggregate Cascade Generation Process
Initializeempty infected, accessed and susceptible list; randomly select a nodesas seed;
add each uninfected child into the susceptible list with a timertand its locationL;
LoopWhile susceptible list not empty:
if any timer of a susceptible nodejexpires:
assess nodej’s infection against the probability Pj = (|K1(j)|
P
i∈K(j)
Pij)∗exp(a∗t+b∗L);
if infected:
add nodej into the infected list; for each ofj’s uninfected childk:
ifknot in accessed list, addkinto the susceptible list with a timert and its locationL;
remove nodej from the susceptible list and addjinto the accessed list;
End Loop
Table 3.2: Aggregate cascade generation process
j and|K(j)|is the size of the set;a =−0.03, b =−0.2are derived from Sections
3.4.1 and 3.4.2 accordingly;t is the elapsed time since the moment information is
originated estimated by
L
P
l=1
δl;Lis the shortest distance of nodeito the seed through
the infected parents. Fig.3.6 is the simulated cascade size distribution based on the
aggregate cascade algorithm. The distribution is in a power-low like shape without
100 101 102 103
100
102
104
106
Cascade Size
[image:53.612.207.415.118.246.2]Count
Figure 3.6: Cascade size distribution with the aggregate cascade generation algo-rithm
3.6
Summary
The work presented in this chapter analyzes the difference of simulated cascade
size distribution based on the independent cascade model from the actual cascade
size distribution. GPC is introduced to explain the phase-transition phenomenon;
and temporal and spatial factors are investigated to adjust the infection probability.
Furthermore, a non-independent cascade model is proposed to better reflect the
essence of the information propagation of “dig/like” actions, where people make
information adoption decision based on the aggregated effects of its parents and
Chapter 4
Individual Knowledge Adoption
Prediction
4.1
Introduction
Information cascade has been well studied to explain how individuals adopted
infor-mation, but not as much to predict future cascades especially when the information
is new and possibly not quite relevant to past cascades. An individual adopts the
information when she receives enough influence from her infected neighbors [29],
one who already adopted the information, or randomly if the underlying decision
making process is unclear [29]. A set of work was developed to infer the inherent
influence network [35] [36] [33] based on a number of cascades; the influence
net-work inferred is the one which best fits all cascades. In general, the more cascades
the more accurate influence network one can recover.
The inferred influence network can recover the most likely influence flows
is unclear whether the future topic cascade can be explained by the distribution of
past ones, due to two reasons. First, past cascades can be limited to cover the
rela-tionships among all actors. Second, the new topic propagation could be irrelevant to
how past topics propagated. Though the topic cascade can be volatile and in many
cases there are not sufficient cascades available, thewayan author being influenced
to work on a new topic is relative stable; an author is likely to be influenced by her
colleagues or other researchers with social connections. These social connections
contain rich information describing different relationships between authors and can
be used to infer the inherent influence flows.
Existing research on heterogeneous information networks mostly focus on
rank-ing and clusterrank-ing [4], similar objects searchrank-ing [5] and link prediction [1].
Differ-ently, this work tries to predict how a new topic is being adopted by authors as
a cascade without knowing the influence network structure, but not to predict an
additional new link over the existing network. This work proposes to leverage the
rich heterogeneous bibliography network information to complement the past topic
cascades for determining the inherent influence network. Besides the social
connec-tions, the popularity of the topic itself also affects the adoption process. In general,
authors are more likely to follow popular topics than less widely accepted ones.
To this end, this work aims at developing an algorithm that finds an influence
net-work by optimizing over the social connections and topic popularity subject to past
cascades. The influence networks will then be used to predict new topic adoption.
DBLP data is used to demonstrate the performance improvements of the proposed
4.2
Influence Factors for Research Topic Adoption
This work concerns the adoption of research topics as evidenced by authors’
pub-lications. A “topic” is defined as a popular term that represents a specific scientific
concept. Adopting a topic means an author has published at least one paper that
contains the term in either the title or the abstract.5 An authorX “follows” another authorY ifX adopts a topic afterY adopts the same topic. This following
behav-ior is also interpreted as an infection process [35]. The following lists the factors
that potentially play a role for the influence one author has on the others to adopt a
research topic.
4.2.1
Direct Observation
The direct observation of the adoption is the time when an author adopts the topic,
and a cascade can be generated based on the chronological ordered observations.
Each topic has its own cascade. According to Gomez-Rodriguez et al. [35],
re-covering an influence network with K edges will require2K~5K cascades. This
inferred influence network could be used to predict new topic adoption based on
the assumption that if authorX followedY in many topics before, it is also likely
X will followY again for a new topic. Generally speaking, the closer in time X
followedY, the more influenceY has onXbased on this direct observation [35].
5Topic adoption is a complex process. Nevertheless, to some extent, we believe that publishing
4.2.2
Indirect Observation
The direct observation helps to recover the influence network based on past topic
adoption cascades, but it requires sufficient number of relevant cascades to learn the
network. This limitation motivates the consideration of other factors that indirectly
implies the relationship, hence the influence one author may have on another to
adopt a new topic.
Connections
The basic idea is that authors are more likely to receive influence from their
col-leagues, co-authors and other socially connected peers, than unknown persons. Sun
et al. [1] [13] suggested that the social connections could be the main reason of
people establishing a new relation. Sunet al.[1] use meta-path to define the social
connections. A meta-path is defined on the network schema, where nodes are
ob-ject types and edges are relations between obob-ject types. For example, two authors
are coauthored in a paper