Adoptions, outcomes and placements for
children looked after by local authorities in
Wales, 2015-16
05 October 2016 SDR 132/2016
This annual national statistics first release presents figures about children looked after by Welsh local authorities. Children looked after include those on care orders and others provided with accommodation by their local authority. Some children are also looked after because the local authority provides accommodation for respite purposes; between 1 April 2015 and 31 March 2016, 435 children received this support. The remaining figures in this release exclude this group of children.
Chart 1: Number of children looked after in Wales, at 31 March
4,194 4,320 4,388 4,535 4,647 4,634 4,696 5,160 5,412 5,720 5,764 5,745 5,615 5,662
0 1,000 2,000 3,000 4,000 5,000 6,000 7,000
2003 2004 2005 2006 2007 2008 2009 (r) 2010 2011 2012 (r) 2013 2014 2015 (r) 2016
Source: SSDA903 (r) The data item has been revised since previously published.
Key results for the period 1 April 2015 to 31 March 2016:
5,662 children were looked after on 31 March 2016, an increase of 47 (0.8 per cent) over the previous year and a rate of 90 per 10,000 population aged under 18. The number of looked after children has increased by 5 per cent over the last five years, but has remained relatively stable over the past three years. (Chart 1 and Table 1)
There were 559 children looked after at 31st March 2016 who had three or more placements in 2015-16, a rate of 10 per cent. (Chart 2)
The number of children adopted decreased by 45 (12 per cent) over
About this release
The release presents key results at the Wales level and is based on the year 1 April 2015 to 31 March 2016, or the position at 31 March 2016, unless otherwise stated. All statistics in this release can be regarded as final figures, not subject to further revision or update.
Further information for individual local authorities can be found in the Annexes.
In this release
Placements 3
Children looked after by
need for care 4
Children looked after
leaving care 5
Adoptions 6
Educational attainments and qualifications 6
Tables and charts
Chart 1: Number of children looked after in Wales, at 31 March ... 1
Table 1: Number of children looked after by placement... 3
Chart 2: Percentage of children looked after who had 3 or more placements, at 31 March ... 4
Table 2: Children starting to be looked after, by need for care, between 1 April and 31 March ... 4
Table 3: Children leaving care, by reason for leaving between 1 April and 31 March ... 5
Chart 3: Percentage of adoptions of children looked after between 1 April and 31 March ... 6
Table 4: Educational attainments of looked after children, at 31 March ... 7
Table 5: Number and percentage of GCSE qualifications of care leavers, between 1 April and 31 March ... 8
Table 6: Number and percentage of care leavers on their 19th birthday ... 9
Chart 4: Number and percentage of care leavers in education, training or employment on their 19th birthday ... 9
Annex 1: Placements of looked after children by local authority ... 17
Annex 2: Adoptions of children looked after between 1 April and 31 March ... 18
Children looked after by local authorities
Throughout this statistical release, ‘children looked after’ refers to children looked after by local authorities.
[image:3.595.63.565.178.338.2]Placements of children looked after
Table 1: Number of children looked after by placement
(a)Placements 2014 (r) 2015 (r) 2016
Children looked after at 31 March 5,745 5,615 5,662
Number by placement:
in foster care placements 4,384 4,227 4,264
placed for adoption 293 293 262
placed with own parents or other person with parental responsibility 544 578 625
living independently 96 110 98
residential schools 52 48 36
secure units, children's homes and hostels 246 240 238
other placements (b) 130 119 139
Source: SSDA903 (a) Excluding children looked after in short-term placements.
(b) Residential care home, NHS/Health Trust or other establishment providing medical or nursing care, family centre or mother and baby unit, Youth Offender Institution or prison, whereabouts unknown.
(r) The data item has been revised since previously published.
5,662 children were looked after on 31 March 2016, a rate of 90 per 10,000 children aged less than 18 years, and an increase of 47 (0.8 per cent) when compared to the previous year.
75 per cent of looked after children at 31 March 2016 were accommodated in foster care
placements, a gradual decline in proportion since 2011, when it stood at 79 per cent. Over the last three years, proportions of children in different placement types have remained broadly similar.
The remainder of children looked after were mostly placed with parents or placed for adoption and a relatively small proportion was accommodated in institutional placements.
The number of children looked after by local authorities in foster care placements are shown by local authority in Annex 1.
Chart 2: Percentage of children looked after who had 3 or more placements, at 31
March
0 1,000 2,000 3,000 4,000 5,000 6,000 7,0002002-03 2003-04 2004-05 2005-06 2006-07 2007-08 2008-09
(r) 2009-10 2010-11 2011-12(r) 2012-13 2013-14 2014-15(r) 2015-16
With fewer than 3 placements during the year to 31 March With three or more placements during the year to 31 March 4,194
13% 14% 13% 13% 12% 11% 10% 10% 9% 9%
4,320 4,388 4,535 4,647 4,634 4,696
5,160 5,412 5,720
87% 86% 87% 87% 88% 89% 90% 90% 91% 91%
5,764 90% 10% 5,745 92% 8% 91% 5,615 9% 10% 90% 5,662 Source: SSDA903
(r) The data has been revised since previously published.
There were 559 children in care at 31 March 2016 who had three or more placements between 1 April 2015 and 31 March 2016, an increase of 36 children (7 per cent) compared with the previous year. 10 per cent of children had 3 or more placements in 2015-16, compared to 9 per cent in 2014-15.
[image:4.595.62.543.74.263.2]Children looked after by need for care
Table 2: Children starting to be looked after, by need for care, between 1 April and
31 March
(a)Need of care 2014-15 (r) 2015-16
Children starting to be looked after 2,009 2,041 2,055
Number by category of need:
abuse or neglect 1,175(r) 1,241 1,307
parental illness/disability or absence 163 140 131
family in acute stress or dysfunction 538(r) 500 496
socially unacceptable behaviour 105 123 86
other 28 37 35
Percentage by category of need:
abuse or neglect 58 61 64
parental illness/disability or absence 8 7 6
family in acute stress or dysfunction 27 24 24
socially unacceptable behaviour 5 6 4
other 1 2 2
Source: SSDA903 2013-14
(a) Excluding children looked after in short-term placements. Where a child had separate periods of care only the first period is counted and shows the initial reason for a child coming into care.
(r) The data has been revised since previously published.
reasons for why children have started to become looked after has been broadly similar in recent years, but there has been an increase in the abuse and neglect category since 2003, when it stood at 48 percent.
Further information can be found on the StatsWales website: Children starting to be looked after during year to 31 March by local authority and need for care.
[image:5.595.59.569.218.405.2]Children looked after leaving care
Table 3: Children leaving care, by reason for leaving between 1 April and 31 March
(a)Leaving Care 2013-14 (r) 2014-15 (r) 2015-16
Children leaving care (b) 2,024 2,172 2,009
Number by destination:
returned home to live with parent, relative or other
person with parental responsibility (c) 1,030 1,110 1,032
adopted from care 347 385 340
other 647 677 637
Percentage by destination:
returned home to live with parent, relative or
other person with parental responsibility (c) 51 51 51
adopted from care 17 18 17
other 32 31 32
Source: SSDA903
(a) Excluding children looked after in short-term placements. Where a child had separate periods of care only the latest period is counted.
(b) Excludes children who died or where care was taken over by another local authority in the UK. (c) Includes special guardianship orders made to carers or former foster carers.
(r) The data has been revised since previously published.
2,009 children left care between 1 April 2015 and 31 March 2016, a decrease of 163 children (8 per cent) compared with the previous year.
During 2015-16, just over half of all children leaving care (51 per cent) returned home to live with parents, relatives or other persons with parental responsibility, the same proportion as seen in the last two years.
Adoptions of children looked after
Chart 3: Percentage of adoptions of children looked after between 1 April and 31
March
0 50 100 150 200 250 300 350 400 4502006-07 2007-08 2008-09 2009-10 2010-11 2011-12 2012-13 2013-14 (r)
2014-15 (r)
2015-16
Not adopted by foster carer Adopted by foster carer
225
212
260
229 254 246
329
347
18% 13%
19%
14% 15% 12%
10% 9%
82% 87% 81% 86% 85% 88% 90% 91%
340 9% 89% 91% 11% 385 Source: AD1
(r) The data item has been revised since previously published.
There were 340 children adopted from care between 1 April 2015 and 31 March 2016. 9 per cent of children were adopted by their former foster carer in 2015-16, a proportion that has fallen over the past 10 years. The number of children adopted decreased by 45 (12 per cent) over the previous year.
Further details on numbers and percentages of children adopted are shown in Annex 2 and on the StatsWales website: Foster care adopters by duration of final period of care and measure.
Educational attainments and qualifications
Educational attainments are an important measure of the achievement of looked after children and attainment is generally low compared to the school population as a whole. GCSE qualifications of looked after children have been collected for many years on the OC1 data return and in recent years school attainment and external point scores have been collected on the PM1 return.
Although the results cannot be compared directly with the OC1 figures, because the Children in Need Census includes a different sample of children and a wider range of qualifications, the CIN Census showed that looked after children did slightly better than other children receiving social services.
[image:7.595.86.564.184.332.2]Terms and definitions for OC1 and PM1 data returns are further explained in the Glossary.
Table 4: Educational attainments of looked after children, at 31 March
(a)Education attainments 2013-14 2014-15 2015-16
The percentage of look ed after children eligible for assessment at the end of Key Stage 2 achieving the Core Subject Indicator, as determined by Teacher Assessment
52
60 66
The percentage of look ed after children eligible for assessment at the end of Key Stage 3 achieving the Core Subject Indicator, as determined by Teacher Assessment
37
43 47
The average external qualifications point score for 16 year old looked after children, in any local authority maintained learning setting
262 276 269
Source: PM1 and SSDA903
(a) For the previous school year, e.g. for children looked after at 31 March 2015 results are for the 2013-14 school year, September 2013 to August 2014.
Compared to all pupils in Wales, looked after children had lower educational attainments, but showed an improvement compared to the previous year in the Core Subject Indicators and average points scores for 16 year olds. Further details on educational attainment for all pupils in Wales can be found in the Key Quality section.
In 2015-16, 47 per cent of children looked after who were eligible for assessment at Key Stage 3 achieved the Core Subject Indicator, whereas 66 per cent achieved the Core Subject Indicator at Key Stage 2; an increase of 4 percentage point and 6 percentage points respectively, when compared to the previous year.
The Core Subject Indicator is a measure used for schools and refers to achieving a specified level in the core National Curriculum subjects of English or Welsh (first language), Mathematics and Science in combination.
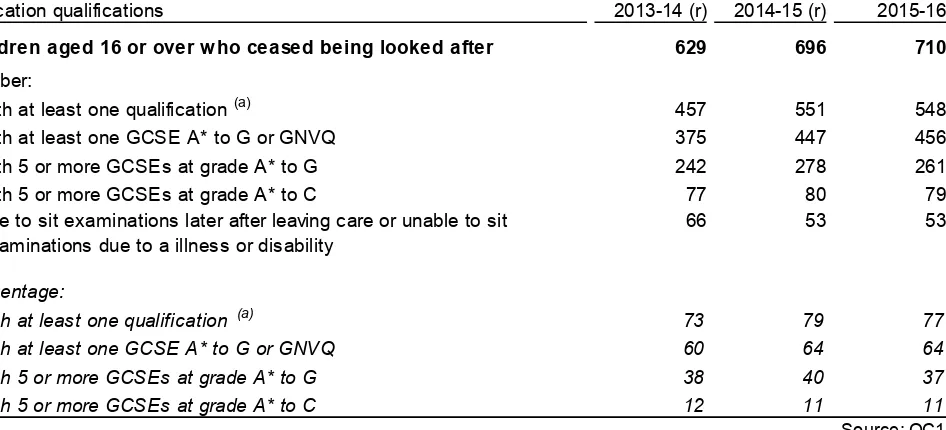
Table 5: Number and percentage of GCSE qualifications of care leavers, between 1
April and 31 March
Education qualifications 2013-14 (r) 2014-15 (r) 2015-16
Children aged 16 or over who ceased being looked after 629 696 710
Number:
with at least one qualification (a) 457 551 548
with at least one GCSE A* to G or GNVQ 375 447 456
with 5 or more GCSEs at grade A* to G 242 278 261
with 5 or more GCSEs at grade A* to C 77 80 79
due to sit examinations later after leaving care or unable to sit examinations due to a illness or disability
66 53 53
Percentage:
with at least one qualification (a) 73 79 77
with at least one GCSE A* to G or GNVQ 60 64 64
with 5 or more GCSEs at grade A* to G 38 40 37
with 5 or more GCSEs at grade A* to C 12 11 11
Source: OC1
(a) Includes GCSEs, NVQs, A levels, and any other qualifications approved for use in schools under Section 400 of the Education Act 1996.
(r) The data has been revised since previously published.
Between 1 April 2015 and 31 March 2016, 710 children aged 16 or over ceased being looked after and 77 per cent of these children had at least one qualification. Excluding those children due to sit exams later after leaving care and those prevented from sitting exams due to illness or disability, the proportion with at least one qualification was 83 per cent.
The proportion of care leavers aged 16 or over with 5 or more GCSEs at grade A* to G decreased slightly from 40 per cent in 2014-15, to 37 per cent in 2015-16.
Table 6: Number and percentage of care leavers on their 19
thbirthday
Care leavers 2013-14 (r) 2014-15 (r) 2015-16
Care leavers on their 19 birthday 457 434 497
Number:
not in touch with the local authority 30 29 34
in touch with the local authority 427 405 463
in education, training or employment 234 241 281
In full time education, training or employment 188 168 234
In part time education, training or employment 46 73 47
not in education, training or employment or not in touch 223 193 216
Percentage (%):
not in touch with the local authority 7 7 7
in touch with the local authority 93 93 93
in education, training or employment 51 56 57
In full time education, training or employment 41 39 47
In part time education, training or employment 10 17 9
not in education, training or employment or not in touch 49 44 43 Source: OC3 (r) The data item has been revised since previously published.
There were 497 young people who had their 19th birthday between 1 April 2015 and 31 March 2016 and were in care on 1 April 2013, an increase of 63 (15 per cent) from the equivalent cohort in the previous year. The percentage of young people who were in touch with local authorities was 93 per cent, the same proportion as seen in the last two years.
57 per cent of the 497 young people were known to be in education, training or employment
compared to 56 per cent in the previous year. The percentage of young people who were known to be in full time education, training or employment, increased from 39 per cent in 2014-15, to 47 per cent in 2015-16.
Chart 4: Number and percentage of care leavers in education, training or
employment on their 19
thbirthday
100 200 300 400 500 600
44% 46% 45% 47% 48% 47%
56% 54% 55%
53% 52% 53%
Glossary
“Looked after” is the term used in the Children Act 1989 to describe all children who are the subject of a care order, or who are provided with accommodation on a voluntary basis for more than 24 hours.
“Placements” of looked after children include all placement types, except where a child is in respite care. For a full list of these placements, please refer to the SSDA903 guidance. A new placement is recorded for a child when they start to be looked after or are already looked after and move to a new location. These changes are indicated by the use of ‘Reason for new episode’ codes S, P and B. A change in legal status alone (‘Reason for new episode’ code L) is not regarded as a
placement change.
"Special guardianship orders" (SGO) were introduced by the Adoption and Children Act 2002 section 144(4) which amended the Children Act 1989. A special guardianship order gives the special guardian parental responsibility for the child. Unlike adoption, under a SGO the parents remain the child's parents and retain parental responsibility, though their ability to exercise their parental responsibility is extremely limited.
"Need for care" or "Category of need" is the main reason why a child is being provided with services.
"Short term placement" is the term used to describe children who are subject to short-term break agreements. These children normally live at home, but are accommodated by a local authority in a pattern of short periods of care in order to give their parents (or guardians) some “respite” from the normal duties of looking after a child.
External Points Score – A complete list of the approved external qualifications and their point values can be found on the Qualifications in Wales website.
Core Subject Indicator - Achieving a specified level in the core National Curriculum subjects of English or Welsh (first language), Mathematics and Science in combination.
Achieving the Key Stage 2 Core Subject Indicator means achieving level 4 or above in the core National Curriculum subjects of English or Welsh (first language), Mathematics and Science in combination.
Achieving the Key Stage 3 Core Subject Indicator means achieving level 5 or above in the core National Curriculum subjects of English or Welsh (first language), Mathematics and Science in combination.
General Certificate of Secondary Education (GCSE)
SSDA 903 - Statistical return on children looked after
AD1 - Statistical return on adoptions of looked after children
Notes
1. Context
1.1 Policy/operational context
All references made to ‘year’ relate to the standard financial year which runs from 1 April to 31 March (for example 2015-16 should be understood as 1 April 2015 to 31 March 2016).
Information on the number of children looked after by local authorities was collected using two sources for the year 1 April 2015 to 31 March 2016. As well as collecting individual child level data on looked after children through the SSDA903 (Children Looked After), AD1 (Adoptions), OC1 (Educational attainments) and OC3 (Care leavers 19th birthday) data collections, the PM1 return
collected aggregated figures for local authorities. PM1 data was used in compiling Table 4. All other tables are based on the individual records.
Data for the individual child level collections is extracted from local authority administrative systems and returned electronically to the Data Collection team within the Welsh Government using an online secure data transfer system called 'AFON'. The AFON system applies an extensive series of validation checks to ensure that the information provided uses the correct codes and is internally consistent.
Guidance notes and other documents useful for the completion of the returns can found on the Welsh Government website at:
SSDA903 - Statistical return on children looked after
AD1 - Statistical return on adoptions of looked after children
OC1 - Statistical return on educational qualifications of care leavers
OC3 - Statistical return on care leavers on their 19th birthday
1.2 A National Statistics status
The United Kingdom Statistics Authority has designated these statistics as National Statistics, in accordance with the Statistics and Registration Service Act 2007 and signifying compliance with the Code of Practice for Official Statistics.
National Statistics status means that official statistics meet the highest standards of trustworthiness, quality and public value.
All official statistics should comply with all aspects of the Code of Practice for Official Statistics. They are awarded National Statistics status following an assessment by the UK Statistics Authority’s regulatory arm. The Authority considers whether the statistics meet the highest standards of Code compliance, including the value they add to public decisions and debate.
It is Welsh Government’s responsibility to maintain compliance with the standards expected of National Statistics. If we become concerned about whether these statistics are still meeting the appropriate standards, we will discuss any concerns with the Authority promptly. National Statistics status can be removed at any point when the highest standards are not maintained, and reinstated when standards are restored.
2. Key Quality Information
This section provides a summary of information on this output against five dimensions of quality: Relevance, Accuracy, Timeliness and Punctuality, Accessibility and Clarity, and Comparability.
2.1 Relevance
The statistics are used both within and outside the Welsh Government to monitor child social services trends and as a baseline for further analysis of the underlying data. These statistics are used in a variety of ways. Some of the key users are:
Ministers and the Members Research Service in the National Assembly for Wales;
Local authorities;
The third sector (e.g. charities);
The Health and Social Services Group in the Welsh Government;
Other areas of the Welsh Government;
The research community;
Students, academics and universities;
Individual citizens and private companies.
The statistics may also be useful for other UK governments
The Northern Ireland Executive’s Department of Health, Social Services and Public Safety
The Scottish Government, Analytical Services Division
These statistics are used in a variety of ways. Some examples of these are:
advice to Ministers;
local authority comparisons and benchmarks;
to inform the social services policy decision-making process in Wales;
to inform the Care and Social Services Inspectorate Wales;
to model the financial consequences of changes in the population or the care system
to assist in research on children receiving social services.
2.2 Accuracy
Every year the data are collected from the following sources listed below, and adhere to the national standard; they will also be coherent within and across organisations.
SSDA903 (Statistical return on children looked after)
AD1 (Adoptions)
OC1 (Educational attainments)
OC3 (Care leavers 19th birthday)
PM1
To ensure data accuracy, a number of validation checks are carried out on the records at the point of data upload on Afon. A full list of the validation rules can be found in Annex A in the Quality Report. These rules identify; missing data items, invalid codes, unlikely or impossible
combinations of data, and unlikely or impossible sequences of dates.
After submitting the data in the approved format, local authorities can view a list of validation failures on Afon. These are split into errors and queries. Errors must be corrected by uploading another file. Queries must be checked and explanations provided if the data is correct. The validation process is repeated every time a new file is uploaded. Once all the errors have been cleared, local authorities can submit the data. The submission is then approved by the Welsh Government and downloaded to an SQL server database.
Once the data has been downloaded, Welsh Government statisticians carry out further validation checks by interrogating the data using Microsoft Access queries, and if there are any further errors found, the provider is contacted to seek a resolution.
For the children looked after data, information which may be inconsistent with that already held in a previous year about the child is checked, in particular details submitted for the beginning of the current year which do not match those at the end of the previous year.
2.3 Timeliness and Punctuality
2015-This statistical release is pre-announced and then published on the Statistics section of the Welsh Government website. It is accompanied by more detailed tables on StatsWales, a free to use service that allows visitors to view, manipulate, create and download data.
2.5 Comparability and coherence
The tables are based on complete returns from all local authorities in Wales. Some children are looked after because the local authority provides accommodation for respite purposes. At 31 March 2016, the count during the year was 435 compared to 528 at 31 March 2015. Figures in this release exclude this group of children.
Statistics collected in each United Kingdom country may differ and the detailed guidance available from each country’s website should be consulted before using these statistics as comparative measures. Further information on comparability is available in the Social Services Statistics Quality report
The Social Services and Well-being (Wales) Act sets out significant changes in policy, which in turn will have an effect on the current national social services data collections. In order to
understand and develop requirements in relation to these changes, the Welsh Government set up the Social Services Technical Information Network in November 2014. The Network includes representation from the Welsh Local Government Association, Association of Directors of Social Services Cymru, Care and Social Services Inspectorate Wales and Welsh Government.
The Network has reviewed all of the national social services data returns submitted by local authorities and requirements for data have been developed in line with the implementation of the Act. From April 2016, local authorities are required to collect the performance measures detailed in the Code of Practice in relation to social services performance issued under the Act.
New forms – Local authority social services data collections
3. Revisions
Occasionally, revisions can occur due to errors in our statistical processes or when a data supplier notifies the Welsh Government that they have submitted incorrect information. In these cases, a judgment is made as to whether the change is significant enough to publish a revised statistical release. Where changes are not deemed to be significant, figures will be corrected if they appear in future releases. However minor amendments to the figures may be reflected in the StatsWales tables prior to the next release.
Following submission of the current year’s data, the data is validated against previous years’ submissions for each local authority. This can often result in minor revisions to previous years’ data. These changes are then reflected in the annual statistical release. Revised figures have been marked with the letter “r” in the relevant tables and charts affected throughout the release.
Information on the costs to local authorities of services provided for looked after children are produced by the Welsh Government from local authority financial returns. Detailed figures are available on StatsWales.
Information on the characteristics and educational outcomes of all children receiving social services was published in the “Wales Children in Need Census, 2015”.
Information on Key Stage assessments for all school pupils aged 7, 11 and 14 years old for 2016 was published by the Welsh Government in SFR 94/2016 “Foundation Phase Outcomes and National Curriculum Teacher Assessment of Core Subjects at Key Stages 2 and 3, 2016”:
Information on point scores for all pupils for 2015 can be found on StatsWales.
5. Related publications
England:
Looked After Children Statistics are produced annually by the Department for Education. The most recent data was published on 29 September 2016.
Scotland:
Children Looked After Statistics are produced annually by the Scottish Government. The most recent data were published on 22 March 2016.
Northern Ireland:
Children Looked After Statistics are produced annually by the Department of Health, Social Services and Public Safety. The latest Children Order Statistics were published on 19 November 2015.
UK comparability of children’s social services statistics:
6. Well-being of Future Generations Act (WFG)
The Well-being of Future Generations Act 2015 is about improving the social, economic,
environmental and cultural well-being of Wales. The Act puts in place seven well-being goals for Wales. These are for a more equal, prosperous, resilient, healthier and globally responsible Wales, with cohesive communities and a vibrant culture and thriving Welsh language. Under section (10)(1) of the Act, the Welsh Ministers must (a) publish indicators (“national indicators”) that must be applied for the purpose of measuring progress towards the achievement of the Well-being goals, and (b) lay a copy of the national indicators before the National Assembly. The 46 national indicators were laid in March 2016.
Information on indicators and associated technical information - How do you measure a nation’s progress? - National Indicators
Further information on the Well-being of Future Generations (Wales) Act 2015.
The statistics included in this release could also provide supporting narrative to the national indicators and be used by public services boards in relation to their local well-being assessments and local well-being plans.
7. Further details
The document is available at:
http://gov.wales/statistics-and-research/adoptions-outcomes-placements-children-looked-after/?lang=en
We want your feedback
We welcome any feedback on any aspect of these statistics which can be provided by email to stats.pss@wales.gsi.gov.uk
Open Government Licence
Annexes
Annex 1: Placements of looked after children by local authority
(a)Local Authority
Children looked after at
31 March 2016 In foster care placements other placements(b)
Isle of Anglesey 108 89 19
Gwynedd 207 145 62
Conwy 169 123 46
Denbighshire 175 127 48
Flintshire 209 137 72
Wrexham 195 128 67
Powys 148 117 31
Ceredigion 78 61 17
Pembrokeshire 126 93 33
Carmarthenshire 215 175 40
Swansea 510 391 119
Neath Port Talbot 377 285 92
Bridgend 380 303 77
Vale of Glamorgan 193 142 51
Cardiff 644 441 203
Rhondda Cynon Taf 623 492 131
Merthyr Tydfil 141 124 17
Caerphilly 276 223 53
Blaenau Gwent 193 146 47
Torfaen 272 208 64
Monmouthshire 129 92 37
Newport 294 222 72
Wales 5,662 4,264 1,398
SSDA903
(a) Excluding children looked after in short-term placements.
Annex 2: Adoptions of children looked after between 1 April and 31 March
(a)Adoptions 2013-14 (r) 2014-15 (r) 2015-16
Children adopted from care 347 385 340
Number:
adopted by their former foster carer 30 41 31
adopted by others 317 344 309
Percentage:
adopted by their former foster carer 9 11 9
adopted by others 91 89 91
Source: SSDA903
(a) Excluding children looked after in short-term placements. Where a child had separate periods of care only the latest period is counted.
Annex 3: A List of Tables and Data Items Provided in StatsWales
1. Children looked after at 31 March by local authority, gender and age
(Chart 1 of the Release)
2. Children looked after at 31 March by local authority and placement type
(Table 1 and Annex 1 of the Release)
3. Children looked after at 31 March by local authority, number of placements during the year and measure
(Chart 2 of the Release)
4. Children starting to be looked after during year 31 March by local authority and need for care
(Table 2 of the Release)
5. Episodes finishing for children looked after during 31 March by local authority and reason for finishing
(Table 3 of the Release)
6. Educational attainment of children looked after by local authority and measure
(Table 4 of the Release)
7. Educational Qualifications of children who ceased to be looked after aged 16 or over with GCSE or GNVQ qualification by local authorities, gender and year
(Table 5 of the Release)
8. Care leavers on their 19th birthday during year ending 31 March by local authority and activity
(Table 6 of the Release)
9. Foster care adopters and duration of final period of care by duration and year
Dataset only available on StatsWales
1. Children looked after at 31 March by local authority and legal status
2. Children looked after in foster placements at 31 March by local authority and placement type
3. Children looked after at 31 March by local authority and ethnicity
4. Respite care for looked after children by local authority and placement
5. Respite care for looked after children by local authority and need for care
6. Educational qualifications of care leavers by local authorities, qualifications and year
7. Care leavers on their 19th birthday by local authorities, activity and year
8. Adoption of looked after children during year ending 31 March by age and gender
9. Average age at adoption (months) of looked after children by local authorities and year
10. Looked after children adopted during year ending 31 March by age of child at start of last period of care and the length of time until adoption
11. Looked after children adopted during year ending 31 March by gender and marital status of adopters