1
A STUDY OF SERUM LEVEL OF FIBROBLAST
GROWTH FACTOR-19 IN
METABOLIC SYNDROME
Dissertation Submitted for
M.D DEGREE BRANCH - XIII
[BIO CHEMISTRY]
DEPARTMENT OF BIOCHEMISTRY
THANJAVUR MEDICAL COLLEGE,
THANJAVUR
THE TAMILNADU DR.MGR MEDICAL UNIVERSITY,
CHENNAI
2
CERTIFICATE
This is to certify that dissertation titled
“A
STUDY OF SERUM
LEVEL OF FIBROBLAST GROWTH FACTOR-19 IN METABOLIC
SYNDROME
”
is a bonafide work done by
Dr.S.ARUNA
under my
guidance and supervision in the Department of Biochemistry, Thanjavur
Medical College, Thanjavur during her post graduate course from 2013 to
2016.
Dr.M.SINGARAVELU, M.D., DCH Dr. N.SASIVATHANAM, M.D. D.G.O.,
THE DEAN Professor and Head of the Department Thanjavur Medical College Department of Biochemistry
3
GUIDE CERTIFICATE
GUIDE: Prof. Dr.N.SASIVATHANAM, M.D. (Bio), D.G.O.,
THE PROFESSOR AND HEAD OF THE DEPARTMENT,
Department of Biochemistry,
Thanjavur medical college & Hospital,
Thanjavur.
CHIEF CO-ORDINATOR:
Prof. Dr .N.SASIVATHANAM, M.D. (Bio), D.G.O.,
THE PROFESSOR AND HEAD OF THE DEPARTMENT,
Department of Biochemistry,
Thanjavur medical college & Hospital,
Thanjavur.
Remark of the Guide:
The work done by DR.S.ARUNA on
“A
STUDY OF
SERUM LEVEL OF FIBROBLAST GROWTH FACTOR-19 IN
METABOLIC SYNDROME
”
is under my supervision and I assure that
this candidate will abide by the rules of the Ethical Committee.
GUIDE:
Prof. Dr .N.SASIVATHANAM, M.D.(Bio),D.G.O.,
THE PROFESSOR AND HOD,
Department of Biochemistry,
4
DECLARATION
I,
Dr.S.ARUNA
hereby solemnly declare that the dissertation title
“A
STUDY OF SERUM LEVEL OF FIBROBLAST GROWTH
FACTOR-19 IN METABOLIC SYNDROME
”
was done by me at Thanjavur
Medical
College and Hospital, Thanjavur under the Supervision and Guidance
of
my
Professor
and
Head
of
the
Department,
Dr.N.SASIVATHANAM,M.D(Bio).,DGO,
This dissertation is submitted to
the Tamil Nadu Dr. M.G.R. Medical University, towards partial fulfillment of
requirement for the award of M.D. Degree (Branch
–
XIII) in Biochemistry.
Place: Thanjavur
Date:
Dr.S.ARUNA
5
6
ANTI
–
PLAGIARISM
–
ORIGINALITY REPORT
7
ACKNOWLEDGEMENT
I am extremely grateful to
Dr.M.SINGARAVELU, M.D., DCH,the Dean, Thanjavur Medical College for permitting me to do this
dissertation at Thanjavur Medical College Hospital, Thanjavur.
I am indebted greatly to my Professor and Head of the
Department, Department of Biochemistry
, Dr. N.SASIVATHANAM, M.D.
(Bio), D.G.O.
, who had inspired, encouraged and guided me in every step of
this study.
I express my sincere gratitude to Dr.K.NAGARAJAN, M.D.,
HOD, and Professor, Department of General Medicine, for his valuable help.
I express my heartiest thanks to Dr .S.Ganesan, M.D(Bio),
Associate Professor of Biochemistry and Dr.Josephine latha, M.D(Bio).,
Associate Professor, Department of Biochemistry, Thanjavur Medical
College for their help and suggestions for performing my study.
I sincerely thank my Assistant Professors Dr.R.Rajeswari,
M.D(Bio).,DD.,
Dr.M.Ramadevi,
M.D(Bio).,D.C.H
.,
and
Dr.P.Sunithapriya,M.D(Bio)., Department of
Biochemistry for their support
8
I owe my thanks to my co-post graduates for their support during
the study.
I would like to acknowledge the assistance rendered by Non
Medical assistants and the Technical staffs who helped me to perform the
study.
I am grateful to all my patients and volunteers who participated in
this study. I owe my special thanks to my family members for their moral
support in conducting the study.
Above all, I dedicate my sincere thanks and prayers to the DIVINE
FORCE which guides me throughout my life towards the best.
9
CONTENTS
S.NO
PARTICULARS
PAGE NO
1
INTRODUCTION
1
2
REVIEW OF LITERATURE
3
3
AIMS AND OBJECTIVES
50
4
MATERIALS AND METHODS
51
5
RESULTS AND STATISTICS
71
6
DISCUSSION
78
7
CONCLUSION
80
8
LIMITATIONS OF THE STUDY
81
9
FUTURE SCOPE OF THE STUDY
82
ANNEXURE
BIBLIOGRAPHY
PROFORMA
10
ABBREVIATIONS
MetS - Metabolic Syndrome
T2DM
–
Type 2 Diabetes Mellitus
FBS - Fasting Blood Sugar
PPBS
–
Post prandial Blood Sugar
TC
–
Total Cholesterol
TGL
–
Triglycerides
HDL-C - High density lipoprotein Cholesterol
LDL-C - Low density lipoprotein Cholesterol
VLDL - Very low density lipoprotein
TNF-
α
-
Tumor necrosis factor α
INF α
-
Interferon α
IL- 6 - Interleukin 6
PAI - Plasminogen activator inhibitor
CETP - Cholesterol ester transfer protein
LPL - Lipoprotein lipase
PKA - Protein kinase A
HSL - Hormone sensitive lipase
CVD - Cardiovascular disease
VEGF - Vascular endothelial growth factors
IGF-1
–
Insulin like Growth Factor-1
11
IRS-Insulin Receptor Substrate
PI3 K
–
1-Phosphatidyl Inositol 3 Kinase
MAPK - Mitogen Activator Protein Kinase
GLUT - Glucose transporters
FFAs - Free Fatty acids
FGF
–
Fibroblast Growth Factor
FGFR
–
Fibroblast Growth Factor Receptor
FXR
–
Farnesoid X Receptor
CNS
–
Central Nervous system
WHO - World Health Organization
EGIR - European Group for the study of Insulin Resistance
NCEP ATP - The National Cholesterol Education Program Adult Treatment Panel
AACE - American Association of Clinical Endocrinologists
IDF - International Diabetes Federation
NHANES
–
National Health And Nutrition Examination Survey
WC
–
Waist Circumference
BMI
–
Body Mass Index
IFG
–
Impaired Fasting Glucose
PTPs - Protein Tyrosine Phosphatases
LAR - Leukocyte Antigen-Related Phosphatase
12
DNA
–
Deoxyribo Nucleic Acid
AGPAT2 - 1-acyl glycerol-3-phosphate-O-acyl transferase
Km - Michaelis constant
HBP - Hexosamine Biosynthetic Pathway
UDP-N-GlcNac - Uridine diphosphate-N-acetyl glucosamine
GFAT
–
Glutamine: Fructose-6-phosphate Amidotransferase
CoA
–
Coenzyme A
NAD
–
Nicotinamide Adenine Dinucleotide
CPT-1- Carnitine Palmitoyl Transferase-1
ROS - Reactive Oxygen Species
AGEs - Advanced Glycation End products
ERK - Extracellular signal Regulated protein Kinase
GSK
–
Glycogen Synthase Kinase
FHF - Fibroblast Homologous Factors
CYP7A1- Cytochrome P 7A1
ACC
–
Acetyl CoA Carboxylase
SCD
–
Stearoyl CoA Desaturase
SHP-1 - Small Heterodimer Partner-1
eIF - Eukaryotic Initiation Factor
mRNA
–
messenger RNA
GABA
–
Gamma Amino Butyric Acid
HRP
–
Horse Radish Peroxidase
13
ELISA
–
Enzyme Linked Immuno Sorbent Assay
GOD - Glucose oxidase
POD - Peroxidase
CHE - Cholesterol Esterase
CHO - Cholesterol Oxidase
4AAP - 4-AminoAntipyrine
GPO - Glycerol Phosphate Oxidase
LPL - Lipoprotein Lipase
GK - Glycerol kinase
ATP - Adenosine Tri Phosphate
DHAP - Di-Hydroxy Acetone Phosphate
DHBS -3,5 Dichloro-2 Hydroxy Benzene Sulfonate
CM - Chylomicrons
AIP - Atherogenic Index of Plasma
hsCRP
–
high sensitive C reactive Protein
HbA1C
–
Glycated Hemoglobin
CAD - Coronary Artery Disease
SBP- Systolic Blood Pressure
DBP
–
Diastolic Blood Pressure
HT- Height
WT - Weight
A STUDY OF SERUM LEVEL OF FIBROBLAST GROWTH
FACTOR-19 IN METABOLIC SYNDROME
ABSTRACT:
INTRODUCTION:
Metabolic syndrome is a state of dysregulation of normal body metabolism.
It is a cluster of Insulin resistance, glucose intolerance, Obesity, Hypertension and
Atherogenic Dyslipidemia, which are potential risk factors for Type 2 Diabetes
Mellitus, Cardiovascular diseases and Stroke. FGF 19 (Fibroblast Growth Factor 19)
is a newly identified metabolic regulator, influencing homeostasis of glucose and lipid
metabolism.
AIMS AND OBJECTIVES:
1. To measure serum FGF19 in patients with Metabolic syndrome and to
compare the serum level of FGF 19 with healthy individuals.
2. To analyze the correlation between serum FGF 19 and the
components of Metabolic syndrome.
MATERIALS AND METHODS:
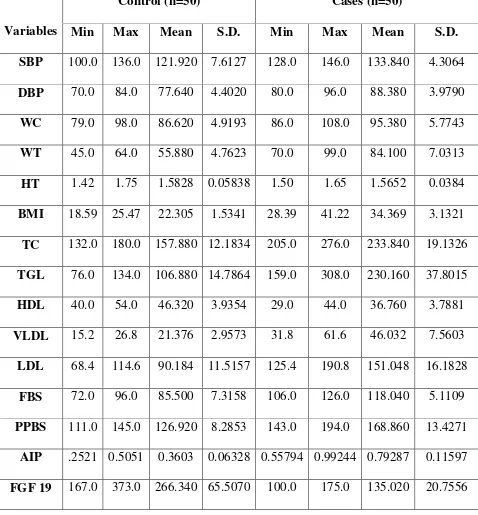
The study was conducted at Thanjavur Medical College, Thanjavur. The
study included 50 patients with Metabolic syndrome (25 males, 25 females) and 50
age and sex matched healthy controls (25 males, 25 females). Anthropometric
measurements and blood pressure were recorded and fasting blood samples were
post prandial blood sugars and a complete lipid profile were done for all the samples.
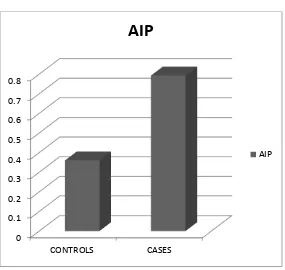
AIP (Atherogenic Index of Plasma) was calculated for all the subjects.
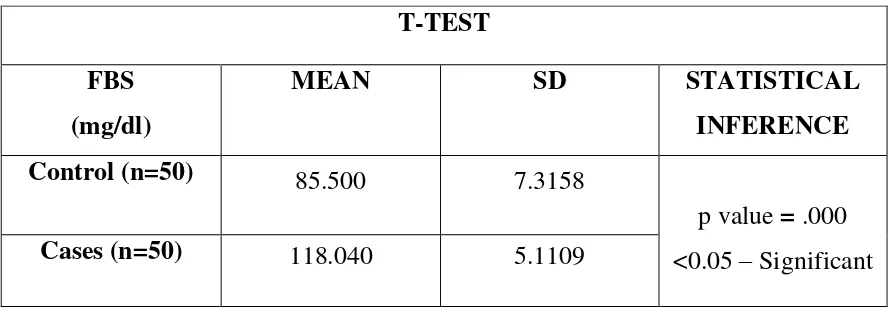
RESULTS:
Student’s t-test analysis shows a significant decrease in the mean serum
FGF 19 in cases (135.02 ± 20.76 pg/ml), when compared to the mean serum FGF 19
in controls (266.34 ± 65.5 pg/ml), which is statistically significant. Pearson correlation
between FGF 19 and other parameters shows a negative correlation between serum
FGF 19 and BMI, Waist circumference, systolic and diastolic BP, AIP, fasting and
post prandial blood sugar, serum TC, TGL, VLDL and LDL concentrations and a
positive correlation with serum HDL concentration, which are also statistically
significant.
CONCLUSION:
This study shows that serum levels of FGF 19 are low in patients with
Metabolic syndrome. The negative relationship obtained between FGF 19 and several
other known cardiovascular risk factors like TGL and log (TGL / HDL-C) suggests
that FGF 19 can be used as a novel marker in assessing cardiovascular risk in patients
with Metabolic syndrome. Hence, earlier intervention can be taken to reduce the
cardiovascular complications.
KEY WORDS:
Fibroblast Growth Factor 19, Metabolic syndrome, Insulin resistance,
glucose intolerance, Obesity, Atherogenic Dyslipidemia, Type 2 Diabetes Mellitus,
15
INTRODUCTION
The Metabolic syndrome is a major global threat nowadays due to urbanization, sedentary life style and increased incidence of obesity.1 Metabolic syndrome is a state of dysregulation of normal body metabolism. It is a cluster of Insulin resistance, glucose intolerance, Obesity, Hypertension and Atherogenic Dyslipidemia, which are potential risk factors for Type 2 Diabetes Mellitus, Cardiovascular diseases and Stroke.2,3,4
Fibroblast Growth Factor 19 (FGF-19) is a unique member of the Fibroblast Growth Factor family of secreted proteins.5 It is a hormone like protein that regulates Carbohydrate, Lipid and Bile acid metabolism. FGF -19 is synthesized from the small intestine and secreted in to the circulation when bile acids are taken up into the ileum after a meal and then acts on CNS to elicit its metabolic effects. 6,7,8 This hormone-like postprandial protein has recently been shown to stimulate glycogen synthesis and inhibit gluconeogenesis through Insulin independent pathways.7,6 It stimulates Hepatic protein synthesis and Glycogen synthesis.8
16
17
REVIEW OF
18
REVIEW OF LITERATURE
METABOLIC SYNDROME
HISTORIC TRENDS:
The concept of Metabolic syndrome (MetS) started in 1920, when a Swedish physician, Kylin associated Hypertension, Hyperglycemia and Gout1,10. Then, Vague in 1947, demonstrated the association between Visceral Obesity and the metabolic abnormalities in Cardiovascular diseases and Type 2 Diabetes Mellitus1. Later, in 1965, an abstract, which again described an entity comprising of Obesity, Hypertension and Hyperglycemia, has been presented by Avagadro and Crepaldi, at the European Association for the study of Diabetes Annual Meeting.1
Then came the very famous Banting lecture in 1988, by Reaven, a significant move in the field, which described a cluster of risk factors for Cardiovascular disease and Diabetes, and he coined the word
“SYNDROME X” for this entity 1, 11, 12
. He introduced the concept of Insulin Resistance, which was a major contribution. But, Visceral Obesity was surprisingly being missed in his definition and was later included as a major abnormality. Kaplan, in 1989, renamed the entity as “THE DEADLY
19
and Hypertriglyceridemia. Again it was renamed as “THE INSULIN
RESISTANCE SYNDROME” in 199β.1
Many groups then came forward to develop the diagnostic criteria for metabolic syndrome. The World Health Organization (WHO) diabetes group made the first attempt to give a definition of the syndrome in 1998, which was modified by the European Group for the study of Insulin Resistance (EGIR), in 19991,13. The next definition was proposed by The National Cholesterol Education Program Adult Treatment Panel (NCEP ATP), in 2001. Subsequently, in 2003, the American Association of Clinical Endocrinologists (AACE) contributed to the Syndrome’s definition. Thus, a desire for a single unifying definition arised. To
accomplish this need, a new definition was proposed by the International Diabetes Federation (IDF), in April 2005.1
EPIDEMIOLOGY:
Due to epidemic of obesity, as a direct consequence, the prevalence of Metabolic syndrome is rising at an alarming rate. Currently, almost 25% of the US population is affected by MetS, and the problem is worse in individuals older than 60 years.3 In diabetic patients, the prevalence was almost around 86%.14
20
differing frequencies of the components and different methodologies of measurement used.14
Decreased physical activities and increased intake of energy dense foods and sugars are the most important contributing factor in the drastic increase in the prevalence of Obesity and hence the Metabolic Syndrome15. A huge hike in the prevalence of obesity (BMI > 30.0) is also documented by the NHANES surveys:
NHANES I: 14.1%
NHANES II: 14.5%
NHANES III: 22.5%.
Metabolic syndrome is a growing health problem, even in countries with lower gross national product, due to ingestion of cheap vegetable oils and increased urbanization rate15.
CURRENT SCENARIO IN INDIA:
In Asian Indians, the prevalence of the metabolic syndrome differs according to the area, the extent of urbanization, patterns of life style and cultural or socio-economic factors. According to a recent data, in large cities in India, the prevalence accounts for about one-third of the urban population16.
21 1. Abdominal obesity - 31.4%
2. Hypertriglyceridemia - 45.6% 3. Low HDL - 65.5%
4. Hypertension - 5.4%
5. Raised fasting plasma glucose - 26.7% 16
The prevalence of metabolic syndrome in rural areas are comparatively low. According to a recent survey, the overall prevalence was around 5.0% in rural adults16.
The prevalence of metabolic syndrome in paediatric and adolescent population is not uncommon. Because, obesity is prevailing in all age groups, it is not surprising that children are not immune to it. The prevalence of obesity in urban children in Delhi was found to be 16% in 2002, which increased to 29% in 2007. The overall prevalence of metabolic syndrome in pediatric population of developed countries varies from 3.1% to 12.7%. In India, in adolescent age group, it is about 4.2%. No gender difference in distribution was found16. The increasing prevalence of obesity in pediatric age group is the main initiating factor of MetS in children17.
As pediatric metabolic syndrome is a precursor to adult metabolic syndrome, there is no surprise that the prevalence of metabolic syndrome will rise up in the upcoming years16.
22
ATP III - 40.3%
WHO - 30.6%
IDF - 34.9%18
There is variation in the occurrence of MetS among different ethnic groups. Reassessment should be done in the criteria defining MetS especially in Asian Indians. Cut-offs of WC and BMI in the definition can be modified to yield higher rates of diagnosis of MetS19. .
Even though the risk of developing Metabolic syndrome has been attributed extensively to life style factors, like smoking, physical inactivity, and unhealthy eating habits, certain studies have suggested that the predisposition begins in utero20.
In 199β, Hales and Barker proposed “the Thrifty Phenotype”, which said that the susceptibility of an offspring to acquire adult chronic diseases occurs as a consequence of exposures or insults in the prenatal and postnatal periods20.
In offsprings, epigenetic changes may occur in glucose-insulin metabolism causing Insulin resistance and defects in secretion of insulin, as a consequence of maternal obesity and Insulin resistance20.
23
investigated. With a better understanding of the mechanisms, prediction and prevention of complications of pregnancy can be improved, thereby improving the betterment of the mother and the offsprings20.
CLINICAL IMPORTANCE OF METABOLIC SYNDROME:
1. It predisposes to multiple associated disorders.
2. It serves as a target for treatment and prevention of these disorders. 3. It is extremely common nowadays21.
DEFINITION AND DIAGNOSIS:
MetS is considered as disturbance in body metabolism. It involves insulin resistance and inflammation. It predisposes to Hypertension, diabetes mellitus and atherosclerosis. These diseases in turn increase the risk of CVD22.
The Metabolic syndrome is also designated as:
The Insulin Resistance Syndrome,
The Syndrome X,
The Dysmetabolic Syndrome,
HONDA [Hypertension, Obesity, Non-Insulin-Dependent Diabetes Mellitus, Dyslipidemia, And Atherosclerotic Cardiovascular Disease]
The Deadly Quartet23, 24.
24
Obesity with Dyslipidemia [high Triglycerides and low High-Density Lipoprotein Cholesterol] And Hypertension23, 21, 25, 26, 27.
Obesity predisposes to some extent of Insulin Resistance almost always. Failure of tissues to respond to Insulin may be due to two reasons:
i. Reduction in affinity or number of Insulin receptors
ii. Normal binding of Insulin, but abnormal post receptor responses.
It is a general rule, that with increase in amount of body fat, there is increase in the resistance to Insulin, in the tissues which are normally Insulin sensitive28.
The syndrome usually occurs in individuals with frank obesity, but can occur in non-obese individuals, with increased abdominal fat29.
The factors defining Metabolic syndrome are interconnected and include physiological, biochemical, metabolic and clinical factors1. The risk factors include atherogenic dyslipidemia, hypertension, glucose intolerance, proinflammatory and a prothrombotic state1,11. They predispose to the risk of Cardiovascular disease, Type 2 Diabetes Mellitus and all cause mortality1.
Prothrombotic state is due to:
i. Increase in pro-coagulant factors – fibrinogen, factor VII.
ii. Increase in antifibrinolytic factors – Plasminogen Activator Inhibitor –1. iii. Platelet aberrations.
25
Proinflammatory state is due to increase in circulating levels of cytokines and acute phase reactants like C-reactive protein11.
The state of chronic, systemic and low-grade inflammation, associated with MetS, is involved in the pathogenesis of consequent Insulin resistance and atherosclerotic lesions30.
The concurrent presence of MetS and insulin resistance is a high risk for developing CVD25.
Insulin sensitivity varies widely in normal individuals. The metabolic traits associated with insulin resistance include:
1. Hyper insulinemia
2. Some degree of glucose intolerance 3. Abdominal obesity
4. Dyslipidemia [high triglycerides, low high-density lipoprotein cholesterol]
5. Elevated blood pressure 6. Elevated c-reactive protein
7. High Plasminogen Activator Inhibitor – 1 levels
8. A positive family history of type 2 diabetes mellitus31, 29.
In patients with Metabolic syndrome, the risk of mortality from Cardiovascular problem is about two times compared to normal individuals. Also, there is a fivefold increased risk of developing frank Type 2 Diabetes Mellitus32, 33.
26
An Italian study based on large population, proposed that the risk of mortality from all causes including cardiovascular accidents, increased with the number of metabolic abnormalities:
- Increased blood sugar - Increased blood pressure - High Triglycerides
- Low HDL cholesterol, in both gender34.
The Framingham offspring study reported that individuals with at least three risk factors associated with Metabolic syndrome, had 2.4 fold increased risk for Cardiovascular disorders in men and 5.9 fold in women34.
Another study, Lakka et al also emphasized the importance of CVD in patients with MetS. The study was done in middle-aged men and they were followed for 11.4 years. The result is that, even in the absence of Diabetes or prior CVD, there is significant increased risk of CVD in the presence of MetS34.
Another population based study revealed that the risk of CVD increases with the number of components of MetS.
27 These studies highlight two facts:
1. The importance of creating awareness among clinicians regarding the strong association between MetS and CVD.
2. The urgent need to intervene and modify the fatal cascade of events in patients with MetS, which has got significant impact on the society34.
Even normal-weight subjects can develop Metabolic syndrome. Also the syndrome is not seen in all obese individuals32,17.
DIAGNOSTIC CRITERIA PROPOSED FOR THE CLINICAL DIAGNOSIS OF THE METABOLIC SYNDROME:
28
DIAGNOSTIC CRITERIA FOR METABOLIC SYNDROME:
MEASURES WHO(1998)1,26
INSULIN RESISTANCE IGT, IFG, T2DM, or Lowered insulin sensitivity plus any 2 of the following
GLUCOSE IGT, IFG, OR T2DM
BODY WEIGHT Men: waist-to-hip ratio > 0.90
Women: waist-to-hip ratio > 0.85 and/or
BMI > 30 kg/m2
BLOOD PRESSURE ≥ 140/90 mm Hg
LIPIDS TGs ≥ 150 mg/dL and/or HDL-C < 35 mg/dL in men or < 39 mg/dL in women
OTHERS Microalbuminuria: Urinary excretion rate of > 20 mg/min or
29
DIAGNOSTIC CRITERIA FOR METABOLIC SYNDROME:
MEASURES EGIR(1999)1
INSULIN RESISTANCE Plasma insulin > 75th percentile plus any 2 of the following
GLUCOSE IGT or IFG (but not diabetes)
BODY WEIGHT Waist circumference ≥ 94 cm in men or ≥ 80 cm in women
BLOOD PRESSURE ≥ 140/90 mm Hg or on Hypertension treatment
30
DIAGNOSTIC CRITERIA FOR METABOLIC SYNDROME
MEASURES ATPIII (2001)1,31,23,35,36
Any 3 of the following 5 features
INSULIN RESISTANCE None
GLUCOSE >110 mg/dL (includes Diabetes)
BODY WEIGHT Waist circumference ≥ 10β cm in men or ≥ 88 cm in women
BLOOD PRESSURE ≥ 1γ0/85 mm Hg
LIPIDS TGs ≥ 150 mg/dL
HDL-C < 40 mg/dL in men or
31
MEASURES AACE(2003)1
INSULIN RESISTANCE IGT or IFG, plus any of the following based on the clinical judgement
GLUCOSE IGT or IFG (but not Diabetes)
BODY WEIGHT BMI ≥ β5 kg/m2
BLOOD PRESSURE ≥ 1γ0/85 mm Hg
LIPIDS TGs ≥ 150 mg/dL and/or HDL-C < 35 mg/dL in men or < 39 mg/dL in women
OTHERS Other features of Insulin Resistance (includes family history of Diabetes Mellitus, Polycystic Ovary Syndrome, Sedentary life style, advancing Age, and Ethnic groups susceptible to Type 2 Diabetes Mellitus)
32
DIAGNOSTIC CRITERIA FOR METABOLIC SYNDROME:
MEASURES IDF(2005)1,37,35,38,39
INSULIN RESISTANCE None
GLUCOSE ≥ 100 mg/dL (includes diabetes)
BODY WEIGHT Increased waist circumference (population specific) plus any 2 of the following
BLOOD PRESSURE ≥ 1γ0 mm Hg systolic or ≥ 85 mm Hg diastolic or on hypertension treatment
LIPIDS TGs ≥ 150 mg/dL or on TGs treatment
HDL-C < 40 mg/dL in men or < 50 mg/dL in women or on HDL-C treatment
OTHERS Other features of insulin resistance (includes family history of Diabetes Mellitus, Polycystic Ovary Syndrome , Sedentary Life Style,
33
But, the inclusion of Abdominal adiposity in the criteria may miss the mortality due to CVD in non-obese individuals40.
Even in patients with frank Diabetes mellitus, a subgroup of patients with the greatest risk of CVD was missed, using the IDF definition of Metabolic syndrome. The definition proposed by IDF is more restrictive as it requires the presence of abdominal obesity for diagnosing MetS. As a consequence, patients despite having Dyslipidemia and Hypertension, without abdominal obesity will not be diagnosed as having MetS41.
ANTHROPOMETRIC MEASUREMENTS: BODY MASS INDEX (BMI):
BMI is defined as the weight in kilograms divided by the height in meters, squared. If height cannot be measured, the Demispan or the Knee height can be used to calculate height with the following formulae:
1. Height = 0.73 x (2 x demispan) + 0.43
[Demispan: It is measured from the Sternal notch to the middle finger]
2. Height (cm) = [knee height (cm) x 1.91] – [age in years x 0.17] + 75
For females (60 to 80 years)
3. Height (cm) = [knee height (cm) x 2.05] + 59.01
34
BMI is increased by muscle mass and does not discriminate between lean body mass and fat mass. Normal BMI should be around 18.5 - 24.9 kg/m2 .42
WAIST CIRCUMFERENCE (WC):
WC indicates the degree of abdominal obesity and is measured at the level of umbilicus. Hip circumference is measured at the level of the greater trochanters. Waist - hip ratios help to define the fat distribution whether it is Android or Gynoid42.
BODY FAT DISTRIBUTION:
The distribution appears to be more important compared with the absolute amount of excess adipose tissue, in terms of complications of obesity. Central obesity (increased intra-abdominal fat) is more closely associated with type 2 diabetes mellitus, metabolic syndrome and cardiovascular diseases, when compared to Generalised obesity.
Other names for Central obesity: Abdominal obesity, Visceral obesity,
Apple-Shaped obesity or Android type of obesity;
35 PATHOGENESIS:
A cluster of metabolic derangements are often seen associated with insulin resistance which are collectively referred to as Dysmetabolic syndrome or Syndrome X. The central abnormality predisposing to the Metabolic syndrome is the Insulin Resistance24.
“Insulin Resistance” usually denotes resistance towards the functional effects of insulin in glucose uptake, metabolism, or storage43. It can be defined as the functional inability of insulin to exert its normal biological functions at concentrations, which are effective in normal individuals32, 33.
It is characterized by reduced insulin mediated glucose transport and metabolism in Adipose tissue and Skeletal muscle and also by impaired suppression of glucose synthesis in the liver43,33. The resulting hyperglycemia, leads to the compensatory rise in secretion of Insulin32.
The defects are also due to impairment of insulin signalling in the target tissues and also from down regulation of GLUT4, the major Insulin responsive glucose transporter, in Adipose tissue. The entire cascade of Insulin signalling is affected, which includes:
1. Binding of insulin to its receptor,
36 3. Activation of Tyrosine kinase activity,
4. Phosphorylation of insulin responsive substrate proteins43.
In adipose tissue, a proposed mechanism for the signalling defect is excessive expression and activity of many PTPs (Protein Tyrosine Phosphatases), which by dephosphorylation terminates the signalling cascade, in obese individuals. The expression and functional activities of the following three PTPs is increased in Skeletal muscle and Adipose tissue of the obese people, leading to Insulin Resistance:
1. PTP1B,
2. LAR (Leukocyte Antigen-Related Phosphatase), 3. SHP2 (Src-Homology-Phosphatase 2).43
In adipose tissue, Insulin Resistance results in elevated levels of free fatty acids in circulation, because of impairment of suppression of lipolysis by Insulin. This abnormal Insulin mediated suppression of producing circulating free fatty acids is considered as an early manifestation in people with genetic predisposition for insulin resistance15.
37
EFFECTS OF BODY FAT DISTRIBUTION IN OBESITY:
The Intra-abdominal fat drains into the Portal vein, and so directly reaches the liver. It is metabolically active and releases enormous amounts of Free Fatty Acids (FFAs), Adipokines (Tumour Necrosis Factor - Alpha, Adiponectin, and Resistin) and Steroid hormones. All these molecules reach the liver in high concentrations from the adipose tissue. The FFAs predispose to Insulin Resistance because they compete with glucose for oxidation in peripheral tissues as a fuel supply and hence to Type 2 Diabetes Mellitus42. Adipokines are structurally similar to Cytokines and hence their name. They exert their actions on specific receptors to influence Insulin sensitivity in the tissues. So, Central obesity have a profound influence on insulin sensitivity in the liver and affects Carbohydrate and Hepatic Lipid metabolism39.
In normal individuals, the origin of majority of fatty acids reaching the liver is from lipolysis of the subcutaneous adipose tissue. Only 5-10% comes from the visceral adipose depot, but in individuals with visceral obesity, it is increased to 30%. Normally, less than 5% of fatty acids come from the denovo synthesis by liver, and this is also significantly increased in fatty liver patients32. The high lipolytic rate of the intra abdominal visceral fat (Omental
38
of gluconeogenesis by insulin, in turn leading to excessive Hepatic glucose production. Also, the FFAs in Liver affect the Insulin mediated disposal of glucose to the peripheral tissues, mainly the skeletal muscle. The increased FFAs in the liver also contribute to peripheral Hyperinsulinemia by reducing the extraction of Insulin into the Liver tissue44.
Weight loss rapidly reduces Hepatic fat content and improves Insulin sensitivity32. The presence of enlarged adipocytes in the visceral adipose tissue is a predictor of upper body obesity and its complications. The enlargement of the adipocytes can also be a consequence of the resistance to insulin mediated suppression of lipolysis44. Patients with abdominal obesity have an insulin-resistant type of fibres in their skeletal muscle32.
Although Obesity is clearly associated with CVD, it is mainly mediated by other cardiovascular risk factors like hypertension, diabetes and lipid profile imbalances45.
EFFECTS OF FREE FATTY ACIDS: 1. Inhibits Insulin mediated glucose uptake.
2. Impairs Insulin mediated suppression of endogenous glucose production. 3. Impairs glucose mediated suppression of endogenous glucose production. 4. Stimulates short-term Insulin secretion.
5. Inhibits long-term Insulin secretion, possibly due to Islet toxicity.
6. Reduces Hepatic clearance of Insulin.
39 HEPATIC INSULIN RESISTANCE :
Normally, Insulin action of lowering plasma glucose level is by
1. Suppression of hepatic gluconeogenesis
2. Decreasing uptake of amino acids and free fatty acids from muscle and adipose tissue to liver and
3. Favouring glucose uptake by skeletal muscle and adipose tissue.
Compared to adipose tissue, the Insulin mediated uptake of glucose by muscle is ten times more. This is because of the greater muscle mass.15 For Insulin to effectively suppress gluconeogenesis in the liver; normal Insulin responsiveness is required at the Adipocytes. So, suppression of endogenous glucose production is in part depends on the ability of Insulin to decrease the levels of FFAs. 15
INSULIN RESISTANCE AND DYSLIPIDEMIA:
The risk factor for Coronary artery disease in the syndrome is the existing Dyslipidemia. The main cause for Dyslipidemia is excessive synthesis of apolipoprotein B containing VLDL (very low density lipoprotein) particles. 24
The physiological function of Insulin is to suppress VLDL production, in particular Apolipoprotein B particles, in the liver, by the following mechanisms:
40
2. Direct hepatic effect - by affecting the assembly and hence the synthesis of VLDL.32, 33
In Metabolic syndrome, the synthesis of apolipoprotein B by the liver is increased. It is also increased by the occurrence of large quantities FFAs in the portal circulation, which are released from the visceral adipose tissue as a consequence of increased lipolysis. Insulin and FFAs also mediate the transfer of lipids to apolipoprotein B, by increasing the levels of Microsomal Triglyceride Transfer Protein and moreover, they reduce the degradation of apolipoprotein B by Ubiquitination-dependant pathway. 24
In skeletal muscle, Insulin resistance is directly related to the intra-myocellular Triglyceride concentration29.
As a consequence of the VLDL triglyceride overproduction, there occurs exchange of VLDL triglyceride to HDL (High Density Lipoprotein) – cholesterol esters by the action of Cholesterol Ester Transfer Protein24.
The triglyceride-rich HDL molecules are good substrates for degradation by Hepatic Lipase32. Hepatic lipase hydrolyze these HDL molecules, to produce small HDL molecules, which are easily degraded by the kidney leading to low levels of serum HDL24.
41
hydrolyzed by the hepatic lipase to produce small, dense LDL particles, which are commonly seen in patients with Insulin Resistance24. The small dense LDL particles are highly atherogenic, predisposing the individuals to cardiovascular complications32.
The major risk factors for developing atherosclerosis include the components of MetS like Dyslipidemia, hypertension, diabetes mellitus and smoking. The normal function of the vascular endothelium is altered leading to subintimal aggregation of fat, smooth muscle cells and fibroblasts to form atherosclerotic plaque46.
So, the patients with metabolic syndrome are subjected to aggressive treatment with lipid lowering agents to prevent cardiovascular complications24.
INSULIN RESISTANCE AND HYPERTENSION:
42
Conversely, Hypertension also contributes to Insulin resistance. The defect in vasodilatation reduces the surface area of the vessels perfusing the skeletal muscles, thereby reducing glucose uptake24.
CENTRAL CONTROL OF GLUCOSE METABOLISM:
The hypothalamus and certain other regions of the brain are capable of sensing metabolic requirements and causing alterations in the metabolism as needed. For example, the fatty acids which are taken up by the Mediobasal Hypothalamus alter the feeding behaviour and reduce glucose production by the Liver24. The receptors for Insulin are seen widely in the brain tissue. Insulin regulates satiety by centrally suppressing appetite. The Hypothalamic insulin receptor is very important in regulating hepatic glucose metabolism, because the central inhibition of insulin also decreases the effect of exogenously administered Insulin in suppressing Hepatic glucose production15.
GENETIC CAUSES OF INSULIN RESISTANCE:
43 EXTREME INSULIN RESISTANCE:
Extreme Insulin resistance is due to some rare mutations in genes associated with Insulin action. Associated conditions include Hyper Insulinemia, Dyslipidemia, Hypertension, and Impaired Glucose Tolerance. The skin lesion, Acanthosis Nigricans is characteristic of Insulin resistance. It occurs in the flexures and neck, as a papillomatous pigmented hyperkeratotic lesion. Women with Extreme Insulin Resistance are manifested with Hyper Androgenism, Hirsuitism and Menstrual disorders15.
INSULIN RECEPTOR MUTATIONS:
More than 100 mutations of Insulin receptor gene are known. The complete absence of Insulin receptors have also been reported15.
i. LEPRECHAUNISM: The most severe form of the syndromes with severe Insulin resistance. It is characterised by Intrauterine Growth Retardation, prominent eyes, upturned nostrils, thick lips, posteriorly rotated low set ears, and thick skin lacking subcutaneous fat tissue. Individuals succumb within one year of age15.
44
Due to inappropriately elevated fasting insulin levels, the affected children exhibits fasting hypoglycemia, but they have post prandial hyperglycemia15. iii. TYPE A INSULIN RESISTANCE: It is the mildest form of Insulin receptor gene mutations. It constitutes a triad of Insulin Resistance, Hyperandrogenism (in females) and Acanthosis Nigricans. The patients have mostly a heterozygous mutation often in the receptor’s tyrosine kinase
domain. Most of the people do not develop diabetes. Patients with homozygous alleles are prone to develop frank diabetes in late childhood or adolescence15.
iv. INSULIN MEDIATED PSEUDO ACROMEGALY: A syndrome of severe Insulin resistance associated with pathologic tissue growth similar to that of Acromegaly, but there is no elevation of Growth hormone and IGF-1. The defect lies in the post receptor signalling of Insulin. The severe Hyperinsulinemia activates the mitogenic signalling pathways, which are intact resulting in Acromegaloid tissue growth15.
45
acids after a meal, by the subcutaneous adipose tissue results in lipodystrophy15.
LIPODYSTROPHY:
It includes a group of disorders which are characterised by complete or partial absence of adipose tissue and Insulin resistance.
1. FAMILIAL PARTIAL LIPODYSTROPHY: The patients appear normal at birth, but after puberty they tend to lose the subcutaneous tissue from the gluteal region and extremities. So, the muscles look prominent in these areas. Fat deposition is increased in the face, neck, axilla, abdominal cavity and labia majora. Imaging studies show complete absence of adipose tissue in the affected regions. The adipose tissue is preserved in intra-thoracic, intra-abdominal, inter-muscular and bone marrow. Inter-muscular fat is excessively accumulated. Several mutations were identified by genetic studies in these patients, in the gene LMNA, which codes for Lamin A and Lamin C. These are structural proteins present in the nuclear membranes of myocytes and adipocytes and aid in DNA replication in these cells15.
46
usually in early childhood due to cardiac complications. The mutations associated with this syndrome are found in two different genes on different chromosomes:
i. AGPAT2 gene coding for the enzyme, 1-acyl glycerol-3-phosphate-O-acyl transferase
ii. BSCL2 gene encoding a protein called, SEIPIN, whose function is
not known.
The enzyme, 1-Acyl Glycerol-3-Phosphate-O-Acyl Transferase catalyzes a key step in triacylglycerol synthesis. It helps in the formation of Phosphatidic acid by acylation of Lyso-phosphatidic acid. So, if this gene gets mutated, triacyl glycerol synthesis is affected. Hence, storage of triacylglycerol in adipose tissue is not possible leading to Congenital generalised lipodystrophy15.
COMMON POLYMORPHISMS CAUSING INSULIN RESISTANCE:
1. P85 subunit of PI3K (1-Phosphatidyl Inositol 3-Kinase) codon 326 Methionine Valine; This resulted in reduced insulin sensitivity.
2. 1-G972R polymorphism. This results in reduced binding between IRS-1 and the p85 subunit of PI3K and thereby reduces IRS-IRS-1 mediated PI3K functional activity.
3. Gene 3q27 coding for Adiponectin, resulting in decreased levels of
47
Adiponectin is synthesized in Liver. Its hormonal action in liver is to decrease inflammation and to increase sensitization to Insulin, thereby decreasing Hepatic lipid content. Serum levels of Adiponectin is considerably lowered in patients with Metabolic syndrome, compared to normal individuals.32
INSULIN SECRETION IN OBESITY AND INSULIN RESISTANCE:
To maintain glucose homeostasis, normal Insulin secretion is essential. So, in patients with obesity and Insulin resistance, as a compensatory mechanism, hyper-secretion of insulin occurs. The blood glucose level is determined by the ability of the pancreatic beta cells; the patient may be normo-glycemic or may develop impaired glucose tolerance or Diabetes. The hyper secretion of Insulin, even in the presence of normo-glycemia, occurs due to increase in sensitivity of beta cells to glucose47. This increase in sensitivity is due to two factors:
1. Increased beta cell mass of pancreas.
2. Increased expression of Hexokinase compared to Glucokinase expression in the beta cells47.
48
clearance. The rate of Insulin secretion is three to four times higher in obese people and it has a strong correlation with the Body mass index. 50% of the total Insulin produced daily comes from the basal secretion; and Insulin secretory pulses occur every 2 hours. This is similar to the normal temporal pattern of Insulin secretion found in non-obese individuals. The difference lies in the amplitude of the post prandial pulses, which is much higher in obese people47. In Impaired glucose tolerance, this temporal pattern of Insulin secretion is altered. The impairment lies in the capability of beta cells in sensing and responding to the changes in the plasma glucose levels. This altered temporal pattern of Insulin secretion is considered to be an early manifestation of dysfunction of beta cells, leading on to Type 2 Diabetes Mellitus47.
In Type 2 Diabetes Mellitus, again in response to insulin resistance, hyperinsulinemia occurs. But the degree of hyperinsulinemia is low compared to the plasma glucose levels. Abnormality of beta cells lies in the first phase of insulin secretion47.
MEDICAL CONDITIONS CAUSING INSULIN RESISTANCE:
1. Auto-immune disorders, including Systemic Lupus Erythematosus, due to the presence of antibodies against insulin receptor.
2. Renal failure and Uremia, accumulation of Uremic toxins, raised levels of Growth Hormone and Glucagon and Metabolic Acidosis.
49
4. Familial Hemochromatosis, where Insulin secretion and Insulin action are related to the extent of hepatic iron accumulation.
5. Thalassemia major, due to transfusion-induced iron overload.
6. Many types of cancer - Gastrointestinal and Pancreatic tumours, due to inhibition of Insulin action by cytokines, TNF-alpha and IL-6.15
NUTRIENT EXCESS AND ITS EFFECTS ON SYSTEMIC INSULIN ACTION:
Our body cells have the capability to sense the availability of nutrients, and accordingly regulate insulin signalling or glucose transport or both15.
1. GLUCOSE TOXICITY: Chronic hyperglycemia has inhibitory action on insulin secretion and action. The proposed mechanism of insulin resistance mediated by hyperglycemia includes:
a. Down regulation of glucose transport system b. Defect in Insulin mediated synthesis of glycogen15. HEXOSAMINE BIOSYNTHETIC PATHWAY: (HBP pathway)
50
GLUCOSE GLYCOLYSIS MALONYL CoA -
GLUCOSE-6 FRUCTOSE-6 FATTY ACYL CoA PO4 PO4 DAG
GFAT CERAMIDES
GLUCOSAMINE-6-PO4 +
+
+ -
GENE INSULIN TRANSCRIPTION SIGNALLING
Normally, only 1 to 3% of glucose, which gets converted to fructose-6-phosphate, enters this pathway to synthesize Uridine diphosphate-N-acetyl glucosamine (UDP-N-GlcNac). UDP-N-GlcNac is the main substrate for glycosylation of proteins and its intracellular concentration is nutritionally regulated. The activities of many enzymes and transcription factors are regulated by the glycosylation of their serine or threonine residues. In hyperglycemia, when more glucose enters the pathway, glucose will not be available for glycogen synthesis and glycolysis15.
HEXOSAMINE
51
The first and rate-limiting step of this pathway is catalyzed by the enzyme Glutamine: Fructose-6-phosphate Amidotransferase (GFAT). Glutamine is required for this rate limiting step of the pathway and hence glutamine analogues are being used to hinder the pathway and hence insulin resistance mediated by hyperglycemia15.
2. LIPID TOXICITY: Persistent increase in circulating free fatty acids is a hallmark of Insulin resistance15.
IMPACT OF FREE FATTY ACIDS ON INSULIN:
a. SKELETAL MUSCLE: The main effect is inadequate suppression of oxidation of fatty acids by Insulin. An increase in the availability of free fatty acids leads to increased in the mitochondrial Acetyl CoA/CoA ratio and NADH/NAD+ ratio. This in turn inactivates the enzyme, Pyruvate dehydrogenase and Phosphofructokinase by feedback mechanism. So, the intracellular concentrations of glucose-6-phosphate gets elevated which again by feedback mechanism causes inhibition of Hexokinase activity, which further leads to increased intracellular glucose concentration and reduced glucose uptake15.
52
FFAs inhibit Fructose-6-Phosphate from entering into glycolytic pathway, shunting it into the HBP pathway forming increased amount of glucosamine-6-phosphate15.
b. LIVER:
The extent of hepatic Insulin resistance correlates well with the fat content of Liver32. As already mentioned, the FFAs increases endogenous production of glucose by inhibiting Insulin mediated suppression of Hepatic gluconeogenesis. The FFAs increases the activity of Hepatic Glucose-6-phosphatase more compared to the increase in the activity of Glucokinase, thus increasing the glucose output from liver. Fatty acid oxidation is inhibited by suppressing the enzyme, CPT-1, which in turn is caused by the elevation of malonyl CoA. This favours fatty acid esterification resulting in increased synthesis of Triglycerides and VLDL, contributing to the dyslipidemia of Insulin resistance15.
OXIDATIVE STRESS:
53
Increased availability of nutrients leads to consequent increase in reactive oxygen species (ROS). The ROS activates isoforms of Protein kinase C, leading to synthesis of AGEs (Advanced Glycation End products). 15
AGING:
With advancing age, increased incidence of Insulin Resistance is seen15. In most populations in the world, the age dependency for the prevalence of the syndrome is found to be true17.
The causes are:
1. Increased fat depot, in particular visceral fat. 2. Increased cytokines levels in circulation.
3. Increased accumulation of Triglycerides in the cells.
4. Decline in Mitochondrial functions mainly Oxidative Phosphorylation. 5. Resistance to effects of Leptin on fat distribution leading to increased lipid
accumulation in tissues.15
54 METABOLIC SYNDROME AND CVD:
Individuals with MetS are at increased risk of CVD and total mortality, especially in men aged 45 years and women aged 55 years26,48. And those with frank diabetes or prior CVD are at a even higher risk26. Simultaneous occurrence of Hypertension and impaired glucose metabolism has the highest risk and accounted for the most of the deaths36. Patients with manifestations of atherosclerosis and MetS are at increased risk of CVD and total mortality, irrespective of the presence or absence of Type 2 Diabetes mellitus38.
In Coronary Heart Disease patients, Metabolic syndrome prevails in almost 50%. With proper Cardiac rehabilitation and life style modifications, the
GENETIC
FACTORS
ENVIRONMENTAL
OBESITY
FACTORS
55
PATHOGENESIS OF METABOLIC
SYNDROME
56
METABOLIC SYNDROME
57
prevalence of the syndrome can be markedly lowered37. Both overweight and non-overweight individuals with metabolic risk factors should be targeted to bring down the burden due to CVD in general population35.
INTER-RELATION AND OVERLAP OF METABOLIC SYNDROME WITH INSULIN RESISTANCE, PRE-DIABETES AND TYPE 2
DIABETES11:
METABOLIC SYNDROME
INSULIN RESISTANCE
PRE-DIABETES (75% MetS)
`TYPE 2 DIABETES(86%MetS)
CARDIOVASCULAR DISEASE
58
FGF-19 (FIBROBLAST GROWTH FACTOR 19)
A large number of signals getting released from enterocytes are known to regulate feeding, blood glucose and induce satiety. Some of them include Cholecystokinin, Ghrelin, peptide YY, Oxyntomodulin and Glucagon-like peptide. Recently, FGF 19 is being added to the list of Gastrointestinal hormones regulating metabolism.50
FGF 19 is a unique member of the Fibroblast Growth Factor family.51
The members of the family are known to be involved in:
Embryonic development Cell growth and survival Morphogenesis
Tissue repair - Wound healing
Tumour growth and Angiogenesis51,52.
The FGF signaling pathway is a ubiquitous micro environmental regulator of adult homeostasis and cell to cell communication4.
FGFRS (FIBROBLAST GROWTH FACTOR RECEPTORS):
59
After binding, dimerisation of receptors occurs followed by activation of Tyrosine kinases. They are encoded by four different genes, Fgfr1 to Fgfr453. Initially FGF proteins were characterized by their ability to promote proliferation of fibroblasts. FGFRs 1, 2 and 3 mediated this mitogenic activity. FGFR4 was identified then to possess the ability to bind FGFs, but lacks mitogenic proliferation54.
FGFR signalling plays a major role in regulating glucose homeostasis and energy balance55,56.
Their interactions with FGFRs is promoted by their high affinity to Heparan sulphate, a glycosaminoglycan found on the cell surface.51
The structure of FGFRs1-4 constitutes three domains each: 1) An extracellular ligand binding domain,
2) A single transmembrane domain,
3) An intracellular Tyrosine kinase domain.5
FGF FAMILY:
The FGF family constitutes about 22 members, including FGF 1 to FGF 23. FGF 15 is not found in Humans. They are further divided into three subfamilies:
60
The canonical FGFs have binding sites for Heparin for stable interactions with FGFRs. Hormone like FGFs have reduced affinity to heparin, and hence they are endocrine in function. This property of hormone-like FGFs is acquired during evolution57. Instead they require klotho proteins, which acts as a co-receptor/co-factors to facilitate their binding with their cognate receptors in the target tissues57,58.
FGF 19 subfamily consists of FGF 19, FGF 21 and FGF 2358,59 . They are involved in regulation of bile acid, glucose, lipid, phosphate, energy and vitamin D homeostasis, by acting in an endocrine fashion. They require interaction of α or klotho proteins58
.
The extremely low affinity of FGF 19 subfamily to Heparan sulfate, permits their circulation to reach distant tissues, as a hormone, to bind with FGFR and Klotho proteins.60
61
Human FGFs comprises of about 150 to 300 amino acids. A core residue with 120 amino acids is conserved among the family members. The members have 30 to 60% identity among themselves57. Based on the similarities in sequences and functions, human FGFs can be classified in to seven subfamilies.5
FGF FAMILY MEMBERS: FGF1 subfamily
- FGF1 (Acidic FGF) - FGF2 (Basic FGF)
FGF4 subfamily
- FGF4 - FGF5 - FGF6
FGF7 subfamily
- FGF3 - FGF7 - FGF10 - FGF22 FGF8 subfamily
- FGF8
62 FGF9 subfamily
- FGF9 - FGF16 - FGF20 FGF11 subfamily
- FGF11(FHF 3)
- FGF12 (FHF 1) - FGF13 (FHF 2) - FGF14 (FHF 4) FGF19 subfamily
- FGF19 - FGF21 - FGF23.63
FGF 19:
Human FGF 19 is a 24 kD protein.64 Following a meal, FGF 19 is secreted from the ileum, binds to FGFR4 and klotho protein, and mediates
postprandial responses65. FGF 19 from ileum reaches the hepatocytes through portal circulation, to exert its effects, acting as a entero-hepatic signal66,7,67.
63
64
synthesis of bile acids and glucose respectively. Synthesis of Glycogen and protein is stimulated.65, 8
Bile acid not only induces FGF 19 secretion from the intestine; they also activate the FGF 19/FGFR4 signalling in hepatocytes. This helps in inhibition of bile acid synthesis and also prevents excess accumulation of toxic bile contents in the Liver.66
FGF 19 is unique in the way that:
1. It has lower affinity towards Heparan sulphate; instead they use transmembrane receptors called as -klotho.51
2. Unlike other FGFs, it acts specifically on FGFR4 alone, which has no mitogenic response51,54,63.
3. It performs endocrine functions in addition to its autocrine and paracrine functions. 51
Endocrine functions - Bile acid, Glucose and Lipid Metabolism.
Paracrine functions - Embryogenesis, Cell Growth and Differentiation, and
Angiogenesis.
Autocrine functions - Promotes proliferation and invasion of cancerous
tissues.51
65
FGF 19 transcripts are seen in many tissues like Brain, Skin, Gall Bladder, Kidney, Umbilical cord, Cartilage and Intestine, but it is primarily expressed in Ileum6,51,69,70. Even though it is secreted in the ileum, the specific FGFR4 receptors occurs in Liver in large numbers51,52. This contributes to the metabolic effects of FGF 19.
FGF 19 is a postprandial enterokine, derived from Ileum that governs metabolic processes71.FGF 19 is a peptide hormone consisting of 216 amino acids9. It was originally identified in chick embryos as a promoting factor in inner ear development2.
FGF 19 consists of two disulfide bonds. The disulfide bonds are important for stability, protein folding and activity and are more common in mammalian proteins72. The intra-molecular disulfide bond contributes to their plasma stability and facilitates them to function as hormones on distant tissues58. FGF 19 is stable for up to ten minutes in blood and brain. Entry of FGF 19 in to brain depends on its serum concentration. In the basal state, the role of FGF 19 in regulating metabolism dominates its action on the central nervous system. Excretion of FGF 19 is by the Kidneys. In end stage renal disease, FGF 19 concentration is found to be elevated in the blood.73
66
the enterocytes9. So, in response to food intake, concentration of serum FGF 19 is increased8.
Bile salts negatively regulate their own production.74,67 They help in digestion and absorption of dietary lipids in the proximal parts of small intestine. After fulfilling their function, bile salts reach the terminal ileum and activate FXR to secrete FGF 1974. The secretion of FGF 19 represents a transition between the fed and the fasting states, acting as a late postprandial signal6.
FXR is capable of controlling various metabolic pathways. They regulate synthesis of bile acids, conjugation and transport, upon activation by bile acids and also different aspects of Carbohydrate and lipid metabolism3.
The functional FGF receptor complex comprises of: Trans membrane tyrosine kinase Heparan sulfate
Activating FGF.52, 5
FIBROBLAST HOMOLOGOUS FACTORS(FHFs):
67
MODE OF ACTIONS OF FGF 19 FAMILY MEMBERS63: FGF 19 FGF 21 FGF23
ADIPOSE
LIVER TISSUE KIDNEY
BILE ACID CARBOHYDRATE & PHOSPHATE & METABOLISM LIPID METABOLISM VITD METABOLISM
ROLE OF FGF 19 IN BODY METABOLISM: 1. BILE ACID METABOLISM:
Bile acid synthesis forms a major pathway for catabolism of cholesterol in humans. Cholesterol is hydroxylated at position 7 by the enzyme cholesterol 7 α
hydroxylase (Cyp7a1) in Endoplasmic reticulum. This is the rate limiting step in bile acid synthesis. This step is under feedback inhibition51.
68
THE PHYSIOLOGY OF FGF 19:
INTESTINE
LIVER
In the intestine, the bile acids activate the nuclear receptor in the enterocytes, called the Farnesoid X receptor (FXR)51,75. Then, FXR increases the secretion of FGF 19 by the ileum, FGF 19 binds to FGFR4 in liver and inhibits transcription of Cyp7a1 gene, thereby repressing bile acid synthesis,51,6. This
BILE ACID
FXR
FGF 19
LIPOLYSIS
LIPOGENESIS
ACC2, SCD
CYP7A1
69
feedback inhibition is also mediated by increased expression of SHP-1(Small Heterodimer Partner-1), a member of the nuclear receptor family. This in turn inhibits the expression of Cyp7a151,76. Increased flux of bile acids is followed by a peak in serum FGF 19 levels in about 90 to 180 minutes after a meal. FGF 19 deficiency is an important factor causing bile acid malabsorption. It can be treated with FXR agonists, which in turn stimulates FGF 19 secretion, which covers for FGF 19 deficiency and bile acid diarrhoea can be prevented. But the property of tumorigenesis of FGF 19 limits the use of such treatments leading to increased FGF 19 levels in serum than the physiological level51. But, now M70, a non-tumorigenic variant has been engineered, retaining all other biological functions is available51,64. So the hopes of using FGF 19 in treatment of metabolic diseases have increased tremendously.
2. GLUCOSE AND PROTEIN METABOLISM:
FGF 19 is known to lower blood glucose levels. It promotes glycogen synthesis and protein synthesis in muscle and liver, similar to Insulin51,71,77.
Glycogen synthase is the rate limiting enzyme of the pathway of Glycogen synthesis. It is active in its dephosphorylated state and becomes inactive when phosphorylated. Glycogen synthase kinase γα (GSK γα) and GSK γ are the
70
M
ECH
ANI
S
M OF ACTIO
71
The Eukaryotic Initiation Factor 4F (eIF4F) complex mediates protein synthesis. It is responsible for binding of mRNA to the ribosomes and hence mediates initiation of translation. The complex consists of two major proteins:
eIF4B eIF4E
FGF 19 phosphorylates these proteins and activates them aiding in initiating translation. FGF 19 also increases the phosphorylation of rpS6 (ribosomal subunit protein S6), which in turn lead to increase in global protein synthesis51.
Hence the actions of FGF 19 is similar to Insulin in phosphorylating the eukaryotic initiation factors and the ribosomal protein S6, but differs in the further pathway downstream. Insulin acts through the mTOR pathway, by increasing the phosphorylation of protein kinases AKT and p70 S6 kinase. In contrast, FGF 19 acts via phosphorylation of p90 S6 kinase by activating ERK1 and ERK2. So, FGF 19 acts in a parallel fashion but independent of the pathway of Insulin in governing protein synthesis in Liver51.
3. LIPID METABOLISM:
72
induces Fatty acid oxidation. FGF 19 also down-regulates the enzyme Stearoyl CoA desaturase, which in involved in Lipogenesis70.
FGF 19 by increasing the oxidation of fatty acids, reduces Triglyceride concentration9. Unlike Insulin which favours lipogenesis, FGF 19 inhibits fatty acid synthesis51,71 and decreases the expression of enzymes of lipogenesis in liver cells2.
4. MITOGENIC ROLE:
Induction of tumour and cancer: FGF 19 has potent mitogenic activity. The FGFR-FGF 19 signalling is found to play a major role in development and progression of HCC (Hepato Cellular Carcinoma). FGF 19 is over expressed in cancerous liver. Treatment with recombinant FGF 19 resulted in increased proliferation and invasion of the cancerous tissue and also inhibits Apoptosis in cancer cells51.
5. ANGIOGENESIS:
FGF 19 acts s a major growth factor is expressed during development of
retina. In lens cells, it is necessary for differentiation of lens fibres and its survival.
It is involved in patterning of retina in the nasal-temporal region and in
guiding the axons of retinal ganglion cells. It regulates cell division.
It also plays a role in the development of forebrain and is significantly
73
74
It helps in development of embryonic spinal cord.
It is critical for development of ventral regions of diencephalon and
telencephalon.
It is involved in the specification of oligo dendrocytes and GABAergic
interneurons in the ventral region of diencephalon and telencephalon. Inhibition of functions of FGF 19 affects brain development during
mid-segmentation stages, resulting in reduction in the size of cerebellum, forebrain and midbrain.
FGF 19 helps in development of inner ear, by aiding in patterning of the
neuro ectoderm.51
75
76
AIMS AND OBJECTIVES
Aim of the study:
To measure serum Fibroblast Growth Factor 19 in patients with Metabolic syndrome and to compare the serum level of FGF 19 with healthy individuals.
Objective of the study:
77
78
MATERIALS AND METHODS
The study was conducted at Thanjavur Medical College, Thanjavur, after being approved by the Ethical committee. Participants of the study group were selected from the Outpatient Department of Medicine.
The study included 50 patients with Metabolic syndrome (25 males, 25 females) and 50 age and sex matched healthy controls (25 males, 25 females), in the age group of 20-70 years. Informed consent was obtained from all the participants.
INCLUSION CRITERIA:
Patients with components of Metabolic syndrome were included in the study.
EXCLUSION CRITERIA:
History of Myocardial infarction Coronary bypass surgery
79 Alcohol abuse
Pregnant females.
The participants of the study were routinely measured for height and weight. BMI was calculated with the formula weight/height2 (kg/m2). All the participants were informed about the study and informed consents were obtained from them. Waist circumference was measured for each subject.
SAMPLE COLLECTION:
Venous blood samples were drawn from each subject, under aseptic precautions, after an overnight fast of 12 hours. The samples were allowed to clot for 30 minutes and were centrifuged