Int. J. Electrochem. Sci., 13 (2018) 4379 – 4389, doi: 10.20964/2018.05.43
International Journal of
ELECTROCHEMICAL
SCIENCE
www.electrochemsci.org
Sensitive Dopamine Sensor Based on Three Dimensional and
Macroporous Carbon Aerogel Microelectrode
Ailing Ding, Bin Wang*, Jiushang Zheng, Bo Weng, Changming Li*
Institute for Clean Energy & Advanced Materials, Faculty of Materials and Energy, Southwest University, Chongqing 400715, P.R. China
*
E-mail: [email protected], [email protected]
Received: 8 January 2018 / Accepted: 27 February 2018 / Published: 10 April 2018
A sensitive amperometric sensor is developed for selective determination of dopamine based on electrocatalytic activity of graphene-based macroporous carbon aerogel microelectrode. Three-dimensional carbon aerogel electrode was synthesized by freeze drying of graphene and multi-wall carbon nanotubes with the assistance of Nifion. The performance and morphology of carbon aerogel electrode were investigated using SEM, XPS, XRD, EDS and electrochemical characterization. The experimental results confirmed that the porous carbon aerogel displayed excellent electrical conductivity and strong electro-catalytic activity towards dopamine oxidation. DA sensor prepared with the carbon aerogels displays rapid and sensitive electrochemical response with a detection limit of 30 nM (S/N = 3). The results of DA determination in real samples verify the feasibility of the porous carbon aerogel and potential application in biosensing and medical diagnosis.
Keywords: Dopamine, carbon aerogel, detection, graphene, electrochemical sensor
1. INTRODUCTION
easy operation, noticeable stability, and excellent sensitivity and selectivity. A variety of carbon-based nanomaterials (including graphene, carbon nanotube, carbon fiber and porous carbon)[10-13] are used for the development of DA sensor, and good results and potential application were verified. These works demonstrate that carbon-based materials have broad development prospects in sensing and medical science.
Three-dimentional (3D) porous carbon materials in forms of foam, sponge and aerogels have been extensively studied and showed bright prospect in many fields including sensor, catalysts, energy storage, flexible electronics and environmental improvement (gas and oil adsorption) owing to their superior performances such as high porosity, light-weight, excellent mass-transfer capability and low dielectric permittivity[14-17]. Compared with other 3D carbon materials, carbon aerogels not only maintain unique structural merits of graphene sheets but also possess outstanding mechanical strength and electrical conductivity[17]. Since the first report in the 1931[18], a variety of methods such as chemical vapor deposition (CVD) [19], hydrothermal treatment[20], and thermal reduction[21] have been developed for the synthesis of 3D carbon aerogels. In our previous studies, the 3D carbon aerogel (CAG) was synthesized by freeze drying of the mixture of graphene, MWCNT and Nifion and hydrazine vapor reduction [22]. The obtained reduced CAG (rCAG) displays ultra-low density, high surface area, good electrical conductivity and mechanical properties, which make the carbon aerogels a promising candidate served as chemical biosensor.
In this work, we further improved the synthesis of rCAG and investigated its potential application in chemical sensing. CAG were reduced by using the vapour of hydriodic acid (HI) and applied for the development of DA sensor. The potential application of the sensor in real samples determination was further explored.
2. EXPERIMENTAL
2.1. Chemicals
Hydriodic acid (HI, 55 – 58 %), hydrazine monohydrate (> 98 %), multi-walled carbon nanotube (MWCNTs, > 95%, lateral dimension of 8 ∼ 15 nm) and dopamine hydrochloride (DA, 98 %) were purchased from aladdin. Nafion (5 %), PBS (PH = 7.4), ascorbic acid (AA) and uric acid (UA) were obtained from Sigma. Human serum was acquired from local hospital. All chemicals utilized in this work were used as received. GO dispersions were prepared using the modified Hummers’ method[23]
.
2.2. Preparation of 3D carbon aerogels
(GO and MWCNTs) to nafion were set at 3 : 1, 5 : 1 and 10 : 1. To prepare open porous carbon/nafion aerogel electrodes, the mixtures were firstly extruded into a thin syringe needle with an internal diameter of 1 mm, and then a thin Pt wire acted as electrode was inserted into the needle. After fast freezing in liquid nitrogen and subsequent freeze drying under -80 oC, CAG probe was obtained.
Scheme 1. Preparation of 3D CAG
2.3. HI Vapor Reduction
The 3D rCAG were prepared by HI vapor reduction in a sealed container at 100 °C for 1.5 h and vacuum drying at 80 °C for 24 h[24]. After the vapor reduction, the color of CAG was changed from brown to metallic gray, indicating that the materials were reduced.
2.4. Characterization of rCAG
The specific surface area of rCAG was measured using a Brunauer Emmett Teller apparatus (BET, Micromeritics, ASAP2020). Scanning electron microscopy (SEM) images were taken by JSM-6510LV, Japan. X-Ray diffraction (XRD) measurements were performed on a Shimadzu diffractometer (XRD-7000, Tokyo, Japan) operating in reflection mode with Cu Kα radiation at a step size of 0.06 per second. X-ray photoelectron spectroscopy (XPS) analysis was performed using a Thermo Scientific Escalab 250Xi (America).
2.5. Electrochemical characterization of the rCAG
electrodes were used as working electrodes with a platinum sheet served as counter electrode and Ag/AgCl (in 3 M KCl) acted as reference electrode. DA determination was carried out in 10 mL 0.1 M PBS solution (pH = 7.4) and human serum (10 % human serum in PBS). The electrode area was defined as Aelectrode = πD2/2 + πDL, where D is the diameter and L is the length of the rCAG electrode.
3. RESULTS AND DISCUSSION
3.1. Characterization of the CAG
Porous 3D CAG was synthesized according to our previous report, (the ratio of GO and MWCNTs is 2:1 containing 9 % Nafion)[22]. Then the obtained 3D CAG was reduced in a sealed container (containing 50 % HI solution) and heated at 100 ºC for different time, vacuum drying at 80 ºC for 24 hours[24]. The CAG and rCAG were characterized by using scanning electron microscopy (SEM). As shown in Fig.1, the SEM imaging of CAG displays honeycomb porous structure with size of 10 ~ 20 μm, which is attributed to the cross-linking of Nafion. The specific surface area of CAG was obtained using a BET apparatus (BET, Micromeritics, ASAP 2020) to be about 117.4 m2·g-1. When the CAG were reduced in HI vapour for 30 mins, the obtained rCAG still remains complete pore structure (Fig. 1C and 1D), and the conductivity of rCAG increased about 22 times. However, if the materials were reduced for one hour, the pore structure of rCAG was seriously destroyed (as shown in Fig. 1B). The results suggesting that the 3D carbon aerogels reduced in HI vapor have a large surface area and good conductivity.
10 µm
10 µm 3 µm
10 µm
A B
C D
Figure 1. SEM images of CAG (A) and rCAG reduced by HI vapour at 100 ºC for 1h (B) and 30 mins
[image:4.596.116.484.455.704.2]
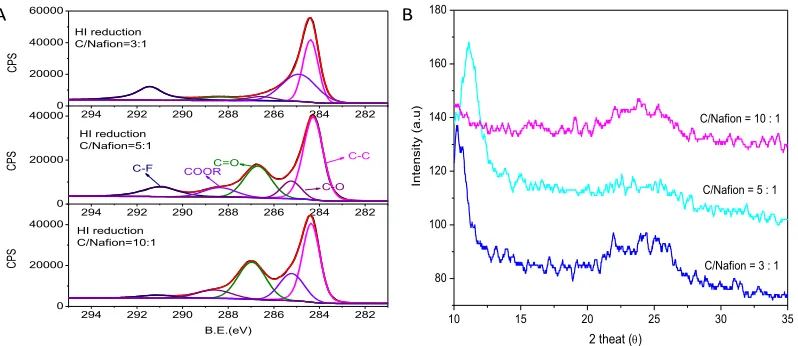
In addition, XPS and XRD were performed to further characterize the surface functional groups and elemental states of the present rCAG. Fig. 2A depicts the XPS spectra of the rCAG at different ratio of Nafion (including C/Nafion = 3 : 1, 5 : 1 and 10 : 1, which was labeled as rCAG3, rCAG5, and rCAG10, respectively). The C1s XPS spectra of the CAG exhibit five apparent peaks centered at 284.6, 285.4, 286.8, 288.5, and 291.2 eV corresponding to C-C, C-O, C=O, -COOR and C-F, respectively [22]. Comparison and analyses of the three C1 spectra, we can see that with the increase of the ratio of C/Nafion from 3 : 1 to 10 : 1, the peak of C-F decrease gradually attributed to the decrease of Nafion concentration. Meanwhile the peaks of C = O and -COOR increase accordingly due to the reduction by HI, which indicates that the rCAG10 isn’t reduced completely. From the XRD results in Fig. 2B, we can clearly observe the peak at 25° attributed to the existence of RGO, meanwhile the peak at 10.6° corresponding to GO disappeared after the reduction by HI. The phenomena further confirmed the results of XPS.
294 292 290 288 286 284 282
0 20000 40000 60000
294 292 290 288 286 284 282
0 20000 40000
294 292 290 288 286 284 282
0 20000 40000
CPS
HI reduction C/Nafion=3:1
HI reduction C/Nafion=5:1
C-C
CPS
C-O C=O
COOR
C-F
HI reduction C/Nafion=10:1
CPS
B.E.(eV) 10 15 20 25 30 35
80 100 120 140 160 180
C/Nafion = 10 : 1
C/Nafion = 5 : 1
Intensi
ty
(a.u)
2 theat ()
C/Nafion = 3 : 1
[image:5.596.100.499.306.479.2]A B
Figure 2. A: Typical C1s XPS spectra of rCAG at different ratio. B: XRD spectra of rCAG at different
ratio.
3.2. Electrochemical activity of rCAG towards DA
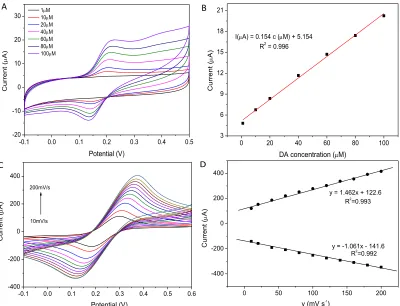
Cyclic voltammetry (CV) was performed to study the electrochemical activity of the rCAG towards DA. As shown in Fig.3, there is no obvious redox peak is observed on the rCAG, which indicates that it is electrochemically inactive in the potential range. In the presence of DA, a remarkable redox peaks were appeared at 0.18 V (vs. Ag/AgCl), suggesting that rCAG has significant electrocatalytic activity towards DA oxidation. With increase of DA concentration, the currents intensity of oxidation peak increases gradually and shows a linear relationship (Ipa= 0.154c+ 5.154, R2
= 0.996, where Ipa refers to the peak current of CV curves, CDA refers to the concentration of DA). The
of scan rates, suggesting the surface-controlled electron transfer process on the surface of rCAG electrode.
-0.1 0.0 0.1 0.2 0.3 0.4 0.5
-20 -10 0 10 20 30 C u rr e n t ( A) Potential (V)
1M 10M 20M 40M 60M 80M 100M
0 20 40 60 80 100
3 6 9 12 15 18 21 C u rr e n t ( A)
DA concentration (M) I(A) = 0.154 c (M) + 5.154 R2 = 0.996
A B
-0.1 0.0 0.1 0.2 0.3 0.4 0.5 0.6 -400 -200 0 200 400 Potential (V) C u rr e n t ( A) 200mV/s 10mV/s
0 50 100 150 200
-400 -200 0 200 400
R2=0.993
y = 1.462x + 122.6
R2=0.992
C u rr e n t ( A)
v (mV s-1
)
y = -1.061x - 141.6
AC DB
-0.1 0.0 0.1 0.2 0.3 0.4 0.5 0.6 -400 -200 0 200 400 Potential (V) C u rr e n t ( A) 200mV/s 10mV/s
0 50 100 150 200
-400 -200 0 200 400
R2=0.993
y = 1.462x + 122.6
R2 =0.992 C u rr e n t ( A)
v (mV s-1
)
y = -1.061x - 141.6
[image:6.596.100.500.135.441.2]AC DB
Figure 3. Cyclic voltammograms (CVs) obtained at different dopamine (DA) concentration in 0.01 M
PBS (pH=7.4), potential scan rate: 5 mV/s. B: Calibration plots of oxidation peak current to DA concentration. C: CVs of rCAG in 1mM K3[Fe(CN)6] solution (containing0.1M KCl) at
different scan rate. D: Plot of the peaks current of rCAG (anodic peak, and cathodic peak) vs. scan rate.
3.3. Effect of the ratio of C/Nafion on DA determination
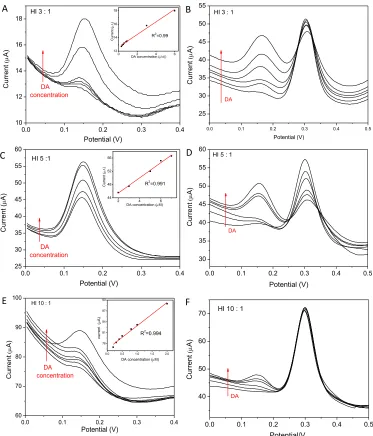
Fig. 5A, 5C and 5E show the DPV curve of rCAG at different ration of C/Nafion in the presence of different concentration of DA. For all the electrodes, the current response towards DA increase gradually upon the increase of DA concentration, and linear relationship between current intensity and DA concentratioin was obtained. Their linear relationship is represented as follows:
rCAG3: Ipa = 0.93CDA + 12.6, R2 = 0.990;
rCAG5: Ipa = 2.29CDA + 40.85, R2 = 0.991;
and rCAG10: Ipa = 6.42CDA + 76.49, R2 = 0.994.
higher than the results at graphene aerogels electrode made from porous Ni template (619.6 μA·mM -1
·cm-2) [19].
UA and AA are the most common interferents, which are usually coexisted with DA in biological system and have adjacent redox potentials. Herein, UA and AA were used to compare the catalytic performance of these materials towards DA determination. Fig. 5B, 5D, and 5F display the results of DA response at different electrods in the presence of 200 μM AA and 200 μM UA, which indicate that the presence of AA and UA causes great effect on rCAG3 and rCAG5 electrodes but the effect on rCAG10 is negligible. Hence the rCAG10 electrode is adsorpted for the detection of DA in the following experiment.
0.0 0.1 0.2 0.3 0.4
10 12 14 16 18 C u rr e n t A) Potential (V)
HI 3 : 1
DA concentration
0 2 4 6
12 14 16 18 Cu rren t ( )
DA concentration ())
R2=0.99
0.0 0.1 0.2 0.3 0.4
25 30 35 40 45 50 55 60 DA concentration C u rr e n t ( A) Potential (V)
HI 5 :1
2 4 6
44 48 52 56 Cu rren t ( )
DA concentration (M)
R2=0.991
0.0 0.1 0.2 0.3 0.4 0.5
25 30 35 40 45 50 55 DA C ur re nt A) Potential (V)
HI 3 : 1
A B
C D
0.0 0.1 0.2 0.3 0.4 0.5
30 35 40 45 50 55 60 DA C ur re nt A) Potential (V)
HI 5 : 1
0.0 0.1 0.2 0.3 0.4 0.5
40 50 60 70 C u rr e n t A) Potential/V HI 10 : 1
DA
F
0.0 0.1 0.2 0.3 0.4
60 70 80 90 100 C u rr e n t A) Potential (V)
HI 10 : 1
DA concentration
0.0 0.5 1.0 1.5 2.0
78 81 84 87 90 curre nt ( A)
DA concentration (M)
R2=0.994
[image:7.596.111.484.243.679.2]E
Figure 4. A, B and E: DPV of rCAG3 (A), rCAG5 (B) and rCAG10 (E) under different concentration
0 300 600 900 1200 1500 1800
0 2 4 6 8 10
C
u
rr
e
n
t
Time (S)
0.4M 1 2 3
4 5 6
7 8
9 10 15
20 25
30 35
40
0 60 120 180 240
0 3 6 9
DA concentration (M)
C
urre
nt
[image:8.596.140.459.78.309.2]R2 = 0.993
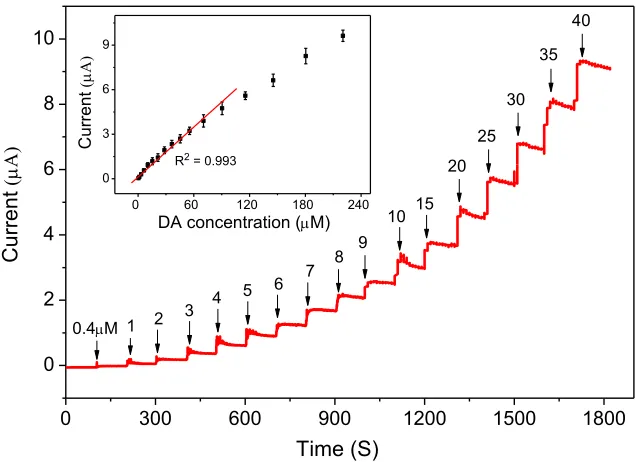
Figure 5. Amprometry of DA (0.4-220 μM) with 200 μM AA and UA mixture, inset: calibration plots
[image:8.596.81.516.400.561.2]of peak current to the concentration of DA. The applied potential is 0.15 V.
Table 1. Comparison of the proposed method with other reported electrochemical DA sensors. Modified electrode Linearity
(μmol·L-1
)
Detection limit (μmol·L-1
)
Ref. MIPs (OPDd)/Au
electrode
3.2 ~ 46 0.7 25
MIPs/MWNTs/GCE 0.63 ~ 100 0.06 26
Nafion/graphene/Fc-NH2
0.5 ~ 200 0.02 27
rGO/TiO2 2 ~ 60 6 28
MWCNT/GONR 0.5 ~ 50 0.77 29
MBIP 0.02 ~ 7 0.006 30
carbon aerogel
0.2 ~ 90 0.03 This work3.4. Detection of DA
3). Compared with the other DA sensors, the proposed method displays lower detection limit than most of the reported methods (as shown in Table 1).
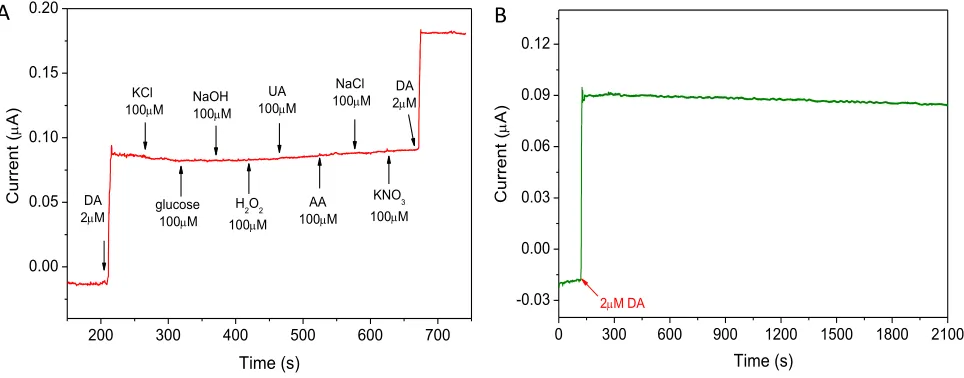
Then the anti-interference ability of the proposed DA sensor was explored to evaluate its application in complex system. As shown in Fig. 6A, compared with the current response of 2 µM DA, the response currents of 100 µM KCl, KNO3, glucose, NaOH, H2O2, ascorbic acid (AA), and uric acid
(UA) at the rCAG electrode are negligible. This results suggest that these species don’t interfere the oxidation of DA on the proposed sensor. In addition, the stability of the sensor towards DA was studied. As shown in Fig. 6B, the addition of DA cause sensitive current response, and current response decreases only 4.5 % of original value after continuous scanning for 2000 seconds, suggesting that the sensor has sufficient stability for DA determination.
200 300 400 500 600 700
0.00 0.05 0.10 0.15 0.20
DA 2M
C
u
rr
e
n
t
(
A)
Time (s) DA
2M KCl 100M
glucose 100M
NaOH 100M
H2O2 100M
KNO3 100M NaCl 100M
AA 100M UA 100M
0 300 600 900 1200 1500 1800 2100
-0.03 0.00 0.03 0.06 0.09 0.12
Time (s)
C
u
rr
e
n
t
(
A)
2M DA
[image:9.596.63.545.274.463.2]A B
Figure 6. A: The current responses of the rCAG electrode for DA and other interfering species. B: the
stability of the rCAG electrode in the presence of 2 μM DA.
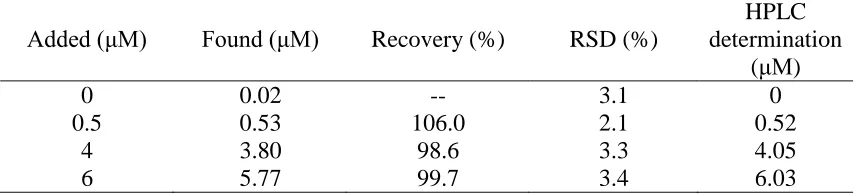
3.5. The detection of DA in serum samples
Table 2. DA determination in human serum.
Added (μM) Found (μM) Recovery (%) RSD (%)
HPLC determination
(μM)
0 0.02 -- 3.1 0
0.5 0.53 106.0 2.1 0.52
4 3.80 98.6 3.3 4.05
6 5.77 99.7 3.4 6.03
4. CONCLUSIONS
Porous three-dimensional carbon aerogel materials were synthesized by freeze drying of graphene, MWCNTs and Nafion. The rCAG was prepared by HI vapor reduction. The results of SEM, XPS, XRD and electrochemical response confirmed the porous structure, large surface area and excellent electrocatalytic activity towards DA oxidation. The DA sensor fabricated with the carbon aerogels electrode displayed fast response time, good repeatability, high sensitivity and selectivity, which makes it suitable for the determination of DA in the presence of higher concentration of AA and UA. Furthermore, the results of DA assay in human serum samples verified the feasibility and potential application of the rCAG sensor. This work revealed that this 3D microelectrode can be widely used in biosensing and clinic diagnostics.
ACKNOWLEDGEMENTS
This work is financially supported by National Natural Science Fundation of China (21505108) and Technological and Developmental Grant (2015-09) from Beibei District Commission. The authors would also like to acknowledge the financial support of the Fundamental Research Funds (XDJK2016C132) for the Central Universities.
References
1. R.M. Wightman, L.J. May, A.C. Michael, Anal. Chem. 60 (1988) 769A.
2. C. Xue, Q. Han, Y. Wang, J. Wu, T. Wen, R., Wang, J. Hong, X. Zhou, H. Jiang, Biosens Bioelectron, 49 (2013) 199.
3. P Damier, EC Hirsch, Y Agid, AM Graybiel, Brain, 122 (1999) 1437.
4. Davis, Kenneth L.; Kahn, René S.; Ko, Grant; Davidson, Michael, Am J Psychiatry, 148 (1991) 1474-1486
5. E. C. Y. Chan , P. Y. Wee , P. Y. Ho , P. C. Ho , J. Chromatogr. B, 749 (2000) 179
6. M.E.P. Hows, L. Lacroix, C. Heidbreder, A.J. Organ, A.J. Shah, J. Neurosci. Meth. 138 (2004) 123.
7. MRH. Nezhad, J. Tashkhourian, J. Khodaveisi, J Iran Chem Soc, 7 (2010) 83. 8. H. M. Zhang , N. Q. Liu , Z. Zhu , Microchem. J., 64 (2000) 277.
9. C. H. Lin , C. Y. Hsiao , C. H. Hung , Y. R. Lo , C. C. Lee , C. J. Su , H. C. Lin , F. H. Ko , T. Y. Huang , Y. S. Yang , Chem. Commun. (2008) 5749
11.W. Al-Graiti, Z. Yue, J. Foroughi, X. Huang, G. Wallace, R. Baughman and J. Chen, Sensors, 17 (2017) 884.
12.J. Fang, Z. Xie, G. Wallace, X. Wang, App. Surf. Sci., 412 (2017) 131.
13.P. Veerakumar, R. Madhu, S.M. Chen, C.T. Hung, P.H. Tang, C.B. Wang and S.B. Liu, Analyst, 139 (2014) 4994.
14.Y. Zhao, J. Liu, Y. Hu, H. H. Cheng, C. G. Hu, C. C. Jiang, L. Jiang, A. Y. Cao and L. T. Qu, Adv. Mater., 25 (2013) 591.
15.C. F. Wang and S. J. Lin, ACS Appl. Mater. Interfaces, 5 (2013) 8861 16.Y. Q. Qian, I. M. Ismail and A. Stein, Carbon, 68 (2014) 221.
17.Z. Y. Sui, Y. N. Meng, P. W. Xiao,Z. Q. Zhao, Z. X. Wei and B. H. Han, ACS Appl. Mater Interfaces, 7 (2015) 1431
18.S. S. Kistler, Nature, 127 (1931) 741.
19.X. Dong, X. Wang, L. Wang, H. Song, H. Zhang, W. Huang, P. Chen, ACS Appl. Mater. Inter. 4 (2012) 3129.
20.C. C. Ji, M.-W. W. Xu, S.-J. J. Bao, C.-J. J. Cai, Z.-J. J. Lu, H. Chai, F. Yang, H. Wei, J. Colloid. Interf. Sci. 407 (2013) 416
21.H. Hu, Z. B. Zhao, W. B. Wan, Y. Gogotsi and J. S. Qiu, Adv. Mater., 25 (2013) 2219.
22.B. Weng, A. Ding, Y. Liu, J. Diao, J. Razal, K. T. Lau, R. Shepherd, C. Li and J. Chen, Nanoscale, 8 (2016) 3416.
23.D. C. Marcano, D. V. Kosynkin, J. M. Berlin, A. Sinitskii, Z. Sun, A. Slesarev, L. B. Alemany, W. Lu, J. M. Tour, ACS nano, 4 (2010) 4806.
24.S. Pei, J. Zhao, J. Du, W. Ren, H.M. Cheng, Carbon, 48 (2010) 4466.