Rochester Institute of Technology
RIT Scholar Works
Theses Thesis/Dissertation Collections
8-1-2009
The Effect of training, aim pattern and target type
on the ergonomics and efficiency of handheld
scanners
Nicolette M. McGeorge
Follow this and additional works at:http://scholarworks.rit.edu/theses
This Thesis is brought to you for free and open access by the Thesis/Dissertation Collections at RIT Scholar Works. It has been accepted for inclusion in Theses by an authorized administrator of RIT Scholar Works. For more information, please [email protected].
Recommended Citation
ROCHESTER INSTITUTE OF TECHNOLOGY
The Effect of Training, Aim Pattern and Target Type on the Ergonomics and
Efficiency of Handheld Scanners
A Thesis Submitted in Partial Fulfillment of the Requirements for the Degree of
Master of Science in Industrial Engineering
Department of Industrial & Systems Engineering
Kate Gleason College of Engineering
By Nicolette M. McGeorge
ii
DEPARTMENT OF INDUSTRIAL AND SYSTEMS ENGINEERING KATE GLEASON COLLEGE OF ENGINEERING
ROCHESTER INSTITUTE OF TECHNOLOGY ROCHESTER, NEW YORK
CERTIFICATE OF APPROVAL
M.S. DEGREE THESIS
The M.S. Degree Thesis of Nicolette M. McGeorge has been examined and approved by the thesis committee as
satisfactory for the thesis requirement for the Master of Science Degree
Approved by:
____________________________________ Dr. Matthew Marshall, Thesis Advisor
____________________________________
iii
The Effect of Training, Aim Pattern and Target Type on the Ergonomics and
Efficiency of Handheld Scanners
By Nicolette M. McGeorge
I, Nicolette M McGeorge, hereby grant permission to the Wallace Memorial Library of the Rochester Institute of Technology to reproduce this document in whole or in part such that any reproduction will not be for commercial use or profit.
Signature
iv
Acknowledgement
v
Abstract
Handheld scanning is a prevalent industrial task that is prone to injury due to the repetitive motion of the task. Studies conducted with Rochester Institute of Technology and Honeywell have sought to discover the ergonomic and efficiency benefits of various scanning technologies and methods. One factor not fully investigated in these earlier works is the effect of training on the proper use of scanners. This thesis study compares trained and untrained user performance and ergonomics during a series of scanning tasks using a hand held omni-directional scanner. Comparison is based on such variables as target type (image that is scanned), aiming pattern (image projected from scanner) and time stress (self-paced versus time stress paced). Through this study is the potential to assess the value of training on efficiency and ergonomics during hand held scanner use.
vi
Table of Contents
Title Page ... i
Acknowledgement ... iii
Abstract... iv
Table of Contents ... v
List of Tables ... viii
List of Figures ... ix
1 Introduction ... 1
2 Literature Review ... 3
2.1 Scanning ... 3
2.2 Cumulative Trauma Disorders ... 7
2.3 Training ... 11
2.4 Conclusion ... 16
3 Methodology ... 18
3.1 Experimental Objective ... 18
3.1.1 Hypotheses ... 18
3.2 Experimental Overview ... 19
3.3 Subjects ... 20
3.4 Independent Variables ... 20
3.4.1 Group (Training Level) ... 20
3.4.2 Subject ... 21
3.4.3 AimingPattern ... 21
3.4.4 TargetType ... 22
3.4.5Day ... 23
3.4.6Task ... 23
3.5 Dependent Variables ... 23
3.5.1 Forearm Pronation/Supination Deviation ... 23
3.5.2 Wrist Flexion/Extension Deviation ... 23
3.5.3 Wrist Radial/Ulnar Deviation ... 24
3.5.4 Scan Time ... 24
3.5.5 Subjective Aiming Pattern Rating for Perceived Comfort ... 25
3.5.6 Subjective Aiming Pattern Rating for Perceived Usability ... 25
3.5.7 Subjective Aiming Pattern Rank ... 26
3.6 Experimental Procedure ... 26
3.6.1 Overview ... 26
3.6.2 Informed Consent ... 27
3.6.3 Instrumentation ... 27
vii
3.6.5 Self-Paced Task ... 31
3.6.6 Time Stress-Paced Task ... 33
3.6.7 Subjective Rating and Rank ... 33
3.7 Data Analysis ... 34
4 Results ... 35
4.1 Self-Paced Task ... 35
4.1.1 Ergonomics ... 37
4.1.1.1 Radial Deviation ... 37
4.1.1.2 Supination ... 38
4.1.1.2.1 Group*Day*Target Type ... 38
4.1.1.2.2 Group*Target Type (Target Type Main Effect) ... 40
4.1.1.2.3 Aim Pattern*Target Type ... 42
4.1.1.3 Pronation... 45
4.1.1.3.1 Group*Day*Aim Pattern ... 45
4.1.1.3.2 Group*Aim Pattern (Aim Pattern Main Effect) ... 49
4.1.1.3.3 Day*Target Type ... 50
4.1.1.3.4 Group*Target Type (Target Type Main Effect) ... 54
4.1.1.4 Flexion ... 55
4.1.1.4.1 Group*Target Type*Aim Pattern ... 55
4.1.1.4.2 Target Type*Day ... 60
4.1.1.4.3 Group*Target Type (Target Type Main Effect) ... 63
4.1.1.4.4 Group*Aim Pattern (Aim Pattern Main Effect) ... 64
4.1.1.4.5 Group*Day (Day Main Effect) ... 66
4.1.1.5 Extension ... 68
4.1.1.5.1 Group*Day*Target Type ... 68
4.1.1.5.2 Group*Target Type (Target Type Main Effect) ... 71
4.1.1.5.3 Group*Aim Pattern (Aim Pattern Main Effect) ... 72
4.1.1.6 Ulnar Deviation ... 73
4.1.1.6.1 Group*Target Type (Target Type Main Effect) ... 73
4.1.1.6.2 Group*Day (Day Main Effect) ... 75
4.1.2 Efficiency: Scan Time... 76
4.1.2.1 Group*Aim Pattern*Target Type ... 76
4.1.2.2 Day*Target Type ... 80
4.1.2.3 Group*Target Type (Target Type Main Effect) ... 83
4.1.2.4 Group*Day (Day Main Effect) ... 85
4.1.3 Group Main Effect ... 86
4.1.4 Subjective Ratings and Rank ... 88
4.1.4.1 Subjective Aim Pattern Rating of Perceived Comfort ... 88
4.1.4.1.1 Group*Aim Pattern (Aim Pattern Main Effect) ... 88
4.1.4.1.2 Group*Day (Day Main Effect) ... 90
4.1.4.2 Subjective Aim Pattern Rating of Perceived Usability... 91
4.1.4.2.1 Group*Aim Pattern (Aim Pattern Main Effect) ... 91
4.1.4.2.2 Group*Day (Day Main Effect) ... 93
viii
4.2 Time Stress-Paced Task ... 96
4.2.1 Ergonomics ... 99
4.2.1.1 Supination ... 99
4.2.1.1.1 Task*Day*Aim Pattern ... 99
4.2.1.1.2 Task*Group (Task Main Effect) ... 101
4.2.1.2 Pronation... 102
4.2.1.2.1 Task*Group*Day ... 102
4.2.1.3 Flexion ... 105
4.2.1.4 Extension ... 106
4.2.1.4.1 Task*Group ... 106
4.2.1.5 Ulnar Deviation ... 107
4.2.1.5.1 Task*Group ... 107
4.2.2 Efficiency: Scan Time... 108
4.2.2.1 Task*Group ... 108
4.2.3 Group Main Effect ... 110
4.2.4 Subjective Ratings and Rank ... 112
4.2.4.1 Subjective Aim Pattern Rating for Perceived Comfort ... 113
4.2.4.2 Subjective Aim Pattern Rating for Perceived Usability ... 113
4.2.4.3 Subjective Aim Pattern Rank ... 114
5 Discussion ... 116
5.1 Training Effect on Ergonomics ... 116
5.2 Training Effect on Efficiency ... 118
5.3 Learning Effect on Ergonomics and Efficiency ... 119
5.4 Training Effect on Aim Pattern Preference ... 120
5.5 Time Stress Effect on Ergonomics and Efficiency ... 122
5.6 Limitations ... 123
5.7 Future Work ... 124
6 Conclusion ... 125
References ... 127
Appendix A ... 130
Appendix B... 131
Appendix C ... 132
Appendix D ... 133
Appendix E ... 135
Appendix F ... 137
Appendix G ... 139
Appendix H ... 141
Appendix I ... 143
Appendix J ... 145
ix
List of Tables
Table 3.1: Experiment Schedule ………..……… 19
Table 4.1.1: Self-Paced Task Ergonomics and Efficiency ANOVA Results 1 ……… 36
Table 4.1.2: Self-Paced Task Ergonomics and Efficiency ANOVA Results 2 ……… 36
Table 4.1.3: Self-Paced Task Ergonomics and Efficiency ANOVA – Group Main Effect ………. 87
Table 4.1.4: Self-Paced Task Subjective Ratings ANOVA Results ……….. 88
Table 4.1.5: Self-Paced Task Aim Pattern Frequency of Rank Summary ………. 88
Table 4.2.1: Time Stress-Paced Task Ergonomics and Efficiency ANOVA Results 1 ………. 97
Table 4.2.2: Time Stress-Paced Task Ergonomics and Efficiency ANOVA Results 2 ………. 98
Table 4.2.3: Time Stress-Paced Task Ergonomics and Efficiency ANOVA – Group Main Effect………. 111
Table 4.2.4: Time Stress-Paced Task Subjective Ratings ANOVA Results ………. 112
x
List of Figures
Figure 3.1: Representation of Scanner Aim Patterns ………..……….………..…....….. 22
Figure 3.2: Example of Hand Held Scanner ……….……….…….. 22
Figure 3.3: Target Types …..……….………..………..……….………..……….…… 22
Figure 3.4: Angle Definitions for the Wrist and Forearm …….……….…….……….. 24
Figure 3.5: Goniometric Attachment for two-axis sensor ………..………….……..………… 28
Figure 3.6: Goniometric Attachment for two-axis and single-axis sensors …..………….……….….… 28
Figure 3.7: Example Scan Board ………..……….……….……… 29
Figure 3.8: Caution Label ………..……….. 30
Figure 3.9: Experiment Set-up (Self-Paced Task & Time Stress-Paced Task) ………..…. 31
Figure 3.10: DataLINK Graphical Output ……… 32
Figure 4.1.1: Wrist/Forearm Postures Obtained during Scanning: Trained Group ……….…… 37
Figure 4.1.2: Wrist/Forearm Postures Obtained during Scanning: Untrained Group ……….……….. 37
Figure 4.1.3: Ulnar & Radial Deviation by Target Type ………...………… 37
Figure 4.1.4: Supination: Target Type versus Day – Trained Group, Interaction Plot …….………….………. 38
Figure 4.1.5: Supination: Target Type versus Day – Untrained Group, Interaction Plot ………....………… 38
Figure 4.1.6: Supination: Linear Target Type – Trained Group ………...……….………… 39
Figure 4.1.7: Supination: Linear Target Type – Untrained Group ……….…………..…….……….. 39
Figure 4.1.8: Supination: Data Matrix Target Type – Trained Group ………..………. 39
Figure 4.1.9: Supination: Data Matrix Target Type – Untrained Group ……….………. 39
Figure 4.1.10: Supination: PDF Target Type – Trained Group ………..…………. 40
xi
Figure 4.1.12: Supination: Target Type Main Effect by Group – Interaction Plot ………..……..….…. 41
Figure 4.1.13: Supination: Target Type Main Effect by Group ……….………. 42
Figure 4.1.14: Supination: Target Type versus Aim Pattern – Interaction Plot ……….. 42
Figure 4.1.15: Supination: Linear Target Type versus Aim Pattern ………..………. 43
Figure 4.1.16: Supination: Data Matrix Target Type versus Aim Pattern ……….………. 44
Figure 4.1.17: Supination: PDF Target Type versus Aim Pattern ……….… 45
Figure 4.1.18: Pronation: Aim Pattern versus Day – Trained Group, Interaction Plot ……….…….… 46
Figure 4.1.19: Pronation: Aim Pattern versus Day – Untrained Group, Interaction Plot ………. 46
Figure 4.1.20: Pronation: LED Aim Pattern – Trained Group ……….………. 47
Figure 4.1.21: Pronation: LED Aim Pattern – Untrained Group ……….……..…………..…….……… 47
Figure 4.1.22: Pronation: Bracket Aim Pattern – Trained Group ……….…..….……… 47
Figure 4.1.23: Pronation: Bracket Aim Pattern – Untrained Group ………...…..………..….…… 47
Figure 4.1.24: Pronation: Grid Aim Pattern – Trained Group ……….………...………… 48
Figure 4.1.25: Pronation: Grid Aim Pattern – Untrained Group ……….………. 48
Figure4.1.26: Pronation: Crosshair Aim Pattern – Trained Group ……….………. 48
Figure 4.1.27: Pronation: Crosshair Aim Pattern – Untrained Group ……….…….. 48
Figure 4.1.28: Pronation: Bulls-eye Aim Pattern – Trained Group ……….….…... 49
Figure 4.1.29: Pronation: Bulls-eye Aim Pattern – Untrained Group ……… 49
Figure 4.1.30: Pronation: Aim Pattern Main Effect by Group – Interaction Plot ……….. 49
Figure 4.1.31: Pronation: Aim Pattern Main Effect by Group ………. 50
Figure 4.1.32: Pronation: Target Type versus Day – Interaction Plot ……… 51
xii
Figure 4.1.34: Pronation: Data Matrix Target Type versus Day ………. 53
Figure 4.1.35: Pronation: PDF Target Type versus Day ……… 54
Figure 4.1.36: Pronation: Target Type Main Effect by Group, Interaction Plot ………. 54
Figure 4.1.37: Pronation: Target Type Main Effect by Group ………. 55
Figure 4.1.38: Flexion: Target Type versus Aim Pattern – Trained Group, Interaction Plot ……….. 56
Figure 4.1.39: Flexion: Target Type versus Aim Pattern – Untrained Group, Interaction Plot ……… 56
Figure 4.1.40: Flexion: Linear Target Type versus Aim Pattern ………. 57
Figure 4.1.41: Flexion: Data Matrix Target Type versus Aim Pattern ……… 58
Figure 4.1.42: Flexion: PDF Target Type versus Aim Pattern ……….. 59
Figure 4.1.43: Flexion: Target Type versus Day, Interaction Plot ………. 60
Figure 4.1.44: Flexion: Linear Target Type versus Day ……… 61
Figure 4.1.45: Flexion: Data Matrix Target Type versus Day ……….. 62
Figure 4.1.46: Flexion: PDF Target Type versus Day ………. 62
Figure 4.1.47: Flexion: Target Type Main Effect by Group, Interaction Plot ……… 63
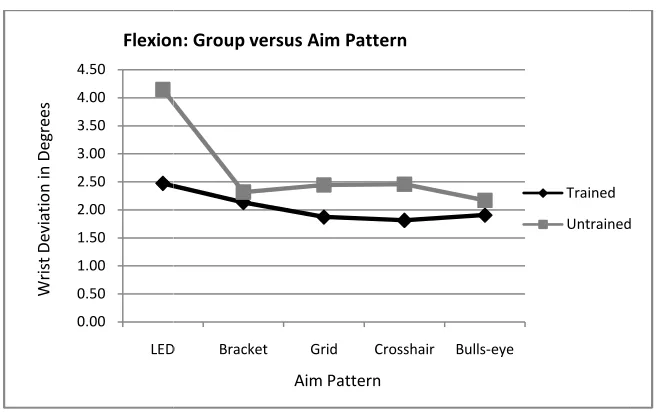
Figure 4.1.48: Flexion: Target Type Main Effect by Group ……… 64
Figure 4.1.49: Flexion: Aim Pattern Main Effect by Group, Interaction Plot ……… 65
Figure 4.1.50: Flexion: Aim Pattern Main Effect by Group ……….. 66
Figure 4.1.51: Flexion: Day Main Effect by Group, Interaction Plot ……….. 66
Figure 4.1.52: Flexion: Trained Group versus Day ……….. 67
Figure 4.1.53: Flexion: Untrained Group versus Day ……… 67
Figure 4.1.54: Extension: Target Type versus Day – Trained Group, Interaction Plot ……… 68
xiii
Figure 4.1.56: Extension: Linear Target Type versus Day – Trained Group ……….. 69
Figure 4.1.57: Extension: Linear Target Type versus Day – Untrained Group ………. 69
Figure 4.1.58: Extension: Data Matrix Target Type versus Day – Trained Group ………. 70
Figure 4.1.59: Extension: Data Matrix Target Type versus Day –Untrained Group ………. 70
Figure 4.1.60: Extension: PDF Target Type versus Day – Trained Group ……… 70
Figure 4.1.61: Extension: PDF Target Type versus Day – Untrained Group ……….. 70
Figure 4.1.62: Extension: Target Type Main Effect by Group, Interaction Plot ……….. 71
Figure 4.1.63: Extension: Target Type Main Effect by Group ………. 72
Figure 4.1.64: Extension: Aim Pattern Main Effect by Group, Interaction Plot ………. 72
Figure 4.1.65: Extension: Aim Pattern Main Effect by Group ………. 73
Figure 4.1.66: Ulnar Deviation: Target Type Main Effect by Group, Interaction Plot ……… 74
Figure 4.1.67: Ulnar Deviation: Target Type Main Effect by Group ……… 75
Figure 4.1.68: Ulnar Deviation: Day Main Effect by Group, Interaction Plot ……… 75
Figure 4.1.69: Ulnar Deviation: Day Main Effect by Group – Trained Group ……….. 76
Figure 4.1.70: Ulnar Deviation: Day Main Effect by Group – Untrained Group ………. 76
Figure 4.1.71: Scan Time: Target Type versus Aim Pattern – Trained Group, Interaction Plot ………….. 77
Figure 4.1.72: Scan Time: Target Type versus Aim Pattern – Untrained Group, Interaction Plot ………. 77
Figure 4.1.73: Scan Time: Linear Target Type versus Aim Pattern ……….. 78
Figure 4.1.74: Scan Time: Data Matrix Target Type versus Aim Pattern ………. 79
Figure 4.1.75: Scan Time: PDF Target Type versus Aim Pattern ……… 80
Figure 4.1.76: Scan Time: Target Type versus Day, Interaction Plot ……… 81
xiv
Figure 4.1.78: Scan Time: Data Matrix Target Type versus Day ……… 82
Figure 4.1.79: Scan Time: PDF Target Type versus Day ……….. 83
Figure 4.1.80: Scan Time: Target Type Main Effect by Group, Interaction Plot ………. 84
Figure 4.1.81: Scan Time: Target Type Main Effect by Group ……… 85
Figure 4.1.82: Scan Time: Day Main Effect by Group, Interaction Plot ……… 85
Figure 4.1.83: Scan Time: Day Main Effect – Trained Group ……….. 86
Figure 4.1.84: Scan Time: Day Main Effect – Untrained Group ………. 86
Figure 4.1.85: Pronation: Group Main Effect ………. 87
Figure 4.1.86: Comfort: Aim Pattern Main Effect by Group, Interaction Plot ………. 89
Figure 4.1.87: Comfort: Aim Pattern Main Effect by Group ……… 90
Figure 4.1.88: Comfort: Day Main Effect by Group, Interaction Plot ……… 90
Figure 4.1.89: Comfort: Day Main Effect by Group ……… 91
Figure 4.1.90: Usability: Aim Pattern Main Effect by Group, Interaction Plot ……… 92
Figure 4.1.91: Usability: Aim Pattern Main Effect by Group ……… 93
Figure 4.1.92: Usability: Day Main Effect by Group, Interaction Plot ……… 93
Figure 4.1.93: Usability: Day Main Effect by Group ……….. 94
Figure 4.1.94: Median Aim Pattern Rank – Self-Paced Task ……… 95
Figure 4.2.1: Supination: Task versus Aim Pattern – Day 5, Interaction Plot ……….. 99
Figure 4.2.2: Supination: Task versus Aim Pattern – Day 10, Interaction Plot ……… 99
Figure 4.2.3: Supination: Task versus Aim Pattern – Day 5 ………..……… 100
Figure 4.2.4: Supination: Task versus Aim Pattern – Day 10, Interaction Plot ……… 101
xv
Figure 4.2.6: Supination: Task Main Effect by Group ……… 102
Figure 4.2.7: Pronation: Group versus Task – Day 5, Interaction Plot ……….. 103
Figure 4.2.8: Pronation: Group versus Task – Day 10, Interaction Plot ……… 103
Figure 4.2.9: Pronation: Group versus Task – Day 5 ………. 104
Figure 4.2.10: Pronation: Group versus Task – Day 10 ……… 105
Figure 4.2.11: Flexion: Group versus Task ……… 105
Figure 4.2.12: Extension: Task Main Effect by Group, Interaction Plot ……….. 106
Figure 4.2.13: Extension: Task Main Effect by Group ……….. 107
Figure 4.2.14: Ulnar Deviation: Task Main Effect by Group, Interaction Plot ………. 107
Figure 4.2.15: Ulnar Deviation: Task Main Effect by Group ………. 108
Figure 4.2.16: Scan Time: Task Main Effect by Group, Interaction Plot ……….. 109
Figure 4.2.17: Scan Time: Task Main Effect by Group ………. 110
Figure 4.2.18: Pronation: Group versus Task ………. 112
Figure 4.2.19: Comfort: Aim Pattern Main Effect by Group ……… 113
Figure 4.2.20: Usability: Aim Pattern Main Effect by Group ……… 114
1
Section 1
Introduction
Barcode scanner use has increased significantly in recent years, becoming an important tool in a wide variety of industries. Examples of industries that have become heavily reliant on this technology are retail and manufacturing, in the form of grocery check-out scanners, hand-held scanners and Portable Data Terminals (PDTs). These industries have also faced high incidents of work-related musculoskeletal disorders, particularly affecting the upper extremities. Heavy use of hand held scanners is an example of the repetitive motions which often result in this increase in incidents of injury to the wrist. With such a reliance on scanners in industry and the high incidence rates for this type of injury, it is important to realize the possibility for improvement to not only device design, but also to how the user uses the device. Despite the presence of design features that minimize ergonomic risk and increase efficiency, such as the pistol grip shape and omni-directionality, the benefits of these features may not be fully utilized without proper training. It is necessary to determine the value of training in terms of ergonomics and efficiency in order to benefit from this design and help decrease injury.
2
This thesis builds on the results of these previous studies with the additional consideration of training.
3
Section 2
Literature Review
2.1 Scanning
There are two main types of scanners used in industry today. The first is the in-counter barcode scanner typically found in grocery stores, where an item is moved across the scan window and the imager reads the barcode. Of this design, there is a single window model, with the imaging window usually embedded horizontally into a counter, and a two-window bi-optic scanner, in which there is a vertical as well as horizontal window. The major wrist motions required for this scanning task are dynamic in nature; the wrist and forearm are in constant motion.
4
for the scanner to read the code (Marshall & Mozrall, 2007). Because wrist motions are minimized, repetitive motion is reduced, which results in improved ergonomics.
For more than two decades, considerable awareness of and concern for work-related repetitive motion injuries has been present, especially in industries with higher incidence rates of such injuries. According to the Bureau of Labor Statistics (2006) in 2006, of all injury and illness in the manufacturing industry, 32.9% was to the upper extremities with injury to the finger, hand and wrist accounting for 15.1%, 5.3% and 5.7%, respectively of those injuries. Additionally, of all injury and illness in the retail trade industry, 21.8% was to the upper extremities with injury to the finger, hand and wrist accounting for 8.4%, 4.1% and 4.1%, respectively of those injuries. One such occupation in the retail industry, cashiering, has shown high incidence rates for wrist injury. Grocery check-out scanning, a light and repetitive motion manual material handling (MMH) task, involves moving items with low force exertion repeatedly for an average of 45-50-% of customer transaction time (Lehman, Psihogios, & Meulenbroek, 2001). As a result, numerous studies have been conducted on the ergonomic effects of scanning on cashiers.
5
significantly reduced wrist deviation, wrist acceleration and muscle activity compared to use of a single window scanner. While these check-out style scanners are very different from hand held scanners, there are still important implications that can be ascertained from check-out scanner research. For example, research has shown under utilization of the bi-optic scanner design despite it being ergonomically better. In Lehman and Marras’ study (1994), all subjects used the bi-optic scanner design to perform a series of standard grocery check-out scanning tasks. Despite all subjects scanning with this two-window design, fourteen of the thirty-two subjects did not utilize its two-window functionality. As a result, these fourteen people had significantly higher peak wrist accelerations than the subjects who used both windows. Additionally, their productivity was significantly lower than for the two-window users. Although an improved design was present, there was no quarantee that its functionality was being utilized.
6
Despite the numerous benefits to scanners, it is important to understand their inherent limitations. Although a low exertion task, the nature of scanning results in repetitive motion, which is a major cause for Musculoskeletal Disorders (MSDs). Improvement to scanner design has resulted in increased efficiency, but at a potential cost to ergonomics due to the resulting heavy reliance on scanners in industry, and thus repetitive motions of the wrist. With increased reliance on hand held scanners, it is therefore important to assess ways that the scanner design can be changed to help ergonomics as well. Because scanners are vital in many workplace settings, it is crucial to determine the best ways to incorporate them for use. The intended use based on design, and the actual use in the workplace is a concept that needs to be further investigated to determine the ways in which ergonomics and efficiency can further be improved.
7
time or preference and only significant difference in wrist extension between two of the aiming patterns. Changing the target type resulted in larger ulnar deviation for PDF codes and larger wrist extension for linear codes. For radial deviation and wrist flexion there was no significant difference between targets.
Results from Marshall and Mozrall’s (2007) study imply that area imagers increase efficiency in barcode scanning. Significant differences were not found between aiming patterns, but there were wrist posture differences depending on barcode type. Although some conclusions can be made, analysis is not complete since wrist motion in the pronation/supination plane was not measured. The rotation of the forearm is a significant motion during hand held scanning and additional data on this motion could enhance the results found in this study. Other factors such as the orientation of the barcode or training could also augment this previous work and provide added insight into scanner usability.
As previously stated, handheld scanners are used heavily in such industries as retail, manufacturing and shipping. Scanners have become a necessary facet of such industries. Curiously, few published studies are present, especially to analyze the validity of their intuitive use and inherent design. It is therefore important to assess the task of scanning as well as the scanner design in terms of ergonomics and efficiency.
2.2 Cumulative Trauma Disorders
8
30.2% of cases for days away from work due to injury or illness. Repetitive motion accounted for the highest number of median days away from work due to injury or illness (19 days), but had a fairly low incidence rate of 4 cases per 10,000 workers. Conversely, 23.3% of injury by body part was attributed to the upper extremities, with the upper extremities having the second highest incidence rate for injury at 30 cases per 10,000 workers with the median number of days of missed work at 7. Second only to the shoulder, the wrist is the body part associated with the highest median number of days away from work due to injury with an incidence rate of 5 cases per 10,000 workers. Carpal Tunnel Syndrome accounted for 29% of those injuries to the wrist. Repetitive motion injury is clearly prevalent in industry. Because of the long recuperation time for repetitive motion injuries, specifically wrist injuries, and due to the high incidence rate of injury to the upper extremities, it is importantto continue research to help improve work conditions in any way that can possibly reduce injury (Bureau of Labor Statistics, 2005, Bureau of Labor Statistics, 2006). CTDs are becoming increasingly prevalent as technology becomes more reliant on repetitive, precision movement over long periods of time. Specific attention has been given to the wrist in relation to hand held devices designed to create greater efficiency, convenience and ease of use. Despite their good intentions, these devices still pose possible harm due to repeated use over time.
9
During keyboard use, the wrists rest in a non-neutral posture which is characterized by greater wrist ulnar deviation as well as forearm pronation. During mouse use, there is greater wrist extension and less postural variability. (Serina, Tal, & Rempel, 1999). The resulting repetitive motions and sustained postures for such extreme wrist deviations are comparable to wrist motions in industrial jobs with high risk of CTDs. Dennerlein and Johnson, (2006) found that mouse intensive tasks require large extension in the forearm and wrist and keyboard intensive tasks result in ulnar deviation in the forearm and wrist. Gerr et al (2002) tracked new hires after starting a job that consisted of at least fifteen hours a week of computer work. Within the first month, 32% of those newly hired employees showed symptoms of musculoskeletal disorders, and more than 50% reported symptoms during their first year. These studies show the ergonomic results of non-neutral wrist and forearm postures and suggest that such motions should be evaluated as possible risk factors for CTDs. Similar to the keyboard and computer mouse, the productivity gained with hand held scanners also comes at a cost associated with CTDs.
10
approaching its range of motion limit, there is greater stress to the joint and greater chance of injury (Marshall, Mozrall, & Shealy, 1999). The combination of extreme and complex wrist deviations, which is also common in the use of hand held scanners, compounds the likelihood of CTDs.
11
A design consideration specific to the hand held scanner is its omni-directionality feature, which removes the need for twisting the forearm during scanning. Hand tools such as hand held scanners that consider ergonomic risk in their design can greatly minimize the occurrence of CTDs.
For many industrial tasks, the upper extremities tend to be the most frequently used body part. As a result of frequent and often times repetitive motion, trauma to the tendons and nerves in the form of CTDs can occur. Consequently, numerous studies have been conducted to analyze motions of the upper extremties to help develop an understanding of the relationship between wrist motion and injury. Research into this relationship, specifically in regards to hand held devices, could help to identify factors about product design that aid in minimizing ergonomic risk. Study on this topic, especially for those tasks and hand held devices that have not been thoroughly studied, such as hand held scanners, is of great importance.
2.3 Training
In industry, attention to worker safety and health is evident from the existence of such organizations as the National Institute for Occupational Health and Safety (NIOSH) or the Occupational Safety and Health Administration (OSHA). These organizations have been created to ensure proper working conditions and methods. Working environments are analyzed to help ensure workers are performing within a capable work capacity, and are safe and comfortable while doing their job in regards to workstation, tool design and the general work environment.
12
to overcome whatever inherent design limitations may exist. A great deal of research has been completed on the effects of training and the differences between a trained and untrained worker. One of the objectives of Ergonomics is to train workers to use better and safer working habits, which can reduce the risk of MSDs. Additionally, efficiency can be increased when such habits are properly followed.
Training is used to show people the proper use of tools or the proper techniques that may not be intuitive. Additionally, training is used in the absence of an aid to show workers techniques to minimize risk, such as proper lifting techniques. There are many training methods. One basic method for training is a lecture type format in which information is passively conveyed about a topic in order to help someone understand that topic. Other methods are more engaging and include demonstration or hands-on learning as well as information about a topic. Studies show that as the method of training becomes more engaging, the effects of the training increase, in terms of acquired knowledge and reduction of injury and illness. In general, the most engaging hands-on training methods have been shown to be three times more effective than the least engaging or lecture style training methods and this hands-on training is most effective in reducing injury and illness (Burke, Sarpy, Smith-Crowe, Chan-Serafin, Salvador, & Islam, 2006).
13
however it is not always the best method, as Lavender, Lorenz and Andersson (2002) sought to demonstrate in their study on lifting techniques. They question whether such a teaching technique is always effective since research shows these classical techniques to be largely ineffective in decreasing injury. Training of proper lifting techniques for example traditionally includes the anatomy of the back, what types of stresses the back can handle, and what good lifting techniques are. In reality, a great deal of lifting training in industry has been largely ineffective in actually preventing back injuries. (Burke, Sarpy, Smith-Crowe, Chan-Serafin, Salvador, & Islam, 2006).
Lavender, Lorenz and Andersson (2002) question informational lifting training in favor of the addition of motor skill training in which practice and muscle memory help to teach proper lifting technique. Additionally, they suggest that adopting these safer techniques is dependent on a lifestyle change, or conscious choice by the lifter, since these techniques are often perceived to increase handling time. Results of Lavender, Lorenz and Anderssons’ study show that proper lifting techniques significantly reduce spinal loading without significantly increasing handling time. A final fact to consider is their suggestion that other factors such as the perception of time pressure inherent in the job may adversely affect lifting techniques and posture. Lavender, Lorenz and Andersson point to the theory that regardless of training, if a worker feels they must work quickly, their perception of time pressure will negatively impact working posture.
14
further evidence of these differences biomechanically. In MMH lifting, both novices and experts reduce trunk asymmetries; however experts also reduce knee flexion and general asymmetries on the knee. Overall, expert methods result in less energy expenditure and are safer (Gagnon, Plamondon, Gravel, & Lortie, 1996).
If experts are considered to be safer and more efficient while at work, it is important to verify their methods against those of novices. Such was the case in a study completed by Gagnon (2005). Expert lifting techniques were analyzed and found to reduce loading on the back, decrease back asymmetries due to foot pivoting, and reduce the required mechanical work through decreased load transfer duration, decreased trajectory and decreased knee flexion. To validate these expert lifting techniques, as well as to develop improved training methods, novices observed both experts and novices performing lifting tasks, taking special note of footwork, load maneuvers and body posture, in order to compare and improve upon their own techniques. Using this training method, the novices were able to alter their techniques to more resemble that of an expert, thus improving back loading and mechanical work, as well as validating the expert techniques.
15
deviation was lower with the alternative mouse. EMG values for all wrist motions were lower with the alternative design for the trained group, but there was no difference in muscle activity between mouse types for the untrained group. Performance or task completion time, was slower for the alternative mouse and untrained group, but there was no difference in completion time between mouse types with the trained group. This study shows that training is necessary for the full benefits of an ergonomic design to be realized by a user when first using the product. Training has clearly resulted in ergonomic and efficiency benefits.
Atlas Ergonomics (Atlas Ergonomics, 2006), a company that collects data on employee discomfort and evaluates individual equipment use, discovered that merely providing the best ergonomic furniture to an office environment is not sufficient. One-thousand full-time office employees were surveyed before and after an ergonomic evaluation, workstation alteration and training on those alterations to discover levels of discomfort and knowledge regarding their office furniture features. Employees among three companies experienced 18-33% reduction in maximum discomfort within one month of the changes and 45-60% reduction within nine months. Prior to training and adjustments, 20% of employees had little to no knowledge about their furniture, while 45% had good knowledge. Nine months after the evaluation, 7% had little to no knowledge and 70% had good knowledge. This case study demonstrates that simply providing ergonomically designed products is not adequate to preventing musculoskeletal discomfort and injury. Education and training about the products is necessary for the benefits to be fully realized.
16
performance in terms of ergonomics and efficiency. Additionally, the benefits of ergonomic product design features are better utilized when training of such features occurs. Expert user methods can be used to help train novices in a format that directly engages the user, such as practice of proper techniques and observation of expert versus novice task completion or product use. These types of training methods are potentially the most effective in reducing ergonomic risk and increasing efficiency.
2.4 Conclusion
As is evident from past research, Cumulative Trauma Disorders of the wrist are prevalent in industry and it is beneficial to study repetitive tasks in order to better understand the ways in which the ergonomic risk factors can be reduced. Hand held devices are a major cause for such disorders, with their characteristic frequent, repetitive movement. High rates of wrist injury can be found in such industries as retail, where scanning is prevalent. Numerous studies have been completed on wrist and arm motion of cashier scanning. However, little work has been completed in other industries where hand held scanning is present, such as manufacturing and shipping. Subsequently, certain aspects of the scanning process have not been investigated, such as level of training, or the resulting wrist deviations from the various possible target types or aiming patterns of the scanner. Such knowledge would be useful in an age where scanners are heavily used for product tracking as well as in package delivery. Information learned from such a study, as well as general knowledge about omni-directional scanners could be vital training material for scanner users and useful information for product designers.
17
18
Section 3
Methodology
3.1 Experimental Objective
A primary objective of this study was to determine if training has an effect on the use of an omni-directional hand held scanner. Specifically, the goal was to determine the benefit of training for hand held scanner use in terms of ergonomics and task efficiency. An additional objective was to determine whether these training effects are mitigated by other scanner design factors including aim pattern and target type.
3.1.1 Hypotheses
Based on the experimental objective, the following hypotheses are proposed.
• Training will result in increased use of the omni-directional functionality, thereby reducing wrist deviation and improving ergonomics, while also improving efficiency during scanning tasks.
• Over time, the performance of untrained subjects will approach that of trained subjects in terms of ergonomics and efficiency.
• Regardless of training level, time pressure will cause subjects to reduce the use of omni-directionality, resulting in negative effects on ergonomics.
19
3.2 Experimental Overview
This study utilized a repeated measures experimental design with 16 subjects. The experiment duration was ten days with a two-day break at the half-way point (12 days total). The experiment consisted of two tasks, a Self-Paced Task and a Time-Stress Paced Task, which are described in detail in Section 3.6.5 and Section 3.6.6. The Self-Paced Task was performed each of the ten days. The Time Stress-Paced Task was performed after The Self-Paced Task on the fifth and tenth day. An outline of the experiment schedule is shown in Table 3.1. Subjects were counterbalanced (half were assigned to the Trained Group and half were assigned to the Untrained Group) based on level of training at entry into the study. The study was conducted within a seven-week time span.
All subjects performed one replication of The Self-Paced Task with each aiming pattern, each day, resulting in ten replications per aiming pattern per subject overall. The order in which the aiming patterns were used each day was randomized. Subjects performed one replication of Task 2 with each aiming pattern, on the designated days (fifth or tenth), resulting in 2 replications per aiming pattern per subject overall. For Task 2 the order in which the aiming patterns were used each day was identical to the order used for that day during The Self-Paced Task.
Task Day 1
Day 2
Day 3
Day 4
Day 5
Break Day
Break Day
Day 6
Day 7
Day 8
Day 9
Day 10
Self-Paced
Time Stress-Paced
20
3.3 Subjects
The Trained Group had 8 subjects (3 male, 5 female) and the Untrained Group had 8 subjects (6 male, 2 female), totaling 16 subjects (9 male, 7 female) participating in the study. All subjects were right handed, college age, undergraduate or graduate level engineering students. Subjects were paid for their participation after successfully completing the study. It was necessary to ensure a group of completely inexperienced hand held scanner users for the Untrained Group, therefore half of those participants selected were required to have no scanning experience. If a subject had any experience with hand held scanners, they were placed in the Trained Group.
3.4 Independent Variables
3.4.1 Group (Training Level)
21
3.4.2 Subject
Subject was an independent variable consisting of 16 participants. Because of the natural variability between participants, this variable was blocked in the within subject ANOVA design. Because half of the subjects participated in the Trained Group and half in the Untrained Group, this variable was also nested within the Group independent variable for the between subject ANOVA design.
3.4.3 Aiming Pattern
22
[image:38.612.230.420.245.350.2]Figure 3.1: Representation of Scanner Aim Patterns (a) Crosshair (B) Bracket (c) Bulls-eye (d) LED (e) Grid
Figure 3.2: Example of Hand Held Scanner
3.4.4 Target Type
Target type was an independent variable consisting of three levels (Linear, Data Matrix and Portable Data File (PDF) codes). Examples of these targets can be found in Figure 3.3. These target types are major code technologies frequently used in industry. During the Self-Paced Task and the Time Stress-Paced Task, subjects were asked to scan three scan boards, with one containing only linear codes, one containing only Data Matrix codes, and one containing only PDF codes. The order in which each target type scan board was scanned was randomized.
Figure 3.3: Target Types (a) Linear Barcode (b) Data Matrix (c) PDF
23
3.4.5 Day
Day was an independent variable consisting of ten levels for the Self-Paced Task and two levels for Time Stress-Paced Task. Subjects performed The Self-Paced Task Monday through Friday for two consecutive weeks, resulting in 10 weekdays in succession. Subjects performed the Time Stress-Paced Task on the fifth and tenth day (Fridays) of their respective experiment.
3.4.6 Task
For the Time Stress-Paced Task the independent variable Task is used to compare the Self-Paced Task and the Time-Stress Self-Paced Task in order to assess the effect of Time Stress on ergonomics and efficiency. Further information regarding the Self-Paced and Time Stress-Paced Tasks can be found in Sections 3.6.5 and 3.6.6, respectively.
3.5 Dependent Variables
3.5.1 Forearm Pronation/Supination Deviation
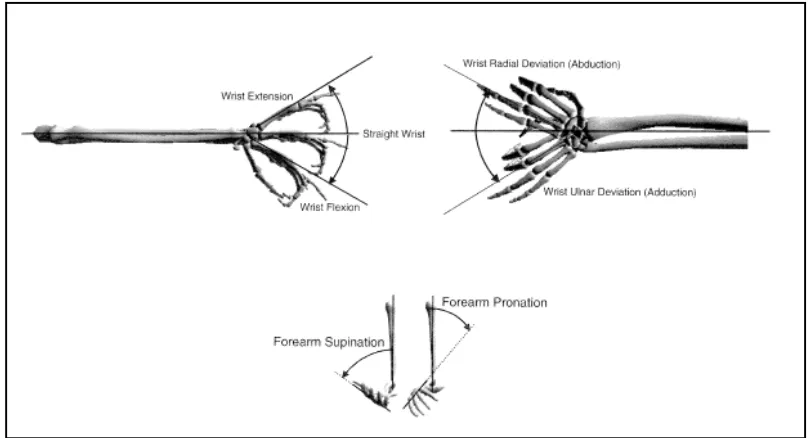
Forearm pronation/supination deviation average was a dependent variable in both Tasks. The average deviation was calculated for each of the four rows of each of the scan boards. Forearm deviation was recorded as a means of tracking ergonomics. Depictions of the range of motion for forearm pronation/supination deviation can be found in Figure 3.4 below.
3.5.2 Wrist Flexion/Extension Deviation Average
24
was recorded as a means of tracking ergonomics. Depictions of the range of motion for wrist flexion/extension deviation can be found in Figure 3.4 below.
3.5.3 Wrist Radial/Ulnar Deviation Average
[image:40.612.103.507.306.525.2]Wrist radial/ulnar deviation average was a dependent variable in both Tasks. The average deviation was calculated for each of the four rows of each of the scan boards. Wrist deviation was recorded as a means of tracking ergonomics. Depictions of the range of motion for wrist radial/ulnar deviation can be found in Figure 3.4 below.
Figure 3.4: Angle Definitions for the Wrist and Forearm (Delleman, Haslegrave, & Chaffin, 2004)
3.5.4 Scan Time
25
3.5.5 Subjective Aiming Pattern Rating for Perceived Comfort
Subjective aiming pattern rating for perceived comfort was a dependent variable in both Tasks. After performing a task with an aiming pattern, subjects were asked to rate the scanner on a five-point Likert scale (Appendix A) in terms of how comfortable the scanner was during use in performing the task. Prior to the start of the experiment, instruction was given on use of the scale. Subjects were instructed to rate the aiming patterns with open ended criteria, not restricting their perceived comfort ratings to any particular guidelines. Perceived comfort was recorded in order to determine the relationship between wrist and forearm deviations, aim pattern and perceived comfort.
3.5.6 Subjective Aiming Pattern Rating for Perceived Usability
26
3.5.7 Subjective Aiming Pattern Rank
Subjective aiming pattern rank was a dependent variable in both Tasks. After performing a task with all five aiming pattern, subjects were asked to rank the five aiming patterns in order of preference. Subjects physically reordered the scanners to reflect their preference. Subjects were instructed to rank the aiming patterns with open ended criteria, not restricting their preferences to be based on simply comfort and usability. Aiming pattern rank was recorded in order to determine the relationship between wrist and forearm deviations, training and aiming pattern preference.
3.6 Experimental Procedure
3.6.1 Overview
27
3.6.2 Informed Consent
Subjects were informed of the nature of and background information for the study, as well as the basic procedure to be followed. They were informed of the risks inherent in the study, and shown the instrumentation to be used for data collection. Subjects were then required to read and sign an informed consent form approved for use by the Institutional Review Board of Rochester Institute of Technology (Appendix C).
3.6.3 Instrumentation
28
[image:44.612.73.222.71.223.2]
Figure 3.5: Goniometry Attachment for Figure 3.6: Goniometry Attachment for two-axis and single-axis sensors
two-axis sensor (Biometrics Ltd., 2002)
29 Figure 3.7: Example Scan Board: PDF Scan Board
Scanning was completed with four identical Hand Held Products laser area image scanners and one Hand Held Product LED area image scanner provided by Honeywell. Each scanner projected a different Aim Pattern, but all scanners were capable of omni-directional scanning.
3.6.4 Training
30
functionality and use. This training was given on the first day of the experiment only. Information was provided on basic hand held scanner functionality and the Trained Group was told that the scanners were omni-directional and thus the scanner did not need to be rotated to match the orientation of a target. As a result, subjects were told that their wrist could remain neutral throughout the scanning tasks. Because the Trained Group received engaging training, a label was also placed on each of the scanners as an additional vehicle for information to be conveyed to the subjects. This label was a visual reminder of the omni-directionality benefit and provided refresher training throughout the study. This label was considered part of Training and was only placed on the Trained Group’s scanners. An image of the label can be found in Figure 3.8
KEEP YOUR WRIST NEUTRAL!
Figure 3.8: Caution Label
Instruction on task completion was given then demonstration of proper scanning technique was completed and subsequently, subjects were instructed to practice proper scanning methods using the different aiming patterns, on the different target types. Subjects were instructed to continue practicing until they felt comfortable with the scanning task, usually taking no more than five minutes to practice. This concluded the training session for the Trained Group.
31
3.6.5 Self-Paced Task
The focus of this study was on characteristics of the scanning process. Consequently, simulated scanning tasks using scan boards (Section 3.6.3) were used. The Self-Paced Task consisted of scanning a set of scan boards, one at a time, from left to right. Within each scan board subjects were instructed to scan the rows in the order denoted next to each row, from left to right. An image depicting task setup can be found in Figure 3.9 below. Data collection began at the start of a verbal cue and ended with the task when the subject completed scanning all three scan boards. The Self-Paced Task was then repeated four times for the remaining aiming patterns.
[image:47.612.138.511.451.681.2]The Self-Paced Task was completed every weekday for ten days. After instrumentation was set up for data collection, subjects were positioned for the start of the task and given the first of five scanners for use. The top row on each scan board was placed at eye level. Subjects were instructed to complete the task at a normal, comfortable pace, as if the task was their fulltime job. Upon hearing a verbal cue, subjects were to begin the task.
32
[image:48.612.77.539.368.642.2]Data collection consisted of reading in wrist and forearm deviation in the three planes of movement previously described in Sections 3.5.1, 3.5.2 and 3.5.3. Additionally, a digital event marker was used to signify specific points during the task. Events flagged with a marker were the start and finish of the task as well as the end of each row and start of each board, totaling 15 markers for every Task completion. Task completion time was recorded concurrently with angular movements using the same software. An example of the graphical display resulting from data collection can be found in Figure 3.10. The vertical lines signify the digital event markers. The top-most data trace represents Ulnar and Radial Deviation. The middle data trace represents Pronation and Supination. The bottom-most data trace represents Flexion and Extension.
33
3.6.6 Time Stress-Paced Task
The Time Stress-Paced Task was completed on the fifth and tenth day of the experiment after completion of the Self-Paced Task. The Time Stress-Paced Task is identical to the Self-Paced Task with the exception of initial scanning instructions. Instead of being asked to perform at a comfortable pace, subjects were instructed to complete the task as fast as possible. Subjects were told their task completion times from the Self-Paced Task for the given day for a given aiming pattern, with a goal of completing the Time Stress-Paced Task faster than the Self-Paced Task.
3.6.7 Subjective Rating and Rank
34
3.7 Data Analysis
Raw data were collected for task completion time and wrist and forearm deviation in the pronation/supination, flexion/extension and radial/ulnar movement planes. Wrist and forearm deviation data were converted to degrees of movement from neutral according to the Biometrics provided conversion found in the user’s manual. A macro specific to the experiment set-up was written in Microsoft Excel using Visual Basic in order to separate the data by event marker. All data were then compiled into a single spreadsheet that was formatted for the MiniTab statistical software package.
35
Section 4
Results
Analysis of variance for repeated measures was completed for both the Self-Paced and Time Stress-Paced Tasks. The independent variables Group, Subject, Aim Pattern, Target Type, Day and Task were used with the dependent variables for Supination, Pronation, Flexion, Extension, Ulnar Deviation, Scan Time, Perceived Comfort and Perceived Usability.
4.1 Self-Paced Task
During the self-paced task, participants were instructed to complete the scanning task at a normal, comfortable pace as if the task were their full-time job. An ANOVA for repeated measures was completed on wrist deviations and scan time to assess ergonomics and efficiency. Table 4.1.1 depicts a summary of the ANOVA results.
36
Subject
(Group)
Group Day
Aim Pattern Target Type Group* Day Group* Aim Pattern Group* Target Type Day*Aim Pattern Day* Target Type Aim Pattern* Target Type Group* Day* Aim Pattern Group* Day* Target Type Group*Aim Pattern* Target Type Day*Aim Pattern* Target Type
Supination 0.000* 0.143 0.000* 0.000* 0.000* 0.000* 0.397 0.000* 0.148 0.000* 0.000* 0.685 0.000* 0.944 0.998
Pronation 0.000* 0.050* 0.000* 0.364 0.000* 0.000* 0.044* 0.012* 0.035* 0.000* 0.938 0.004* 0.061 0.972 0.999
Flexion 0.000* 0.568 0.000* 0.000* 0.000* 0.000* 0.000* 0.000* 0.612 0.000* 0.000* 0.567 0.051 0.000* 0.991
Extension 0.000* 0.680 0.000* 0.054 0.000* 0.000* 0.002* 0.005* 0.480 0.011* 0.662 0.702 0.005* 0.691 1.000
Ulnar 0.000* 0.430 0.000* 0.629 0.000* 0.000* 0.236 0.000* 0.965 0.361 0.250 0.277 0.742 0.699 1.000
Time 0.000* 0.301 0.000* 0.000* 0.000* 0.041* 0.101 0.000* 0.294 0.000* 0.000* 0.826 0.892 0.002* 0.175
[image:52.612.86.713.74.520.2]*Significant at .05 alpha level
Table 4.1.1: Self-Paced Task Ergonomics and Efficiency ANOVA Results 1
Subject
(Group)
Group Day
Aim Pattern Target Type Group* Day Group* Aim Pattern Group* Target Type Day*Aim Pattern Day* Target Type Aim Pattern* Target Type Group* Day* Aim Pattern Group* Day* Target Type Group*Aim Pattern* Target Type Day*Aim Pattern* Target Type
Supination 0.000* 0.000* 0.000* 0.000* 0.000* 0.000* 0.000* 0.000* 0.000*
Pronation 0.000* 0.050* 0.000* 0.000* 0.000* 0.044* 0.012* 0.035* 0.000* 0.004*
Flexion 0.000* 0.000* 0.000* 0.000* 0.000* 0.000* 0.000* 0.000* 0.000* 0.000*
Extension 0.000* 0.000* 0.000* 0.000* 0.002* 0.005* 0.011* 0.005*
Ulnar 0.000* 0.000* 0.000* 0.000* 0.000*
Time 0.000* 0.000* 0.000* 0.000* 0.041* 0.000* 0.000* 0.000* 0.002*
*Significant at .05 alpha level Fully Analyzed
4.1.1 Ergonomics
4.1.1.1 Radial Deviation
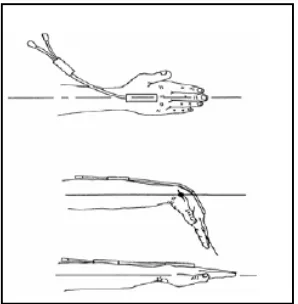
Radial Deviation is not included in further analysis since this wrist posture is not prominently used in handheld scanning. Figure 4.1.1 and 4.1.2 below display a snapshot of the percentage of time during each task that two
posture obtained during scanning.
Target Type is shown in Figure 4.1.3. Based on the small amount of Radial Deviation present, it is concluded that further Radial Deviation a
Figure 4.1.1 and 4.1.2: Wrist/Forearm Postures Obtained during Scanning
wrist deviation for two subjects in the Trained Group. The figure on the right depicts percentage in each wrist deviation for subjects in the Untrained Group. The black bars correspond to the self
Circled is the percentage of Radial Deviation.
Figure 4.1.3:
of average radial and ulnar deviation for both Groups during the self-paced
correspond to Ulnar Deviation. The grey bars correspond to Radial Deviation. Circled is average radial deviation.
0.0% 10.0% 20.0% 30.0% 40.0% 50.0% 60.0% 70.0% 80.0% 90.0% 100.0%
Wrist/Forearm Postures Obtained during Scanning
% o f T im e in e a ch P o st u re 10.00 15.00 20.00 25.00 30.00 35.00 W ri st D e v ia ti o n i n D e g re e s 37
Radial Deviation is not included in further analysis since this wrist posture is not prominently used in handheld scanning. Figure 4.1.1 and 4.1.2 below display a snapshot of the percentage of two subjects from each Group were in each wrist and forearm posture obtained during scanning. Additionally, average Radial and Ulnar Deviation for each Target Type is shown in Figure 4.1.3. Based on the small amount of Radial Deviation present, it
s concluded that further Radial Deviation analysis is not necessary or applicable to this study.
Wrist/Forearm Postures Obtained during Scanning– The Figure on the left depicts percentage in each wrist deviation for two subjects in the Trained Group. The figure on the right depicts percentage in each wrist deviation for subjects in the Untrained Group. The black bars correspond to the self-paced task and the gray bars correspond to the time
Figure 4.1.3: Ulnar & Radial Deviation by Target Type – Depiction of average radial and ulnar deviation for both Groups during the paced task broken down by Target Type. The black bars correspond to Ulnar Deviation. The grey bars correspond to Radial Deviation. Circled is average radial deviation.
Wrist/Forearm Postures Obtained during Scanning - Trained Group
0.0% 10.0% 20.0% 30.0% 40.0% 50.0% 60.0% 70.0% 80.0% 90.0% 100.0%
Wrist/Forearm Postures Obtained during Scanning
% o f T im e in e a ch P o st u re 0.00 5.00 10.00 15.00 20.00 25.00 30.00 35.00
Linear Data Matrix PDF-417 Ulnar & Radial Deviation by Target Type
Target Type
Radial Deviation is not included in further analysis since this wrist posture is not prominently used in handheld scanning. Figure 4.1.1 and 4.1.2 below display a snapshot of the percentage of each wrist and forearm eviation for each Target Type is shown in Figure 4.1.3. Based on the small amount of Radial Deviation present, it
s not necessary or applicable to this study.
The Figure on the left depicts percentage in each wrist deviation for two subjects in the Trained Group. The figure on the right depicts percentage in each wrist deviation for two ed task and the gray bars correspond to the time-stress task.
38
4.1.1.2 Supination
All Minitab results for Supination in the Self-Paced Task can be found in Appendix D.
4.1.1.2.1 Group*Day*Target Type
Data were separated by Group (Trained and Untrained). Within each Group, data were then separated by Target Type to analyze the effect of Day. Interaction plots for the Group*Day*Target Type three-way interaction are depicted below in Figures 4.1.4 and 4.1.5.
Figure 4.1.4: Supination: Target Type versus Day – Trained Group, Interaction Plot
Figure 4.1.5: Supination: Target Type versus Day – Untrained Group, Interaction Plot
For each Target Type within each Group, Tukey’s HSD Post Hoc Test was completed for Day to determine statistically significant differences between Days. For the Linear Target Type and the Trained Group, Day is statistically significant (F9, 1520=3.21, P=0.003). Day 4 is
0.00 1.00 2.00 3.00 4.00 5.00 6.00 7.00 8.00 9.00 10.00
1 2 3 4 5 6 7 8 9 10
Linear
Data Matrix
Day
Supination: Target Type versus Day - Trained Group
W ri st D e v ia ti o n i n D e g re e s 0.00 1.00 2.00 3.00 4.00 5.00 6.00 7.00 8.00 9.00 10.00
1 2 3 4 5 6 7 8 9 10
Linear
Data Matrix
Day
Supination: Target Type versus Day – Untrained Group
39
significantly different from both Day 7 (P=0.0401) and Day 10 (P=0.0345). There are no other statistically significant differences between days at a .05 or .10 alpha level. For the Linear Target Type and the Untrained Group, Day is not statistically significant (F9, 1520=0.93, P=0.505). There are no statistically significant differences between Days at a .05 or .10 alpha level. Figure 4.1.6 and 4.1.7 below depict average Supination for the Linear Target Type for both Groups.
Figure 4.1.6: Supination: Linear Target Type – Trained Group Figure 4.1.7: Supination: Linear Target Type – Untrained Group
For the Data Matrix Target Type and the Trained Group, Day is statistically significant (F9, 1520=2.26, P=0.029). However, there are no statistically significant differences between Days
at a .05 or .10 alpha level. For the Data Matrix Target Type and Untrained Group, Day is not statistically significant (F9, 1520=1.53, P=0.158). There are no statistically significant differences between Days at a .05 or .10 alpha level. Figures 4.1.8 and 4.1.9 below depict average Supination deviation for the Data Matrix Target Type for both Groups.
Figure 4.1.8: Supination: Data Matrix Target Type – Trained Group Figure 4.1.9: Supination: Data Matrix Target Type – Untrained Group
0.00 2.00 4.00 6.00 8.00 10.00
1 2 3 4 5 6 7 8 9 10
Supination: Linear Target Type – Trained Group
Day W ri st D e v ia ti o n i n D e g re e s 0.00 2.00 4.00 6.00 8.00 10.00
1 2 3 4 5 6 7 8 9 10
Supination: Linear Target Type – Untrained Group
Day W ri st D e v ia ti o n i n D e g re e s 0.00 2.00 4.00 6.00 8.00 10.00
1 2 3 4 5 6 7 8 9 10
Supination: Data Matrix Target Type – Trained Group
Day W ri st D e v ia ti o n i n D e g re e s 0.00 2.00 4.00 6.00 8.00 10.00
1 2 3 4 5 6 7 8 9 10
Supination: Data Matrix Target Type – Untrained Group
40
For the PDF Target Type and the Trained Group, Day is not statistically significant (F9, 1520=1.77, P=0.092). There are no statistically significant differences between days at a .05 or .10 alpha level. For the Data Matrix Target Type and Untrained Group, Day is not statistically significant (F9, 1520=0.76, P=0.654). There are no statistically significant differences between Days at a .05 or .10 alpha level. Figure 4.1.10 and 4.1.11 below depict average Supination deviation for the PDF Target Type for both Groups.
Figure 4.1.10: Supination: PDF Target Type – Trained Group Figure 4.1.11: Supination: PDF Target Type – Untrained Group
For the Linear Target Type, Day was statistically significant for both Groups. However, there were statistically significant differences for Day in the Trained Group, but not in the Untrained Group. Although Day was statistically significant for the Data Matrix Target Type in the Trained Group, no pair-wise difference between Days were statistically significant. In general, the Untrained Group had greater average supination than the Trained Group across all Target Types and Days. Although there are statistically significant differences between Days, no obvious trends emerge for either Group, for any Target Type.
4.1.1.2.2 Group*Target Type (Target Type Main Effect)
Data were separated by Group (Trained and Untrained) to analyze the Target Type Main Effect within each Group. An interaction plot for the Group*Target Type two-way interaction is depicted below in Figure 4.1.12.
0.00 2.00 4.00 6.00 8.00 10.00
1 2 3 4 5 6 7 8 9 10
Supination: PDF Target Type - Trained Group
Day W ri st D e v ia ti o n i n D e g re e s 0.00 2.00 4.00 6.00 8.00 10.00
1 2 3 4 5 6 7 8 9 10
Supination: PDF Target Type – Untrained Group
41
Figure 4.1.12: Supination: Target Type Main Effect by Group – Interaction Plot
For each Group, Tukey’s HSD Post Hoc Test was completed for Target Type to determine statistically significant differences between Target Types. For the Trained Group, Target Type is statistically significant (F2, 4776=7.11, P=0.007). The Linear Target Type is statistically different from the Data Matrix and PDF Target Types (P-value= 0.0146 for both pair-wise comparisons). For the Untrained Group, Target Type is statistically significant (F2, 4776=5.68, P=0.016). The Linear Target Type is statistically different from the Data Matrix Target Type (P-value=0.0119). There are no other statistically significant differences between Target Types at a .05 or .10 alpha level in either Group.
Within the Linear Target Type there is no statistically significant difference between Groups (F1, 3184=3.73, P=0.095). Within the Data Matrix Target Type there is no statistically significant difference between Groups (F1, 3184=0.85, P=0.386). Within the PDF Target Type there is no statistically significant difference between Groups (F1, 3184=2.39, P=0.166). Although the Untrained Group has higher average Supination for all Target Types it is not statistically significant at a .05 alpha level. For the Linear Target Type, there is a difference between Groups at a .10 alpha level with the Untrained Group averaging 4.21 degrees greater Supination than the Untrained Group. Figure 4.1.13 depicts the average Supination for each Group by Target Type.
0.00 1.00 2.00 3.00 4.00 5.00 6.00 7.00 8.00
Linear Data Matrix PDF
Trained
Untrained
Supination: Group versus Target Type
Target Type
W
ri
st
D
e
v
ia
ti
o
n
i
n
D
e
g
re
e
42
Figure 4.1.13: Supination: Target Type Main Effect by Group
4.1.1.2.3 Aim Pattern*Target Type
Data were separated by Target Type to analyze the effect of Aim Pattern within each Target Type. An interaction plot for the Target Type*Aim Pattern two-way interaction is depicted below in Figure 4.1.14.
Figure 4.1.14: Supination: Target Type versus Aim Pattern – Interaction Plot
For each Target Type, Tukey’s HSD Post Hoc Test was completed for Aim Pattern to determine statistically significant differences between Aim Patterns. When the Trained Group scans the Linear Target Type, Aim Pattern is statistically significant (F4, 1560=11.10, P=0.000). The LED Aim Pattern is significantly different from the Bracket, Grid, Crosshair and Bulls-eye Aim
0.00 2.00 4.00 6.00 8.00 10.00 12.00 14.00 16.00
Linear Data Matrix PDF
Trained
Untrained
Supination: Target Type
Target Type W ri st D e v ia ti o n i n D e g re e s 0.000 1.000 2.000 3.000 4.000 5.000 6.000 7.000 8.000
Linear Bracket Grid Crosshair Bulls-eye
Linear
Data Matrix
Aim Pattern
Supination: Target Type versus Aim Pattern – Trained & Untrained
43
Patterns (P=0.0001, 0.0005, 0.0001, and 0.0001 respectively). The LED Aim Pattern results in an average 2.33 degrees greater Supination than the other Aim Patterns.
When the Untrained Group scans the Linear Target Type, Aim Pattern is statistically significant (F4, 1560=6.46, P=0.001). The LED Aim Pattern is significantly different from the Bracket, Grid, Crosshair and Bulls-eye Aim Patterns (P=0.0135, 0.0031, 0.0032, and 0.0017 respectively). The LED Aim Pattern results in an average 2.45 degrees greater Supination than the other Aim Patterns.
There are no statistically significant differences (at .05 or .10 level) between the Bracket, Grid, Crosshair and Bulls-eye Aim Patterns when scanning the Linear Target Type for either Group.
For the LED and Bracket Aim Patterns, Group is not statistically significant at a .05 level, but is at a .10 alpha level (LED: F1, 624=4.78, P=0.065; Bracket: F1, 624=4.45, P=0.073). When the Untrained Group scans the Linear Target Type with the LED or Bracket Aim Pattern, the average Supination is an average 4.43 degrees greater than for the Trained Group