Int. J. Electrochem. Sci., 14 (2019) 7773 – 7789, doi: 10.20964/2019.08.91
International Journal of
ELECTROCHEMICAL
SCIENCE
www.electrochemsci.orgMulti-physics Simulation of the Surface Polishing Effect During
Electrochemical Machining
Weidong Liu, Sansan Ao, Zhen Luo*
School of Materials Science and Engineering, Tianjin University, Tianjin 300350, China.
*E-mail: [email protected]
Received: 18 April 2019 / Accepted: 4 June 2019 / Published: 30 June 2019
Electrochemical machining (ECM) is a widely used non-traditional machining technology. In addition to excellent shaping performance, ECM can generate a smooth surface finish. However, experimental investigations into the surface polishing mechanism of ECM are extremely challenging. To understand this microscale mechanism more deeply, we developed a novel multi-physics model for a numerical simulation. The model accounts for the major factors involved in ECM, including the electric field, flow field, ion transfer, electrode reaction kinetics, and anodic shape evolution. Based on this model, we investigated the effects of applied potential and flow speed on surface polishing. Furthermore, we studied the effect of the material's microstructure on surface polishing in ECM by setting position-dependent equilibrium potentials as boundary conditions. Our results show that the formation of an anodic supersaturated film, which is affected by the applied potential and flow speed, plays an important role in surface polishing.
Keywords: Multi-physics simulation; surface polishing; electrochemical machining;
1. INTRODUCTION
Electrochemical machining (ECM) is a non-traditional machining technology widely used in a diverse range of industries. Shaping of the workpiece by ECM is achieved by the controlled dissolution of localized anodic materials [1]. Thus, ECM has some specific merits including a relatively high machining rate for hard metals, no tool wear, and a good machined surface quality [2-4].
Despite the fact that ECM has been developed and industrially applied for decades, there are many difficulties in the design and prediction process for ECM. Optimization of the ECM machining conditions usually requires trial-and-error, which comes with a significant time investment and economic cost.
because various chemical reactions are involved in the ECM process. Over the years, simulation techniques for ECM have progressed from simple analytical methods (i.e., the cos θ method [6, 7], the complex variables method [8], and the iteration integral method [9]) to complex numerical methods (i.e., the finite difference method [10, 11], finite element method [12, 13], and boundary element method [14, 15]). Additionally, the development of physical models that include more factors, such as electric field, flow field, temperature field, ion transfer, electrode reaction kinetics, current efficiency, and anodic shape evolution, are considered to improve simulation accuracy [5, 16-18]. However, nearly all models made to date focus on the macroscale shaping process; this has obvious limitations for the analysis of the surface polishing phenomenon as this approach neglects the detailed electrode kinetics.
The surface polishing effect of ECM has been attributed to the formation of a supersaturated film at the anode/electrolyte interface [19, 20]. A theoretical schematic of the interfacial structure of this film has been proposed based on previous experimental research [21-26]. However, it is an extremely challenging task to quantitatively investigate this film and its effects on surface polishing in experiments, because this film is extremely thin (i.e., the film thickness is on the order of micrometers) and only exists at the anode/electrolyte interface during the electrochemical reaction. Achieving an in-depth understanding of this microscale mechanism that underpins ECM requires a numerical investigation of this film and its effects through using a simulation.
This paper presents a multi-physics model to simulate the surface polishing effect in ECM. In this model, the major factors in ECM, including electric field, flow field, electrode kinetic, ion transfer, and anodic shape evolution, are considered. The electric field is solved by a Laplace equation, while the flow field is modelled by single phase flow Navier-Stokes equations. Then, the distribution of the ion concentrations is computed by solving the ion transfer model to couple the above two fields. Ion generation is governed by a concentration-dependent Butler-Volmer equation, which can more precisely express the electrode kinetics in comparison with previous simulation models. Ion transfer is a result of diffusion, convection, and migration. Additionally, the concentration-dependent equations for the density, diffusion coefficient, and dynamic viscosity are applied to determine the electrolyte flow properties. Finally, the anodic shape evolution is solved using Faraday's Law. Furthermore, the effect of the material's microstructure on surface polishing is also investigated using a novel method to set the boundary conditions. A position-dependent function of the equilibrium potentials is applied as the anodic boundary conditions, which is an efficient way to describe different material microstructures. The above-described multi-physics models were computed using a commercial simulation software package, COMSOL Multiphysics version 5.0.
2. COMPUTATIONAL MODELS
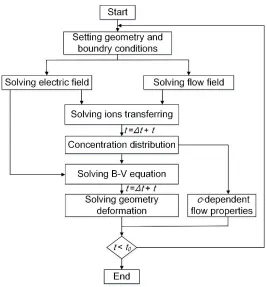
Figure 1. Flow chart for the simulation.
To simplify this multi-physics model, several assumptions are taken as follows:
(1) The electrolyte flow through the gap is assumed to be laminar. In addition, the effect of bubbles generated on the electrodes is neglected; therefore, the electrolyte flow is simplified to be a single-phase flow.
(2) The simulation of the electric field is simplified to be a potential modelling problem, which can be expressed by a Laplace equation. The rapid electrolyte flow enables sufficient refreshing of the electrolyte in ECM. The effects of the gas and ions on the electric field are logically neglected in the bulk electrolyte.
(3) The thermal effects are neglected. Although the heat generated by the electrode reaction and electrolyte resistance causes the electrolyte temperature to change, this effect is very weak (up to 50 °C) owing to the fast electrolyte flow [18]. Thus, the temperature field is not included in this work for simplicity.
2.1. Geometry
[image:3.596.166.433.68.355.2]
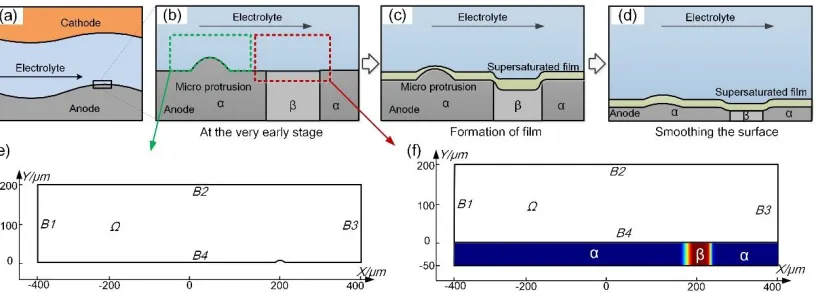
large number of metal atoms to be anodized as ions at the anodic surface. These ions cannot be moved into the bulk electrolyte immediately. Thus, the dissolved ions accumulate on the anodic surface. When the ion concentration exceeds a specific value, the supersaturated salt precipitates, causing a honey-like viscous film to form (Fig. 2(c)) [21]. As a result, the anodic surface is polished owing to local differences in the current density caused by the fluctuation of the film thickness (Fig. 2(d)).
To study the ECM polishing effect in detail, we constructed a geometric model (Fig. 2(e)) with a micro protrusion (5-μm-high) on the anodic surface. Additionally, a long entrance zone was located prior to the micro protrusion to allow sufficient development of the flow field. Furthermore, the material's microstructure also has a decisive impact on the machined surface in ECM [24, 27-29] owing to the different electrochemical properties that arise from different microstructures. To investigate this effect, we set the anodic boundary conditions with different equilibrium potentials to represent different microstructures using a position-dependent function (Fig. 2(f)), which is expressed as follows:
micro(x, y) = { 𝐸𝑒𝑞𝛼; 𝑥 ∈ (175, 225), 𝑦 ∈ (−50, 0)
𝐸𝑒𝑞𝛽; 𝑥 ∈ (−400, 175) ∪ (225, 400), 𝑦 ∈ (−50, 0)
(1)
where Eeqα and Eeqβare the equilibrium potentials of the α- and β-microstructure, respectively.
Figure 2. Development of the geometric model. (a) Schematic of the ECM inter-electrode gap. (b)–(d) Supersaturated film formation process during ECM. (e) Geometric model for studying parametrical effects. (f) Geometric model for studying the effect of the material's microstructure.
2.2. Electric field
Determining the current density distribution on the anodic interface and in the electrolyte domain is imperative for modeling ECM. A potential model (Laplace equation) was used in this work to solve the electric field, such that
[image:4.596.99.507.386.535.2]
where φ and i represent the electrolyte potential and the current density, respectively. κ is the electrical conductivity of the electrolyte, which was set as 16 S m-1 to correspond with the NaNO3
electrolyte widely used in ECM.
2.3. Flow field
The electrolyte flow in ECM is considered to be a single-phase flow field, which can be expressed by the incompressible laminar Navier-Stokes equations, given by
∇𝑣 = 0 (4) 𝜌 (𝜕𝑣
𝜕𝑡+ 𝑣∇𝑣) = −∇𝑝 + 𝜇∆𝑣 (5)
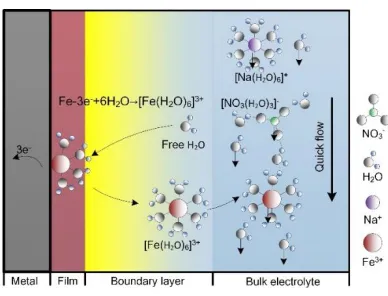
where p is the fluid pressure and v is the flow speed. As shown in Fig. 3, metal atoms are consumed as ions at the anodic interface. Then, these ions are dissolved into the electrolyte near the anode, inevitably affecting the dynamic viscosity, μ, and the density, ρ. Thus, the variation of ρ is mainly attributed to the dissolution of metal; therefore, it can be expressed as
𝜌 = 𝜌0+ 𝑀𝑐 (6)
where c is the concentration of dissolved metal ions, ρ0 is the density of the bulk electrolyte, and M is the molar mass of the anodic material. Additionally, the concentration-dependent μ is presented in the literature [16-18] as,
𝜇 = 𝜇0(1 + 0.0063√𝑐 + 0.042𝑐 + 0.022𝑐2− 0.0002𝑐2.5) (7)
where μ0is the reference dynamic viscosity equal to 2.4152 kg m-1s-1.
2.4. Electrode reaction kinetics
In this work, to precisely describe the electrode reaction kinetic, a concentration-dependent Butler-Volmer equation was applied. The general concentration-dependent Butler-Volmer relation is given by
𝑖𝑑𝑖𝑠 = 𝑖0[𝑐𝑂𝑠 𝑐𝑂𝑏
exp (𝑛𝛼𝐹
𝑅𝑇 𝜂) − 𝑐𝑅𝑠 𝑐𝑅𝑏
exp (−𝑛𝛽𝐹
𝑅𝑇 𝜂)] (8)
where idis is the current density for metal dissolution; i0 is the exchange current density; 𝑐𝑂𝑠 and 𝑐𝑂𝑏 are the surface and bulk concentration of rate limiting species in oxidization reaction, respectively; and 𝑐𝑅𝑠 and 𝑐𝑅𝑏 are the surface and bulk concentration of rate limiting species in reduction reaction. According to the ECM process, 𝑐𝑅
𝑠
𝑐𝑅𝑏= 𝑐𝐹𝑒𝑠 𝑐𝐹𝑒𝑏 = 1
and so the equation is written as 𝑖𝑑𝑖𝑠 = 𝑖0[𝑐𝑂𝑠
𝑐𝑂𝑏exp ( 𝑛𝛼𝐹
𝑅𝑇 𝜂) − exp ( −𝑛𝛽𝐹
𝑅𝑇 𝜂)] (9)
Accordingly, determining 𝑐𝑂𝑠 𝑐𝑂𝑏
dissolution that is controlled by charge transfer is blocked. Thus, the transfer of free water molecules is the rate limiting step of the electrode reaction. Therefore, the concentration-dependent Butler-Volmer equation with the rate limited free water diffusion term is expressed as
𝑖𝑑𝑖𝑠 = 𝑖0[𝑐𝐻2𝑂
𝑠
𝑐𝐻2𝑂𝑏 exp ( 𝑛𝛼𝐹
𝑅𝑇 𝜂) − exp ( −𝑛𝛽𝐹
𝑅𝑇 𝜂)] (10)
where cHb2O represents the concentration of free water in the bulk electrolyte, which is taken as 19400 mol m−3 considering the hydration with Na+ and NO3− ions [31]. cHs2O is the surface concentration of free water, which is closely related to the concentration of metal ions, i.e., cHs2O =cHb2O− 6𝑐, according to the hydration structure ([Fe(H2O)6]3+) [18]. Additionally, F and R are the Faradaic constant
and gas constant, respectively. T is the temperature, which we set as 293.15 K. α and β are the reaction coefficients, which were both set to 0.5 in this work. The over-potential, η, can be calculated according to
𝜂 = 𝜑𝑠−𝜑𝑙 − 𝐸𝑒𝑞 (11)
[image:6.596.200.394.496.644.2]where φs and φl represent the anodic interfacial potential on the electrode and in the electrolyte, respectively. In the geometric model for studying parametric effects (Fig. 2(e)), the equilibrium potential Eeq was taken to be −0.037 V to correspond with iron being used, but this model can also be applied to other materials. In the geometric model for the effect of the material's microstructure (Fig. 2(f)), no detailed data was available for the equilibrium potentials for different microstructures unfortunately, because the required experimental measurements are extremely difficult to conduct. Therefore, to investigate the effect of the material's microstructure, Eeqα was set to −0.037 V, while Eeqβ was set to −0.062 V and −0.087 V, so that the difference of the equilibrium potentials between α and β, ΔEeq, would be 0.025 V and 0.05 V, respectively. Although these chosen equilibrium potentials are not experimental values, they are still beneficial for studying the effect of different microstructures on surface polishing in ECM.
Figure 3. Schematic illustration of the electrode reaction kinetics in ECM 2.5. Mass transfer
𝜕𝑐
𝜕𝑡+ ∇ ∙ 𝑁 = 0 (12)
𝑁 = −𝐷∇𝑐 −𝑧𝐹𝐷𝑐
𝑅𝑇 ∇𝜑 + 𝑣𝑐 (13)
where N is the total flux of the dissolved ions. It is known that the diffusion coefficient D is significantly influenced by the electrolyte concentration. In the literature [16-18], the concentration-dependent coefficient D is expressed according to
𝐷 = [𝐷0∙ exp(−11 × 10−4∙ 𝑐) + 10−11] (14)
where D0 is the reference diffusion coefficient, taken to be 1.2 × 10⁻⁹ m2 s−1. At the anodic
interface, metal atoms are continuously anodized to be ions, which can be expressed as, −𝐧 ∙ 𝑁 =𝑖𝑑𝑖𝑠
𝑛𝐹 (15)
where n is the unit normal vector on the anode.
2.6. Anodic shape evolution
The materials removal in ECM is realized by anodic dissolution of metal, which follows the Faraday’s law. Thus, the anodic shape moving rate is expressed as,
𝑣𝑎 = −𝜔𝑘𝑖𝑑𝑖𝑠 (16)
where ωk is the volumetric electrochemical equivalent, which was taken to be 2.4564 × 10⁻¹¹ m3
C−1 to correspond with iron.
2.7. Boundary conditions and parameters setting
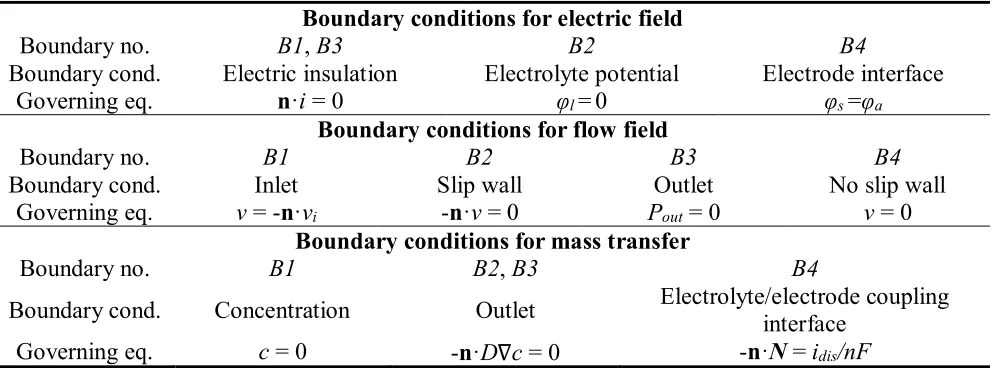
[image:7.596.52.550.587.771.2]Besides the governing equations mentioned above, we also applied boundary conditions (Table 1) that were in accordance with experimental results for the simulation. The main adjustable parameters in ECM are the applied potential and the flow speed, as shown in Table 2. Accordingly, their effects on surface polishing were investigated in this work. Other parameters used for the simulation were set to be constants.
Table 1. Boundary conditions for the multi-physics model
Boundary conditions for electric field
Boundary no. B1, B3 B2 B4
Boundary cond. Electric insulation Electrolyte potential Electrode interface
Governing eq. n·i = 0 φl = 0 φs =φa
Boundary conditions for flow field
Boundary no. B1 B2 B3 B4
Boundary cond. Inlet Slip wall Outlet No slip wall
Governing eq. v = -n·vi -n·v = 0 Pout = 0 v = 0
Boundary conditions for mass transfer
Boundary no. B1 B2, B3 B4
Boundary cond. Concentration Outlet Electrolyte/electrode coupling interface
Table 2. Investigated simulation parameters
Parameters Value
Applied potential (φa / V) 5, 11
Inlet flow speed (vi / m s-1) 4, 10
Equilibrium potential (Eeq / V) α-microstructure β-microstructure -0.037 -0.062, -0.087
2.8. Meshing validation
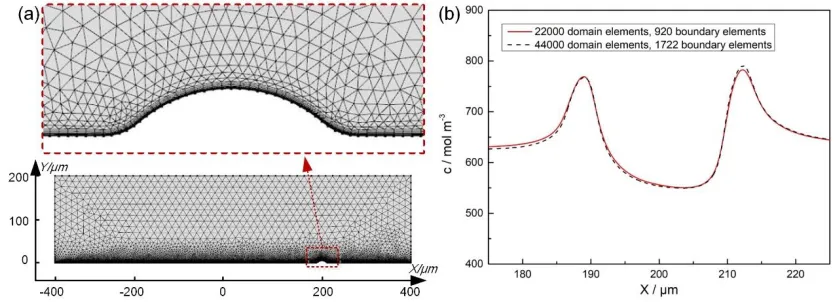
The geometric models were discretized into a computational mesh comprised of about 22000 domain elements and 920 boundary elements. In the geometric model for studying the parametric effects (Fig. 4(a)), for example, 8 layers of boundary layer mesh were used to precisely solve the involved multi-physics model with a flow field. The mesh was finest near the anodic surface and fine enough across the rest of the domain. To check the sensitivity of the simulated results to the mesh, a much finer mesh (44000 domain elements and 1722 boundary elements) was compared with the mesh developed in this work. Fig. 4(b) suggests that the simulated results are mesh independent (the difference was less than 1%), verifying the feasibility of the mesh used in this work. A MUItifrontal Massively Parallel Sparse direct Solver (referred to as MUMPS), and backward differentiation formula method were used for time stepping.
Figure 4. Geometric model meshing and validation. (a) Geometric model meshing; (b) mesh validation (φa=5 V, vi=4 m s-1, and t=100 ms).
3. RESULTS AND DISCUSSION 3.1. Preliminary investigation
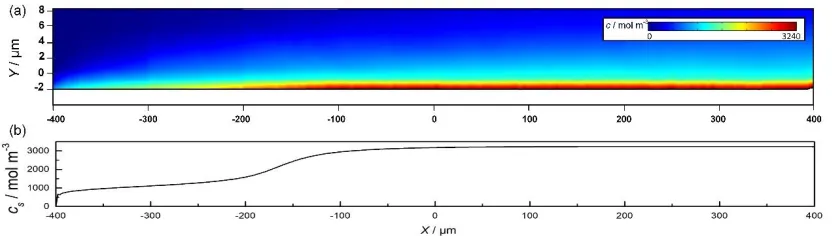
distribution of the ion concentration varies with the distance from the inlet. It is shown in Fig. 5(b) that the ion concentration on the anodic surface increases from −400 to 0 μm and then reaches a stable value of about 3240 mol m−3. This is caused by a gradual balance being reached between ion formation and
[image:9.596.92.508.207.325.2]transfer at the anodic surface. After sufficient development of the flow field from the inlet, the ion transfer rate stabilizes and thus a balance in the ion generation rate is achieved. Accordingly, it is reasonable to arrange the target geometric features of interest (Fig. 2) at X = 200 μm in this work.
Figure 5. Simulation results of the supersaturated film (φa = 11 V, vi = 4 m s−1, and t = 100 ms). (a) Ion
concentration near the anode and (b) distribution of interfacial ion concentration along the X axis.
As shown in Fig. 6, the ion concentration as a function of the distance from the anodic surface can be typically divided into three regions. In the region far from the anode (in the bulk electrolyte), the ion concentration is extremely low because the rapid electrolyte flow efficiently removes the dissolved ions. At the region relatively close to the anode, the flow speed quickly decreases in the flow boundary layer and so the ion convection effect is gradually weakened. Accordingly, the ion concentration gradually increases along with increasing distance from the bulk electrolyte to the anode. Additionally, the ion concentration in the region adjacent to the anode increases steeply from 1260 to 3240 mol m−3.
This region, which has a linear concentration gradient, is known as the anodic supersaturated film according to the Nernst diffusion layer model [32]. This model helps understand what the limiting current of the concentration-dependent Butler-Volmer equation is:
𝑖𝑙 = 𝑛𝐹𝐷(𝑐𝐹𝑒3+
𝑠 −𝑐
𝐹𝑒3+
𝑏 )
δ (17)
where il is the limiting current density and δ is the supersaturated film thickness. Accordingly, a supersaturated film thickness of 0.8 μm can be obtained through the intersection point between the extension line and the X axis [33], which is in accordance with the experimental data [23]. Furthermore, the average ion concentration of this simulated supersaturated film, 2250 mol m−3, correlates well with
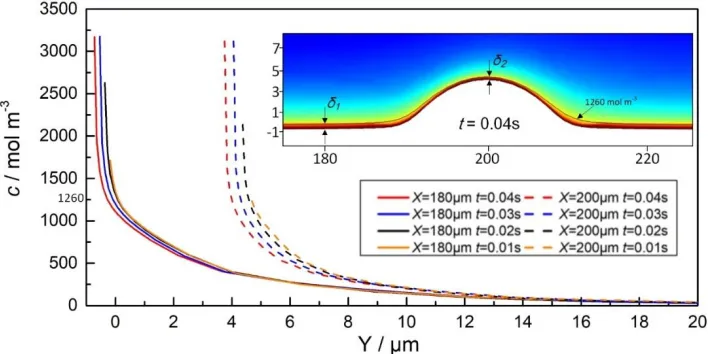
Figure 6. Ion concentration distribution along the Y axis at X = 200 μm (φa = 11 V, vi = 4 m s−1, and t =
100 ms).
The formation of the supersaturated film on the anodic surface is a transient process. The time-dependent change of the distribution of the ion concentration along the Y axis at 180 and 200 μm is shown in Fig. 7. In the first 10 ms, the ion concentration is low and the curve shows no linearly increasing section near the anode, indicating that the supersaturated film has not yet formed. When the time is increased from 20 to 30 ms, the ion concentration increases owing to the accumulation of dissolved ions. Further, the curves exhibit an obvious linear gradient, indicating the formation of the supersaturated film. Furthermore, the linearly increasing section expands over time, indicating that the film thickness is increasing. After 30 ms, the supersaturated film thickness stabilizes.
[image:10.596.144.452.72.226.2]Comparing the stable supersaturated film at 180 and 200 μm, it is observed that the film is thicker over the flat surface than at the protrusion. This is because the ion transfer at the protrusion is quicker because of a stronger convection effect nearby. Fluctuations in the film thickness will lead to different local current densities. According to Eq. (17), a larger limiting current density will form at the protrusion than at the flat surface, indicating a quicker dissolving rate at the protrusion. Accordingly, the whole anodic surface will be efficiently smoothed because of this effect.
[image:10.596.122.476.544.721.2]
3.2. Effect of applied potential
The applied potential is a key parameter that greatly influences the anodic behavior and consequently affects the machined surface roughness. Thus, in this work, we investigated the effect of the applied potential on surface polishing.
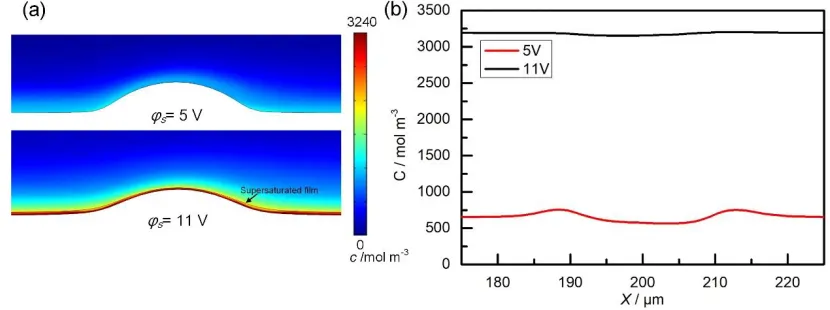
As shown in Fig. 8(a), a supersaturated film forms on the anodic surface when using 11 V, while for 5 V the anodic surface is exposed to fresh electrolyte (this condition is referred to as "active state"). This phenomenon has been found in previous research [35], where polarization curves showed a transition from charge transfer controlled behavior to mass transfer controlled behavior in ECM of Fe in NaNO3. A similar phenomenon has also been observed for many other metals. An in-situ study [24, 25]
of the anodic surface during ECM of Cu directly observed the existence of a supersaturated film under a high current density.
In our study, when the applied potential was increased, the current density also increased and consequently dissolution was enhanced. At 5 V, the formation rate from the metal ions was relatively low and the quick-flowing electrolyte could effectively transfer the generated ions close to the anodic interface into the bulk electrolyte, resulting in a relatively fresh electrolyte. At 11 V, however, large number of ions are generated at the anodic interface by the increased electric field and thus the ions could not be removed efficiently. Hence, the whole anodic surface was covered by a supersaturated film. We found that the thickness of this film was different above the flat surface and the protrusion. This phenomenon is related to the different electrolyte flow conditions at the flat surface and the protrusion. Compared with the flat surface, the ion transfer effect at the protrusion is more intense because of strong electrolyte flushing, consequently resulting in a thin film. The fluctuation of the film thickness results in a higher local current density at the protrusion than at the flat surface according to Eq. (17), which consequently helps to effectively smooth the surface.
Figure 8. Comparison of the distribution of the ion concentration at 5 and 11 V (vi = 4 m s−1 and t = 250
ms). (a) Ion concentration distribution near the protrusion. (b) Ion concentration on the anodic surface.
[image:11.596.89.504.504.659.2]
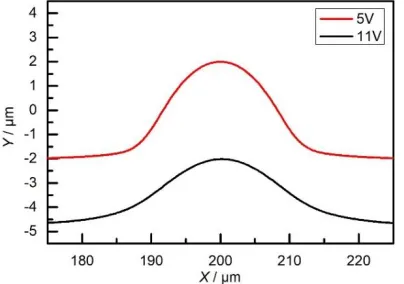
(originally 5 μm) was smoothed to 2.6 μm at 11 V, which is significantly lower than it was smoothed to for 5 V. Previous experiments [34, 35] have estimated the effect of different current densities on the fraction of anodic surface being smoothed during ECM. When the current density is increased while keeping the inlet electrolyte flow speed constant, the proportion of the surface that is brightened is increased; eventually, the entire surface is brightened owing to the formation of an anodic supersaturated film. This close agreement between the simulation and experiments confirms that a stronger surface polishing effect is achieved when using a higher potential, especially when a supersaturated film forms.
Figure 9. Machined anodic shape using 5 and 11 V (vi = 4 m s−1 and t = 250 ms).
3.3. Effect of electrolyte flow speed
An extremely quick electrolyte flow through a narrow inter-electrode gap is the main characteristic of ECM. In this work, different flow speeds of 4 and 10 m s−1 were used to study the flow
speed effect on the surface polishing process.
Figure 10 shows the distribution of the ion concentration using different inlet flow speeds. With 4 m s−1, the whole anodic surface was covered by a supersaturated film, while a relatively fresh surface
was obtained with 10 m s−1. This is because the ion transfer effect is closely related to the electrolyte
[image:12.596.200.402.224.366.2]
Figure 10. Comparison of the distribution of the ion concentration using flow speeds of 4 and 10 m s−1
(φa = 11 V and t = 250 ms). (a) Ion concentration distribution near the protrusion. (b) Ion concentration on the anodic surface.
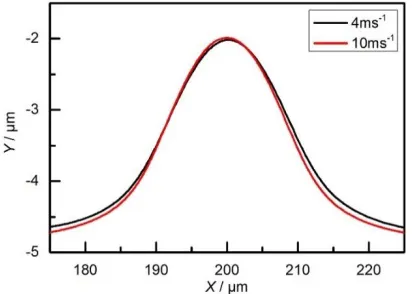
The machined anodic shapes using different flow speeds are both shown in Fig. 11 for comparison. The protrusion height for a flow speed of 4 m s−1 was reduced to 2.6 μm, which is lower
than for a flow speed of 10 m s−1. This is because the lower inlet flow speed helps form a supersaturated
[image:13.596.94.492.75.220.2]film, which is beneficial for surface polishing. A similar result was found in previous experiments [34, 35], in which the effect of the flow speed on the proportion of a surfaced that was brightened was estimated. When the flow speed was increased while maintaining the same current density, the polarization behavior shows an active state and a relatively rough surface is generated after ECM.
Figure 11. Machined anodic shape using flow speeds of 4 and 10 m s−1 (φs = 11 V and t = 250 ms).
3.4. Effect of the material's microstructure
[image:13.596.197.404.425.572.2]
Figure 12, panels (a)–(d) show the distribution of the ion concentration when using 5 and 11 V for different material microstructures. The ion concentration was relatively low when using 5 V, while the anodic surfaces with 11 V are covered by a supersaturated film. When viewing Fig. 12 panels (a)– (d) alongside panel (e), it can be observed that the distribution of the ion concentration on the β- and α-microstructure surfaces is uneven when 5 V was applied. This is caused by the combined effects of the active state and different electrochemical properties that cause selective corrosion. In the active state, the electrode kinetics are charge transfer controlled, which is closely aligned with the electrochemical properties of the nearby materials. Compared with the α-microstructure, the β-microstructure has a smaller equilibrium potential, which helps strengthen the dissolution and causes a higher ion concentration according to Eqs. (10) and (11). However, when an applied potential of 11 V was used, the anodic surface was covered by a uniform supersaturated film, which had a uniform ion concentration on both the α- and β-microstructure anodic surfaces. This is because the higher applied potential enhances the dissolution reaction and generates a massive number of ions that cannot be immediately transferred into the bulk electrolyte, as discussed in Section 3.2. In-situ experimental observations on polycrystalline anodic surfaces during ECM [23, 24, 25, 28] also confirm that uniform supersaturated films form under high current densities. The dissolution kinetics then become mass transfer controlled. The dissolution rate is solely determined by ion transfer in the supersaturated film. Consequently, it is predicted that surface topograghy is less influenced by the material microstructures under high current density.
Figure 12. Comparison of the ion concentration distribution using applied voltages of 5 and 11 V for different microstructures (vi = 4 m s−1 and t = 250 ms). (a) Applied potential of 5 V and ΔEeq of
[image:14.596.123.476.409.681.2][image:15.596.197.401.322.478.2]
The resulting anodic shapes when using 5 and 11 V for different microstructures are shown in Fig. 13. A smooth surface was generated when using 11 V, while selective corrosion occurred when using 5 V, causing a rough surface. Further, it was also observed that for an active corrosion state, the generated surface roughness increased when the equilibrium potential difference increased. According to Eqs. (10) and (11), a larger equilibrium potential difference causes a greater difference in the dissolution current density, resulting in a greater difference of the dissolution rates for the different microstructures. Accordingly, more serious selective corrosion occurs and the surface roughness increases. Previous experiments [23, 24, 25, 28] showed that compared with an initial mechanically polished surface, the surface roughness achieved using ECM under low current density increased owing to selective corrosion, while a high surface finish was achieved under high current density. Consequently, the simulation outcomes match the experimental results well, which confirms that the transition of both the kinetic and surface smoothing is associated with an increase of the current density for polycrystalline materials.
Figure 13. Comparison of the anode shape using 5 and 11 V for different microstructures (vi = 4 m s−1
and t = 250 ms).
4. CONCLUSIONS
This paper reports the development of a novel multi-physics model to numerically study the surface polishing mechanism in ECM. According to the simulation results, a supersaturated film forms when a sufficiently high potential is used. The formation of the supersaturated film is a transient process.
The applied potential has a significant effect on the formation of the supersaturated film and on surface polishing. When the applied potential is increased, the ion concentration increases until the formation of a supersaturated film that enhances surface polishing in ECM. Compared with the value of the applied potential, the effect of the inlet flow speed is relatively weak. When the flow speed was increased, the polishing effect was only slightly reduced.
selective corrosion. Further, when the equilibrium potential difference was increased, the generated surface roughness also increased. However, when using a sufficiently high potential during ECM, a supersaturated film ends up covering the anodic surface, resulting in a smooth surface finish.
ACKNOWLEDGEMENTS
The authors gratefully acknowledge the financial and technological support from the National Natural Science Foundation of China (NNSFC) (Grant Nos. 51575383 and 51405335) and the Science and Technology Plan Project of Guangdong Province (Grant No. 2013B090600149).
References
1. J.F. Wilson, Practice and Theory of Electrochemical Machining 2nd ed, John Wiley & Sons Inc., (1971) New York, US.
2. J. Bannard, J. Appl. Electrochem., 7 (1977) 1.
3. K.P. Rajurkar, D. Zhu, J.A. McGeough, J. Kozak and A. DeSilva, CIRP Annals, 48 (1999) 567. 4. K.P. Rajurkar, M.M. Sundaram and A.P. Malshe, Procedia CIRP, 6 (2013) 13.
5. S. Hinduja and M. Kunieda, CIRP Annals-Manufacturing Technology, 62 (2013) 775. 6. H. Tipton, Proc. 5th Int. MTDR, (1964) 509.
7. V.K. Jain and P.C. Pandey, Precis. Eng., 2 (1980) 195.
8. D.E. Collet, R.C. Hewson-Browne and D.W. Windle, J. Eng. Math., 4 (1970) 29.
9. G.M. Alder, D. Clifton and F. Mill, Proceedings of the Institution of Mechanical Engineers Part B: Journal of Engineering Manufacture, 214 (2000) 745.
10. J. Kozak, J. Mater. Processing Tech., 76 (1998) 170. 11. J. Kozak, J. Mater. Processing Tech., 109 (2001) 354. 12. V.K. Jain and P.C. Pandey, Precis. Eng., 2 (1980) 23.
13. R. Alkire, T. Bergh and R.L. Sani, J. Electrochem. Soc., 125 (1978) 1981. 14. S. Christiansen and J. Rasmussen, J. I. Math. Appl., 18 (1976) 295.
15. O.H. Narayanan, S. Hinduja and C.F. Noble, Int. J. Mach. Tool Des. and Res., 26 (1986) 323. 16. D. Deconinck, S. Van Damme and J. Deconinck, Electrochim. Acta, 60 (2012) 321.
17. D. Deconinck, S. Van Damme and J. Deconinck, Electrochim. Acta, 69 (2012) 120. 18. D. Deconinck, W. Hoogsteen and J. Deconinck, Electrochim. Acta, 103 (2013) 161. 19. [M.M. Lohrengel, K.P. Rataj and T. Munninghoff, Electrochim. Acta, 201 (2016) 348.
20. M. Schneider and M.M. Lohrengel, Springer Handbook of Electrochemical Energy, Springer, (2017) Berlin, Germany.
21. M.M. Lohrengel, I. Klüppel, C. Rosenkranz, H. Bettermann and J.W. Schultze, Electrochim. Acta, 48 (2003) 3203.
22. M.M. Lohrengel and C. Rosenkranz, Corr. Sci., 47 (2005) 785.
23. C. Rosenkranz, M.M. Lohrengel and J.W. Schultze, Electrochim. Acta, 50 (2005) 2009.
24. M. Schneider, S. Schroth, S. Richter, S. Hohn, N. Schubert and A. Michaelis, Electrochim. Acta, 56 (2011) 7628.
25. M. Schneider, S. Schroth, S. Richter, S. Hohn, N. Schubert and A. Michaelis, Electrochim. Acta, 70 (2012) 76.
26. M. Schneider, S. Schroth, S. Richter, S. Hohn and A. Michaelis, Electrochim. Acta, 106 (2013) 279.
27. F. Klocke, S. Harst, M. Zeis and A. Klink, Procedia CIRP, 68 (2018) 505.
29. O. Weber, M. Weinmann, H. Natter and D. Baühre, J. Appl. Electrochem., 45 (2015) 591. 30. D. Landolt, Electrochim. Acta, 32 (1986) 1.
31. J.B. Peng, D.Y. Cao, Z.L. He, J. Guo, P. Hapala, R. Ma, B.W Cheng, J. Chen, W. J. X, X.Z. Li, P. Jelínek, L.M. Xu, Y.Q. Gao, E.G. Wang and Y. Jiang, Nature, 557 (2018) 701.
32. P. Delahay, C.W. Tobias and J.J. Lander, J. Electrochem. Soc., 111 (1964) 33. 33. C. Wagner, J. Electrochem. Soc., 101 (1954) 225–228.
34. M. Datta and D. Landolt, Electrochim. Acta, 25 (1980) 1255. 35. M. Datta and D. Landolt, Electrochim. Acta, 25 (1980) 1243.