Int. J. Electrochem. Sci., 14 (2019) 3350 – 3362, doi: 10.20964/2019.04.38
International Journal of
ELECTROCHEMICAL
SCIENCE
www.electrochemsci.org
Potentiometeric Study of New Schiff Base Complexes Bearing
Morpholine in Ethanol-water Medium with some Metal Ions
Badriah. S. Al-Farhan1,*, Gamal. A. Gouda2, O. A. Farghaly2 and A.K. EL Khalafawy1
1 Chemistry Department, Faculty of Girls for Science, King Khalid University, Abha, King Saudi
Arabia, KSA.
2 Chemistry Department, Faculty of Science, Al-Azhar University, Assiut Branch, 71524, Assiut,
Egypt.
*E-mail: [email protected]
Received: 14 December 2018 / Accepted: 24 January 2019 / Published: 10 March 2019
Acid dissociation constants of 2-[(4-morpholinobenzylidene)amino]phenol (HL) and the equilibrium constants of their metal complexes with Cu2+, Zn2+, Sr2+, Cd2+, Ba2+ and Hg2+ ions were investigated using a pH metric titration technique in 40 % (v/v) ethanol-water medium and µ = 0.5 M NaClO4. Τhe
dissociation constants (pKa) of HL ligand and the stability constants of the respective complexes (log
Ki) were calculated at 298, 308 and 318 K. The values of dissociation constants (pKOH and pKNH) of
monoprotic HL were found as 10.36 and 2.95, respectively. The formation constants of the complexes increase in the arrangement of Sr2+ < Zn2+ < Cd2+ < Hg2+ < Ba2+ < Cu2+ ions. The thermodynamic functions for the protonation and the deprotonation process of HL and their metal complex equilibria are derived and discussed. The formation metal complexes of Cu2+, Zn2+, Sr2+, Cd2+, Ba2+ and Hg2+ h as been found to be endothermic and spontaneous processed. Furthermore, the geometric parameters of the metal-HL complexes were studied according to the density functional theory (DFT) method.
Keywords: pH-Metric, stability constants, thermodynamic, theoretical studies.
1. INTRODUCTION
the greatest binding power of nitrogen and oxygen ligands of any of the metal ions [13]. A survey of the literature shows no research on Schiff base, including 4-morpholinobenzaldehyde and phenolic group in the same compound, but there are many works concerning derivatives of Schiff base ligands including various functional groups [14-18].
The objective of the present study, determine the protonation and deprotonation constants of 2-[(4-morpholinobenzylidene)amino]phenol and the equilibrium constants of their Cu2+, Zn2+, Sr2+, Cd2+, Ba2+ and Hg2+ ions by the potentiometric titration method, employing ethanol-water medium in ionic strength of 0.5 M NaClO4. In addition, the thermodynamic functions and the geometric parameters of
the equilibrium constants of metal-ligand complexes are derived and discussed.
2. EXPERIMENTAL
2.1. Apparatus and measuring techniques
Generally, chemicals and samples used in the present work are weighed by Sartorius balance. All pH measurements are carried out using Misura Line 1010 pH meter (Romania) equipped with a combined porolyte electrode. All samples are stirred and heated by multiple Heating Magnetic Stirrer (VELP Scientifica) during experimental procedures as well as micropipette (100-1000 µL) is also used. The Fourier transform infrared (FT-IR) were recorded in the 4000-400 cm–1 region with a Shimadzu Spectrophotometer, model Nicolet 6700, using the KBr disc technique. Elementar Analysen system Gmbh Vario El analyzer was used for estimating the carbon, hydrogen and nitrogen contents of the solid ligand. The proton nuclear magnetic resonance (1H NMR) was determined by a Varian EM390 spectrophotometer. The mass spectra were performed by JOEL JMS600 Spectrometer (70 eV) using the direct inlet system.
2.2. Preparation of 2-[(4-morpholinobenzylidene)amino]phenol
A novel Schiff base, 2-[(4-morpholinobenzylidene)amino]phenol was prepared by refluxing a mixture of 4-morpholinobenzaldehyde (0.01 M) and 2-aminophenol (0.01 M) in ethanol (30 mL) with a small amount of acetic acid as a catalyst for 1 hour (Scheme 1). The solid precipitate obtained was collected by the filtration and recrystallized from methanol as yellow crystals; yield 89 % and mp. 247 oC.
The molecular structure of the formed Schiff base (C17H18N2O2) was established by the analytical
data (Calcd. (%): C 72.32, H 6.43, N 9.92 and found (%): C 72.29, H 6.44, N 9.95). FT-IR of the HL showed the absorption bands at 3394, 2855 and 1622 cm–1, due to –OH, CH–aliphatic and –C=N– groups, respectively (Figure 1). 1H NMR spectrum (CDCl3) of HL revealed the appearance of protons at
δ (ppm) = 3.20 [m, 4H, N(CH2)2], 3.80 [m, 4H, O(CH2)2], 6.57-7.90 (m, 8H, Ar-H), 8.41 (s, 1H, CH=N)
and 8.62 (s, 1H, OH; exchangeable with D2O. The fragmentation pattern of HL is characterized by the
appearance of the following fragments with various relative intensities (Figure 2), Ms: m/z = 64 (14.41 %), 281 (62 %), 282 (100 %), 283 (20 %) and 284 (2.09 %) [M+2].
[image:3.596.107.488.220.747.2]
Figure 1. FT-IR spectrum of the HL.
[image:3.596.119.475.226.453.2]
2.3. Potentiometric measurements
Solutions of 2×10⁻⁴ Mmetal chlorides have been prepared (Merck, BDH or UK) and standardized by EDTA [20]. The following mixtures were prepared and titrated against 0.2 M NaOH in µ = 0.5 M NaClO4 [21]. The following titrations were carried out: (i) 5 mL of HClO4 + 5 mL NaClO4, (ii) solution
(i) + 5 mL of the HL under investigation (1×10⁻³ M) and (iii) solution (ii) + 10 mL (2×10⁻⁴ M) of metal
solution. For each mixture, the volume was made up to 50 mL with 40 % ethanol-water medium before the titration and the titrations were repeated at 25, 35 and 45 oC.
2.4. Quantum chemical calculations
The quantum chemical calculations were performed using the Gaussian09 program package [22, 23]. The geometric parameters of molecular structures of metal complexes were optimized by the density functional theory (DFT) method using (B3LYP), the 6-311G (d, p) basis set [24-26]. In the case of 3d-metal complexes, the DFT method gives rather accurate relative energy stabilities of the high-spin state relative to the low-spin state and reliably characterizes the key geometric parameters of molecular structures of metal complexes [27, 28]. The quantum chemical parameters such as the highest occupied molecular orbital EHomo, the lowest unoccupied molecular orbital ELumo, the energy gap EGAP, the global
hardness η and the softness σ were calculated by the following equations [29, 30]: EGAP = EHomo – ELumo (1)
η = – EGAP/2 (2)
σ = 1/ η (3)
3. RESULTS AND DISCUSSION
Acid dissociation and the formation constants of the HL with Cu2+, Zn2+, Sr2+, Cd2+, Ba2+ and
Hg2+ ions were determined by half integral method of Calvin and Bjerrum as adopted by Irving and Rossotti [31, 32]. The titration is usually carried out at a higher ionic strength than the metal salt concentration. Potentiometric titrations of the HL and their metal ion complexes with 0.2 MNaOH at 25±1 °C are given in Figure 3. The data obtained from metal-HL titrations have been evaluated using computational methods (Excel) [33, 34].
0 2 4 6 8 10 12
1 2 3 4 5
pH
mL added of NaOH b
c
d
e
f
g
[image:5.596.54.528.77.398.2]h a
Figure 3. Potentiometric titration curves of HL: (a) HClO4, (b) HClO4 with HL, HClO4 with HL and (c)
Cu2+, (d) Hg2+, (e) Cd2+, (f) Zn2+, (g) Ba2+ and (h) Sr2+ complexes at 25±1 °C in µ = 0.5 M NaClO4.
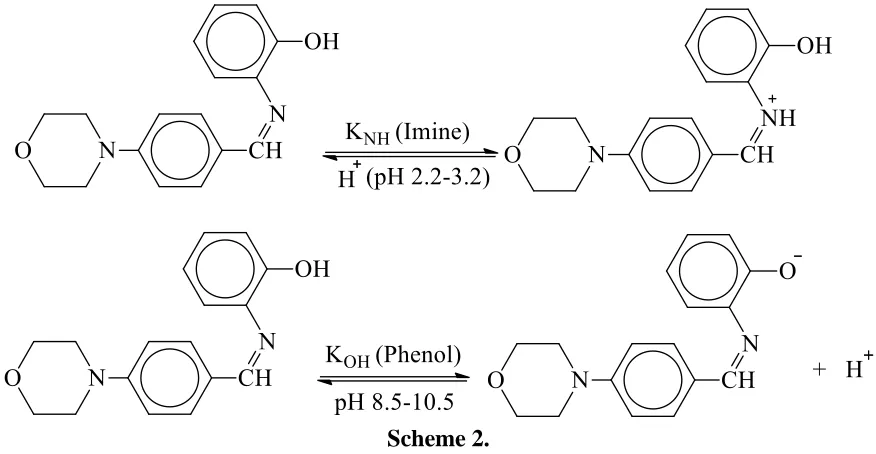
The potentiometric titration curves show different trends (Figure 3), the titration curve of the HL solution shift to lower pH value in comparison to the free acid solution curve (a), indicating that the releasing of a proton from HL. The phenolic group is known to be weakly acidic, indicating strong bonding between the proton and the oxygen donor [35]. In the present study, the HL is monoprotic ligand and has an OH-phenolic group, so it can donate a proton and became an anion. The value of pKOH is found to be 10.36 at 25±1 oC, and it is clear that the HL is of lower acidic character [36].The other protonation of the HL is assigned as the azomethine nitrogen (log KNH = 2.95). The protonation constant
value of the azomethine nitrogen is smaller due to the interamolecular hydrogen bonding between the phenolate oxygen and the nitrogen atom of the azomethine group [37-39]. The protonation and deprotonation equilibria reaction steps of the Schiff base are shown in Scheme 2.
Scheme 2.
[image:6.596.79.517.70.297.2]In addition, the presence of metal ions indicates that the addition of these ions to the HL solution shifted to lower pH values and the horizontal displacement of the curves. The observed decrease in the curves of Cu2+, Zn2+, Sr2+, Cd2+, Ba2+ and Hg2+ species in comparison to the free HL solution curve reveal that the titration curves are going to produce the complexes. The formation constants of the compounds increase in the orders of Sr2+ < Zn2+ < Cd2+ < Hg2+ < Ba2+ < Cu2+ for metal-HL systems. A comparison of stability constant of the Cu2+-HL system with these 1:1 and 1:2 molar ratios, the values were as 9.24 and 8.83, respectively indicates that the phenolic group (–OH) in the ligand plays an important role in the stability of mononuclear complex formation [40]. The greater stability of Cu2+-HL complexes is due to Jahn-Teller distortion [41].
Table 1. The dissociation constants of HL and formation constants of their complexes with Cu2+, Zn2+, Sr2+, Cd2+, Ba2+ and Hg2+ ions at a various temperature*
Species 298 K 308 K 318 K
log K1 log K2 log K1 log K2 log K1 log K2
H+ 10.36 2.95 10.27 2.72 10.21 2.57
Cu+2 9.24 8.83 9.02 8.70 8.35 7.64
Zn+2 7.95 7.52 7.74 7.40 7.34 7.12
Sr2+ 8.21 4.77 7.85 4.35 7.51 4.01
Cd+2 8.65 7.90 8.12 7.85 7.76 7.47
Ba2+ 9.12 8.66 8.82 8.32 8.59 8.02
Hg+2 9.10 8.47 8.60 8.29 8.03 7.54
*The values given present an average of three measurements.
constants of their Cu2+, Zn2+, Sr2+, Cd2+ Ba2+ and Hg2+ complexes calculated in the present study are agreeing with many works reported in the literature [45, 46]. The obtained values were illustrated in Table 1.
3.1. The distribution diagrams
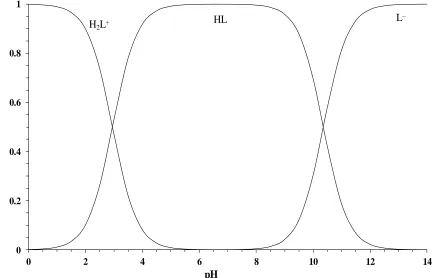
Distribution curves of the some metal-HL complexes (Figures 4 and 5) can be performed by means of common computer programs [47]. As seen in Figure 4, with increasing pH the concentration of HL decreases and the deprotonated species L– starts at pH 8.2 to form and reaches a maximum concentration of 99 % at pH 12.
0 0.2 0.4 0.6 0.8 1
0 2 4 6 8 10 12 14
pH
H2L+
L–
HL
S
p
e
c
ie
s
(%
[image:7.596.69.502.262.540.2])
Figure 4. Distribution diagram of the various forms of HL at 25±1 °C.
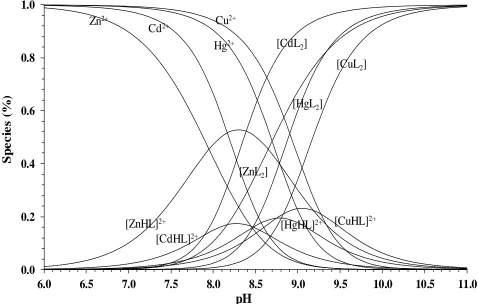
In the metal-HL systems, the complexes are not observed until pH 6.2 (Figure 5). Tow species of Zn2+-HL system have been identified in the pH range 6.2-10.5, the first at pH 6.2 formation of [ZnHL]2+ is observed and this is the major species in solution at pH 8.3 (52.30 %). The second complex [ZnL2] is observed at pH 7.5 and constitutes > 90 % of the species present. The intermediate complex
species for Cu2+, Cd2+ and Hg2+ ions are [CuHL]2+, [CdHL]2+ and [HgHL]2+ respectively. The maximum output value is about 23.0 %, except for [CuHL]2+ (pH 9.0), 17.2 %, except for [CdHL]2+ (pH 8.2) and 19.5 %, except for [HgHL]2+ (pH 8.8). Although [CuL2], [CdL2] and [HgL2] complexes are formed after
pH 7.5. The complexes formulated as [MHL]2+ and [ML2] (where M = Cu2+, Zn2+, Sr2+, Cd2+, Ba2+ or
0.0 0.2 0.4 0.6 0.8 1.0
6.0 6.5 7.0 7.5 8.0 8.5 9.0 9.5 10.0 10.5 11.0
S
p
e
c
ie
s
(%
)
<
pH
Zn2+
Cd2+
Hg2+ Cu2+
[ZnHL]2+
[ZnL2]
[CdHL]2+
[CdL2]
[HgHL]2+ [HgL2]
[CuHL]2+ [CuL2]
[image:8.596.60.538.74.378.2]
Figure 5. Distribution diagram of the various forms for the metal-HL systems formed as a function of pH. All the reactants 1×10⁻³ M in concentration at 25±1 °C. Percentages are calculated with respect to the analytical concentration of metal ion.
Scheme 3.
3.2. Determination of the enthalpy, free energy and entropy changes to the equilibrium constants
values are calculated by drawing a relationship between the 1/T and the log Ki. In addition, the ∆G and
∆H values one can deduce the ∆S using the following relationships (4, 5):
∆G = ∆H – T ∆S (4)
logKi = (–∆H) / (2.303 R) + 1/T × ∆S / (2.303 R) (5)
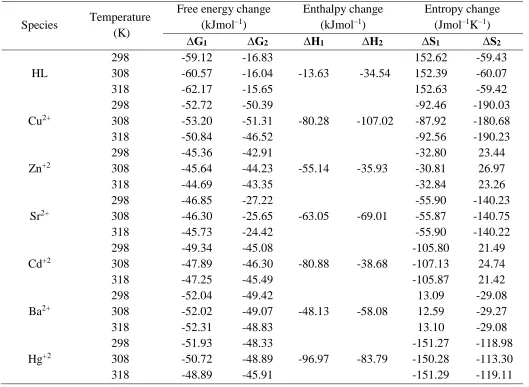
[image:9.596.36.565.385.772.2]The kinetic parameters of the metal-HL species have been calculated at 298, 308 and 318 K (Table 2). In general, the formation of metal-HL complexes requires the breaking of an M–O bond (hydrate water) and the formation of an M–N (azomethine) and M–O (O–phenolic) bonds; since this process is exothermic (∆H negative), the enthalpy term will always contribute in a favourable way to the complex formation. On the other hand, the negative values of the ∆G indicate that the process is spontaneous [48]. The formation of the first complex in Ba2+:HL system (1:1) and second complex in Cd2+:HL (1:2) are characterized by a positive entropy term. This term is larger, the more stable the complex. This is due to an extensive liberation of water molecules. This process becomes less pronounced in the following steps and the entropy of formation of therefore diminishes until it finally becomes negative [49, 50].
Table 2. The corresponding thermodynamic parameters of metal-HL species at various temperature
Species Temperature (K)
Free energy change (kJmol–1)
Enthalpy change (kJmol–1)
Entropy change (Jmol–1K–1)
∆G1 ∆G2 ∆H1 ∆H2 ∆S1 ∆S2
HL 298 308 318 -59.12 -60.57 -62.17 -16.83 -16.04 -15.65
-13.63 -34.54
152.62 152.39 152.63 -59.43 -60.07 -59.42 Cu2+ 298 308 318 -52.72 -53.20 -50.84 -50.39 -51.31 -46.52
-80.28 -107.02
-92.46 -87.92 -92.56 -190.03 -180.68 -190.23 Zn+2 298 308 318 -45.36 -45.64 -44.69 -42.91 -44.23 -43.35
-55.14 -35.93
-32.80 -30.81 -32.84 23.44 26.97 23.26 Sr2+ 298 308 318 -46.85 -46.30 -45.73 -27.22 -25.65 -24.42
-63.05 -69.01
-55.90 -55.87 -55.90 -140.23 -140.75 -140.22 Cd+2 298 308 318 -49.34 -47.89 -47.25 -45.08 -46.30 -45.49
-80.88 -38.68
-105.80 -107.13 -105.87 21.49 24.74 21.42 Ba2+ 298 308 318 -52.04 -52.02 -52.31 -49.42 -49.07 -48.83
-48.13 -58.08
13.09 12.59 13.10 -29.08 -29.27 -29.08 Hg+2 298 308 318 -51.93 -50.72 -48.89 -48.33 -48.89 -45.91
-96.97 -83.79
3.3. Theoretical chemical calculations
The electronic structure relevant to low spin (ELumo), high spin (EHOMO) transitions, energy gap
(EGAP = EHomo – ELumo), hardness (η = – EGAP/2) and softness (σ = 1/ η) of the metal-ligand complexes
[image:10.596.91.508.211.440.2]were calculated according to method is described in detail elsewhere [51-53]. The results of quantum chemical calculations for the complexes considered are given in Table 3.
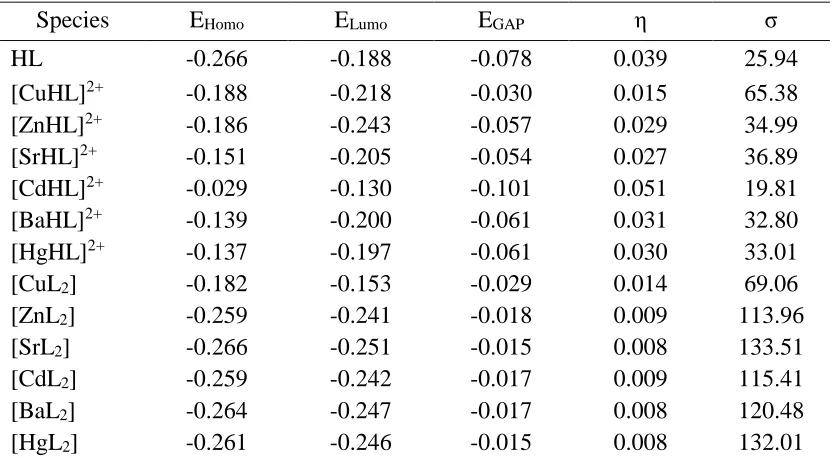
Table 3. Calculated EHomo and ELumo and EGAP, hardness (η) in eV and softness (σ) in eV-1 for the HL
and their metal complexes
Species EHomo ELumo EGAP η σ
HL -0.266 -0.188 -0.078 0.039 25.94
[CuHL]2+ -0.188 -0.218 -0.030 0.015 65.38
[ZnHL]2+ -0.186 -0.243 -0.057 0.029 34.99
[SrHL]2+ -0.151 -0.205 -0.054 0.027 36.89
[CdHL]2+ -0.029 -0.130 -0.101 0.051 19.81
[BaHL]2+ -0.139 -0.200 -0.061 0.031 32.80
[HgHL]2+ -0.137 -0.197 -0.061 0.030 33.01
[CuL2] -0.182 -0.153 -0.029 0.014 69.06
[ZnL2] -0.259 -0.241 -0.018 0.009 113.96
[SrL2] -0.266 -0.251 -0.015 0.008 133.51
[CdL2] -0.259 -0.242 -0.017 0.009 115.41
[BaL2] -0.264 -0.247 -0.017 0.008 120.48
[HgL2] -0.261 -0.246 -0.015 0.008 132.01
The binding ability of the metal to the ligand increases with increasing energy gap (EGAP) values
[54, 55]. The energy gap (EGAP) is an important stability index [56]. As displayed in Table 3, the ligand
has the highest EHomo level at -0.266 eV and the lowest ELumo level at -0.188 eV. The calculated EGAP for
the ligand (-0.077 eV) is higher than of the complexes. This calculation is consistent with the similar complexes [57]. The values of hardness are smaller, indicates that the complexes, higher reactivity, which means that a molecule with a small energy gap (EHono – ELumo) is more reactive and is a softer
molecule [58, 59]. It is found that all the metal:ligand complexes are soft in nature and increased the ligand molecules minimize the η of the complexes. This indicates the ligand molecule could be of soft condensed substance [60]. The highest occupied molecular orbital (Homo) and the lowest unoccupied molecular orbital (Lumo) of ligand and Cu2+:ligand system (1:1) were shown in Figures 6 and 7. As
shown in Figure 6, the Homo is mainly localized on double bonds, whereas, Lumo is generally localized on single bonds. For the [CuHL]2+ system (Fig. 7), the Homo is mainly localized around the copper
[image:11.596.62.538.75.233.2]
Figure 6. Calculated high spin (Homo)and low spin (Lumo) molecular orbitals of the HL using the B3LYP/6-311++G(d,p) method.
Figure 7. Calculated high spin (Homo)and low spin (Lumo) molecular orbitals of the [CuHL]2+ system using the B3LYP/6-311++G(d,p) method.
4. CONCLUSION
A novel Schiff base, 2-[(4-morpholinobenzylidene)amino]phenol was established by the analytical data, infrared, 1H NMR and mass spectral data. Acid dissociation and the stability constants of Cu2+, Zn2+, Sr2+, Cd2+ Ba2+ and Hg2+ ions with 2-[(4-morpholinobenzylidene)amino]phenol were investigated potentiometrically in ethanol-water medium at ionic strength of 0.5 M NaClO4. The
the ligand is higher than of the complexes. All the metal:ligand complexes are soft in nature and increased the ligand molecules minimize the η of the complexes. This indicates the ligand molecule could be of soft condensed substance.
References
1. Q. Yang, L. G. Ulysse, M. D. McLaws, D. K. Keefe, B. P. Haney, C. Zha, P. R. Guzzo and S. Liu, Res. Dev., 16 (2012) 499–506.
2. C. T. Goralski, D. L. Hasha, B. Singaram and D. Steiner, Org. Process Res. Dev., 11 (2007) 776– 779.
3. D. Bhattarai, S. H. Lee, S. H. Seo, G. Nam, S. B. Kang, A. N. Pae, E. E. Kim, T. Oh, S. N. Cho and G. Keum, Chem. Biol. Drug Des., 80 (2012) 388–397.
4. H. Turkmen, M. Durgun, S. Yilmaztekin, M. Emul, A. Innocenti, D. Vullo, A. Scozzafava and C. T. Supuran, Bioorg. Med. Chem. Lett., 15 (2005) 367–372.
5. S. Sangthong, K. Krusong, N. Nagmrojanavanich, T. Vilaivan, S. Puthong, S. Chandchawan and N. Muangsin, Bioorg. Med. Chem. Lett., 21 (2011) 4813–4818.
6. S. D. Ramgren, A. L. Silberstein, Y. Yange and N. K. Garg, Angew. Chem. Int. Ed., 50 (2011) 2171–2173.
7. K. H. Choi, V. Lai, C. E. Foster, A. J. Morris, D. R. Tolan and K. N. Allen, Biochem., 45, (2006) 8546–8555.
8. A. Golcu, M. Tumer, H. Demirelli and R. A. Wheatley, Inorg. Chim. Acta, 358 (2005) 1785–1797. 9. R. W. Y. Sun and C. M. Che, Coord. Chem. Rev., 253 (2009) 1682–1691
10.S. A. M. Fathi, M. Parinejad and M. R. Yaftian, Sep. Purif. Technol., 64 (2008) 1–7. 11.V. K. Gupta, R. N. Goyal and R. A. Sharma, Talanta, 78 (2009) 484–490.
12.M. Yoshikawa, Y. Mori, M. Tanigaki and W. Eguchi, Bull. Chem. Soc. Jpn., 63 (1990) 304–306. 13.P. Brooks and N. Davidson, J. Am. Chem. Soc., 82 (1960) 2118–2123.
14.M. S. El-Shahawi, M. S. Al-Jahdali, A. S. Bashammakh, A. A. Al-Sibaai and H. M. Nassef, Spectrochim. Acta A, 113 (2013) 459–465.
15.K. Dhahagani, S. M. Kumar, G. Chakkaravarthi, K. Anitha, J. Rajesh, A. Ramu and G. Rajagopal, Spectrochemi. Acta Part A: Mol. Biomol. Spect., 117 (2014) 87–94.
16.H. Bayrak, A. Demirbas, S. A. Karaoglu and N. Demirbas, Eur. J. Med. Chem., 44 (2009) 1057– 1066.
17.R. G. Brown and J. Alan, J. Chem. Soc., Perkin Trans.1, 0 (1987) 547–551.
18.N. Raman, A. Kulandaisamy, A. Shunmugasundaram and K. Jeyasubramanian, Trans. Met. Chem., 26 (2001) 131–135.
19.A. A. S. Al-Hamdani, A. M. Balkhi, A. Falah and S. A. Shaker, J. Chil. Chem., Soc., 60 (2015) 2774–2785.
20.A. Y. Rajhi, Y. H. Ju, A. E. Angkawijaya and A. E. Fazary, J. Soln. Chem., 42 (2013) 2409–2442. 21.H. Sigel, S. S. Massoud and N. A. Corfu, J. Am. Chem. Soc., 116 (1994) 2958–2971.
22.M. J. Frisch G. W. Trucks, H. B. Schlegel, G. E. Scuseria, M. A. Robb, J. R. Cheeseman and D. J. Fox ., Gaussian, 09, Revision A.01 (Gaussian, Wallingford CT, 2009).
23.H. Paulsen, L. Duelund, H. Winkler, H. Toftlund and A. X. Trautwein, Inorg. Chem., 40 (2001) 2201–2203.
24.M. N. Glukhovtsev, A. Pross, M. P. McGrath and L. Radom, J. Chem. Phys., 103 (1995) 1878– 1885.
25.O. V. Mikhailov and D. V. Chachkov, Russ. J. Inorg. Chem., 62 (2017) 1191–1196.
28.M. Swart, Inorg. Chim. Acta, 360 (2007) 179–189.
29.P. Geerlings, F. De Proft and W. Langenaeker, Chem. Rev., 103 (2003) 1793–1874.
30.N. Helal, M. El-Rabiee, G. Abd El-Hafez and W. Badawy, J. Alloys Compounds, 456 (2008) 372– 378.
31.J. Bjerrum, Metal amine formation in aqueous solution. P. Masse and Sons: Copenhagen, Denmark (1941).
32.H. M. Irving and H. S. Rossotti, J. Chem. Soc., (1954) 2904–2910.
33.B. S. Al–Farhan, A. H. Naggar and O. A. Farghaly, Int. J. Electrochem. Sci., 13 (2018) 8275–8294. 34.A. Sabatini, A. Vacca and P. Gans, Coord. Chem. Rev., 120 (1992) 389–405.
35.L. J. Bellamy, K. J. Morgan and R. J. Pace, Spectrochim. Acta, 22 (1966) 535–545.
36.R. N. Patel, S. Nripendra, R. P. Shrivastava, K. K. Shukla and P. K. Singh, J. Chem. Sci., 114 (2002) 115–124.
37.A. Filarowski, J. Phys. Org. Chem., 18 (2005), 686–698.
38.K. A. Krystyna, D. F. Angela, A. Adolfo and N. B. Kevin, Inorg. Chimica Acta, 358 (2005) 3497– 3505.
39.A. M. A. Alaghaz, and H. A. Bayoumi, Int. J. Electrochem. Sci., 8 (2013) 11860–11876. 40.S. Thakurta, R. J. Butcher, A. Frontera and S. Mitra, J. Coord. Chem., 70 (2017) 3715–3726. 41.I. Persson, Pure Appl. Chem., 82 (2010) 1901–1917.
42.W. M. Hosny and P. A. Khalaf-Alaa, Int. J. Electrochem. Sci., 8 (2013) 1520–1533. 43.A. A. Shoukry and M. M. Shoukry, Spectrochim. Acta A, 70 (2008) 686–691. 44.A. M. Hassanein, Polish J. Chem., 74 (2000) 903–907.
45.M. A. El-Taher and A. A. Gabr, Talanta, 43 (1996) 1511–1518.
46.A. A. Amindzhanov, K. A. Manonov, N. G. Kabirov and G. A. H. Abdelrahma, Russ. J. Inorg. Chem., 61 (2016) 81–85.
47.B. Antonio and G. Enrique, J. Chem. Edu., 76 (1999) 1727–1734.
48.D. T. Promila and R. Lonibala, J. Chem. Eng. Data, 55 (2010) 1166–1172.
49.G. A. Gouda, M. R. Shatat, T. A. Seaf Elnasr and M. H. Abdallah, Al-Azhar Bull. Sci., 24 (2013) 141–148.
50.G. A. H. Gouda and G. A. M. Ali, Malaysian J. Anal. Sci., 21 (2017). 1266–1275. 51.K. Benhamed, L. Boukli-Hacene and Y. Harek, Mediterr. J. Chem., 4 (2015) 209–218.
52.R. G. Parr and W. Yang, Density Functional Theory of Atoms and Molecules, Oxford University Press, New York 1989.
53.R. G. Pearson, J. Am. Chem. Soc., 107 (1985) 6801–6806.
54.C. G. Zhan, J. A. Nichols and D. A. Dixon, J. Phys. Chem. A, 107 (2003) 4184–4195. 55.Z. Zhou and R. G. Parr, J. Am. Chem. Soc., 112 (1990) 5720–5724.
56.R. G. Pearson, J. Am. Chem. Soc., 110 (1988) 2092–2094.
57.J. Song, F. Zhu, H. Wang and P. Zhao, Spectrochim. Acta Part A, Mol. Biomol. Spect., 129 (2014) 2092–2097.
58.R. K. Singh, S. K. Verma and P. D. Sharma, Int. J. Chem. Technol. Res., 3 (2011) 1571–1579. 59.K. Mati and S. L. Victor, Chem. Rev., 96 (1996) 1027–1043.


![Figure 7. Calculated high spin (Homo)and low spin (Lumo) molecular orbitals of the [CuHL]2+ system using the B3LYP/6-311++G(d,p) method](https://thumb-us.123doks.com/thumbv2/123dok_us/1759745.129589/11.596.62.538.75.233/figure-calculated-homo-lumo-molecular-orbitals-cuhl-method.webp)