Int. J. Electrochem. Sci., 12 (2017) 11580 – 11593, doi: 10.20964/2017.12.43
International Journal of
ELECTROCHEMICAL
SCIENCE
www.electrochemsci.orgEffect of Water Hardness and pH Value on the Corrosion
Behaviour of Copper in an Emulsion
Xudong Yan, Jianlin Sun*
School of Materials Science and Engineering, University of Science and Technology Beijing, Beijing 100083, China
*
E-mail: sjl@ustb.edu.cn
Received: 19 July 2017 / Accepted: 6 October 2017 / Published: 12 November 2017
Hard tap water and soft water were used to prepare oil-in-water (O/W) emulsions separately. The effects of water hardness and emulsion pH (2.5, 4.8, 8.3, and 12.1) on the corrosion behaviour of copper in an emulsion were investigated using potentiodynamic (PD) polarization curves, electrochemical impedance spectroscopy (EIS) and open circuit potential (OCP). The surface morphology of the Cu electrodes and the attachment of corrosive products were analysed by scanning electron microscopy (SEM) and energy dispersive spectrometry (EDS), respectively. The results showed that without an inhibitor, the corrosion current density of hard tap water increased by 1.6×10 -3
A/cm2, and the electrochemical resistances were significantly reduced compared with those in soft water, resulting in the disruption of the passive layer and accelerating corrosion. The corrosivity order of the four emulsions with different pH values was found to be strong acid (pH=2.5) > strong alkali (pH=12.1) > weak acid (pH=4.8) > weak alkali (pH=8.3). For strong acid/alkali emulsion systems, copper is more likely to react with chloride ions and oxygen ions to generate pitting corrosion.
Keywords: Corrosion, Soft water, Electrochemical impedance spectroscopy, Alkali, Acid
1. INTRODUCTION
also degrades the copper’s appearance and interferes with electrical contacts in the O/W emulsion. Therefore, it is extremely important to figure out the mechanisms of copper corrosion in the metal-forming process with the O/W emulsion lubrication if it is to be prevented.
So far, there has been considerable research indicating that copper and copper alloy corrosion can develop in multiple corrosion media such as the atmosphere, salt and even deaerated pure water [7-9]. On the basis of a great deal of facts, it is evident that the mechanism behind the formation of copper’s diverse corrosion products is strongly dependent upon the environment. Rice [10] found that the corrosion rate of copper in laboratory tests was a sensitive function of the relative humidity, as well as sulphur dioxide, hydrogen sulphide, ozone, hydrogen chloride and chlorine concentrations. He also observed that indoor corrosion rates obeyed normal log statistics over the field population in his study. When copper is exposed to air, the native oxide layer consisting of Cu2O and CuO may form in different stages [11-12], whereas in urban air contaminated by SOX, NOX, Cl2 and H2S, the copper corrosion is extremely enhanced. Additionally, inorganic minerals such as paratacamite (Cu2(OH)3Cl), brochantite (Cu4(OH)6SO4) and Antlerite (Cu3(SO4)(OH)4) will form over the long-term [13, 14]. Copper corrosion in hydrochloric and sulfuric acids was also studied by M. Sherif [15] and Zembura [16] separately.
Throughout the literature, it is found that most of the copper corrosion media are composed of atmosphere, sea water and various inorganic salts, while studies of emulsion used in the process of rolling and cutting are few. With regard to copper in an O/W emulsion system, the environment of Cu includes water hardness, ion concentrations, conductivity, and functional groups, as well as potential of hydrogen (pH). It is recognized that O/W emulsions possess multiple ions, and the ion concentrations are always diverse depending on the water hardness. Boulay [17] concluded that chlorine, natural organic matter and microbial extracellular polymeric substances are among the factors most commonly cited as influencing copper corrosion in soft waters — the critical review that follows attempts to examine each factor systematically. Other ions such as calcium ion, magnesium ion, potassium ion, sodium ion, etc. could be an important factor influencing the corrosion on copper. Additionally, the investigations on the corrosion of Cu usually focused on an acid solution. Ghandehari [18] reported that the corrosion rate of copper in HCl solution is more intense than that in H2SO4 at the same pH value because of the catalysis of the chloride ion. On the other hand, the inhibiting film composed of adsorbed sulphate ions could mitigate the rate of oxygen reduction. Furthermore, O/W emulsion systems always contain oiliness additives, extreme-pressure (EP) additives, and inhibitors, such as phytic acid [19], BTA-N [20], and benzothiazole [21], which change the pH of these solutions, and the corrosion properties of these emulsions towards copper could be altered once again.
electronic microscopy (SEM), and the attachment of the corrosive products was obtained by energy dispersive spectrometry (EDS).
2. EXPERIMENTAL PROCEDURES
2.1 Oil-in-water emulsion preparation
[image:3.596.84.512.421.508.2]The O/W emulsion was prepared using a hydrogenation mineral oil as the base fluid, and the physicochemical properties of the hydrogenation mineral oil are shown in Table 1. The non-phosphorus surfactants including NP-4 (C9H19C6H4O(CH2CH2O)nH) and NP-7 (C9H19C6H4O(CH2CH2O)nH) and the emulsifier containing oleic acid (C8H17CH=CH(CH2)7COOH) and triethanolamine (N(CH2CH2OH)3) were added to the base fluid to prepare the emulsified oil. All the emulsified oil was diluted to 5 wt.% with disparate water hardness including hard tap water and soft water, and the chemical compositions of different waters are listed in Table 2. Then, the emulsion was homogenized for 15 min with mechanical agitation at 55~60 °C. Furthermore, in order to simulate the environment of emulsions containing various additives in the actual metal processing and to investigate the influence of pH value of the O/W emulsion on the copper corrosion behaviour, four groups of pH samples were controlled by 1 mol/L H2SO4 and NaOH ranging from 2.3 to 10.5 in the same soft water.
Table 1. Physicochemical properties of the hydrogenation mineral oil
Main characteristics Parameter
Kinematic viscosity (40°C), mm2/s 5.0
Flash point (open), °C 150.0
Boiling range, °C 240.0-280.0
Sulphur content (wt), % 0.0
Aromatic content 0.2
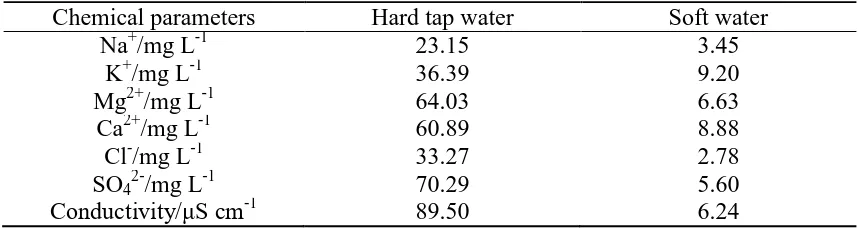
Table 2. Chemical compositions of different waters as measured
Chemical parameters Hard tap water Soft water
Na+/mg L-1 23.15 3.45
K+/mg L-1 36.39 9.20
Mg2+/mg L-1 64.03 6.63
Ca2+/mg L-1 60.89 8.88
Cl-/mg L-1 33.27 2.78
SO42-/mg L-1 70.29 5.60
Conductivity/μS cm-1
89.50 6.24
2.2 Electrochemical measurements
[image:3.596.83.512.562.677.2]
grade and then polished to a mirror-like surface followed by ultrasonic cleaning for 10 min with deionized water and acetone, separately. A typical three-electrode system consisting of a Cu working electrode, Ag/AgCl (SCE) reference electrode and Pt auxiliary electrode was employed to investigate the corrosion behaviour at room temperature (25±0.1°C). The potentiodynamic measurements were obtained and recorded from a potential of -2.0 VSCE to 1.5 VSCE at a scan rate of 1 mV/s by a VersaSTAT (MC) multichannel potentiostat system. A Luggin capillary was also used to measure the potential to minimize the potential of the liquid and the resistance of the solution.
2.3 Surface characterization
The surface morphology of the copper electrodes was observed with a scanning electron microscope (EVO 18). The composition of the attached corrosive products was analysed using energy dispersive spectrometry (EDS).
3. RESULTS AND DISCUSSION
3.1 Potentiodynamic polarization
Figure 1 presents the PD polarization curves for the Cu electrodes in emulsions prepared with different water hardness values. The anodic current density in hard tap water was higher than that in soft water. Following the Tafel region, a positive breakdown potential (Eb) appeared in soft water, and the passivation region was slightly broadened.
Although in the absence of an inhibitor (Figure 1 (a)), a clear passivation region could be observed in the two types of fluid (a potential 0.2-0.8 VSCE for soft water and a potential greater than 0.8 VSCE for hard tap water). These results showed that the nonionic surfactant or the emulsifier were adsorbed on the copper electrodes to form a passive layer, which protected both the anodic area and cathodic area from being corroded [22, 23]. Additionally, from the corrosion parameters in Table 3, the corrosion current density in soft water was 1.0×10⁻⁴ A/cm2, substantially smaller than that of 1.6×10⁻³ A/cm2 in hard tap water, indicating that it was easier for this fluid to possess the passive layer on copper.
10-7 10-6 10-5 10-4 10-3 10-2
-2.0 -1.5 -1.0 -0.5 0.0 0.5 1.0 1.5 Pot e n tial /V( vs.S CE) logi/A·cm-2 Soft water Hard tap water (a) Non-inhibitor
10-7 10-6 10-5 10-4 10-3 10-2 -2.0 -1.5 -1.0 -0.5 0.0 0.5 1.0 1.5 Pot en tial /V( vs.S CE) logi/A·cm-2 Soft water (b) With 2.5g/L inhibitor
Hard tap water
[image:5.596.77.521.70.258.2]Figure 1. Potentiodynamic polarization curves for the Cu electrode in O/W emulsion with (a) no inhibitor and (b) 2.5 g/L inhibitor. The corrosion potential (Ecorr), corrosion current (Icorr) and breakdown potential (Eb) were calculated from the polarization curves via the Tafel extrapolation method (immersion 55 min, 373 K, 1 mV/s)
Table 3. Corrosion parameters of potentiodynamic polarization curves
Corrosion parameters -Ecorr (mVSCE) Icorr (A/cm2) Eb (VSCE)
With no inhibitor Hard water 478.5 1.6×10
-3
0.02
Soft water 189.7 1.0×10⁻⁴ 0.18
With inhibitor Hard water 298.4 1.8×10
-6
0.04
Soft water 212.6 7.6×10⁻⁷ 0.36
-1.0 -0.8 -0.6 -0.4 -0.2 0.0
0.0 2.0x10⁻⁵ 4.0x10⁻⁵ 6.0x10⁻⁵
Soft• water
[image:5.596.50.553.367.443.2]Cur re n t d en sity/A.c m -2 Potential/Vvs.SCE Hard tap water
[image:5.596.156.440.490.705.2]
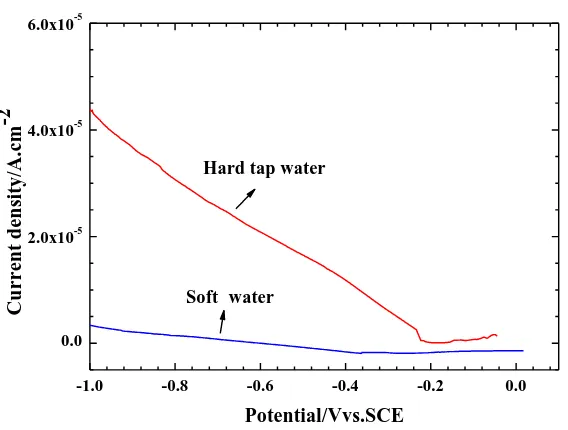
To investigate the variation of ohmic resistance on the Cu electrode in emulsions with different water hardness values, an evolution of cathodic polarization curves is given in Figure 2. The cathodic polarization region was chosen from -0.2--1.0 VSCE. A linear evolution from the potential and current density appeared, implying this process was controlled by ohmic resistance that was restricted by the solution electrochemical conductivity. From the Figure, the Cu electrode possessed a high E/i slope in hard tap water, but a relatively moderate curve was obtained in soft water. These results again illustrate the increased concentration of ions significantly influenced the electrochemical process, and were more conductive to polarization.
Through the above analysis, the conductivity of the Cu electrode (G=i/E) was strongly related to the ion conductivity. According to Newman’s [25] equations, for the rectangle Cu electrodes, the relationship between electrode potential and current density could be determined as follows:
2 2 1/ 2
1
ln 2 1 / /
2 aR b a b a
(1)
where is the conductivity of the emulsion, μs/cm;R is the value of actual measurements, Ω; and a
and b are the geometry parameters of the rectangular electrode, cm. With the 10 mm×10 mm rectangle electrodes, this equation can be simplified to
0.25G 0.25 i E/
(2)
The electrochemical experimental data were plugged into the equations. 1 represents the
conductivity in hard tap water, and it was 62.80 μm/cm; 2 represents conductivity in soft water, and
it was 4.20 μm/cm. These results are very close to the actual compositions in Table 2: 1'89.50μs/cm
and 2'6.24μs/cm.
Meanwhile, as illustrated in Table 2, the concentrations of magnesium ions, calcium ions and sodium ions in hard tap water were several times higher than those in soft water. Particularly, the concentration of chlorine ions and sulphate ions in hard tap water reached to 33.27 mg/L and 70.29 mg/L, respectively, which were over an order of magnitude higher than those in soft water. Clearly, the water hardness varies from the concentration of ions, which simultaneously changed the electrochemical conductivity, and has effects on the electrode’s polarization.
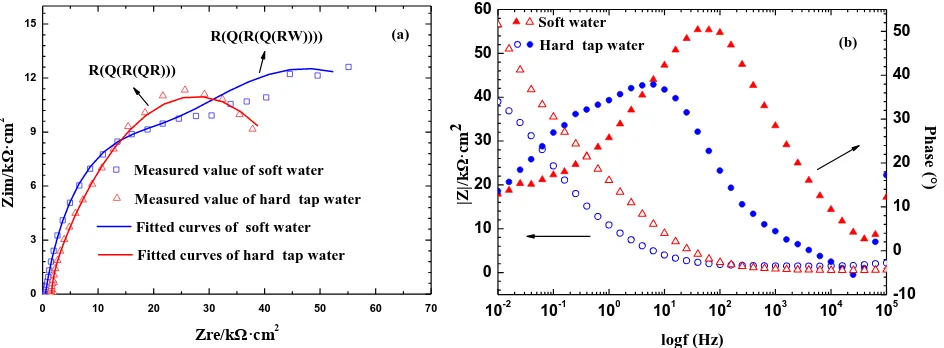
3.2 Electrochemical impedance spectroscopy
One was the transportation of soluble copper and copper ions from the electrode surface to the emulsion, and Cu+ was given priority to this process. Another was the diffusion of dissolved oxygen to the copper surface; the main electrode reaction of this process was the reduction reaction of oxygen. These two steps corresponded to the common physical regions in Warburg’s impedance [27].
0 3 6 9 12 15
0 10 20 30 40 50 60 70
R(Q(R(Q(RW)))) Z im /k Ω· cm 2 Zre/kΩ·cm2
Measured value of soft water R(Q(R(QR)))
(a)
Measured value of hard tap water Fitted curves of soft water Fitted curves of hard tap water
10-2 10-1 100 101 102 103 104 105 -10 0 10 20 30 40 50 0 10 20 30 40 50 60 Soft water Hard tap water
Pha se (° ) logf (Hz) |Z |/k Ω· cm 2 (b)
Figure 3. Electrochemical impedance spectroscopy for the Cu electrode in O/W emulsions with (a) Nyquist diagrams (b) and Bode scatter diagrams. (immersion 30 min, 373 K)
The presence of Warburg impedance in soft water with a low ion concentration resulted from the decrease in the transfer velocity of the electrochemical reaction process and gradually became dominant in the electrochemical reaction. The concentration polarization of ions was related to the charge-transfer process [28] and to some extent reduced the corrosion rate.
Figure 3 (b) presents the Bode plots of the Cu electrode in emulsions prepared with different water hardness values, and Z represents the impedance values over the whole frequency range. It was clear that Z of the Cu electrode with soft water was 10 kΩ/cm2, significantly greater than that with hard tap water, showing that the corrosion resistance of copper had been enhanced significantly. The impedance data with the hard water solution was dominated by charge-transfer resistance. From the former experimental results, chloride was the main ion that increased from soft water to hard tap water, which could accelerate the transportation of soluble copper species from the electrode surface to the emulsion and reduce the resistance. This phenomenon can also be described as follows [29, 30]:
-
-Cu + Cl CuCl + e (3)
-
-2
CuCl + Cl CuCl (4)
- 2+ -
-2
CuCl Cu + 2Cl + e (5)
[image:7.596.65.537.167.341.2]
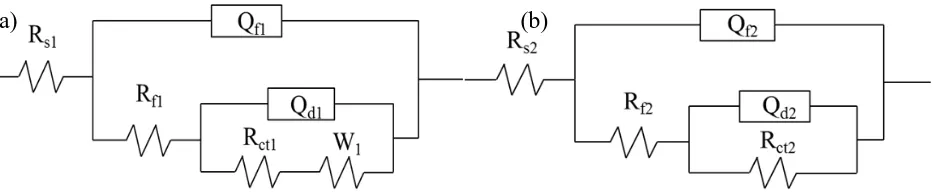
The data mentioned above were analysed by fitting them in the two most commonly used circuit models R(Q(R(QR))) and R(Q(R(Q(RW)))), and the results are shown in Figure 4. Clearly, the equivalent circuits with two time constants were more suitable for the system under study, with the values of chi-square (2
< 3.7×10⁻³) showing that the fitting was precise. Referring to Wang’s study
[31], Rs represents the O/W emulsion resistance and Rf is the resistance of the film formed on the copper surface, including the compounds of Cu+ and adsorbing film of emulsifier. Rct is the charge transfer resistance. Qf and Qdl represent the constant phase elements (CPE), where Qf is composed of the membrane capacitance. W is Warburg’s impedance. All of the impedance parameters are listed in Table 4. When the Cu electrodes were in hard tap water, these resistances including Rs, Rt, and Rct were significantly reduced by an order of magnitude compared with those in soft water, which again illustrated the passive layer was strongly broken by the ions in hard tap water.
[image:8.596.68.536.276.373.2]Figure 4. Electrochemical equivalent circuit of the Cu electrode in O/W emulsions prepared with (a) soft water and (b) hard tap water
Table 4. Impedance parameters of the O/W emulsion
Water hardness (kΩ/cmRs 2 )
Rf (kΩ/cm2
)
Rct (kΩ/cm2
)
Qf Qd W
Y0 (μF/cm2
) nf
Y0 (μF/cm2
) nd
Soft water 5.124 19.87 63.34 2.607 1 36.68 0.4336 356
Hard tap water 1.625 1.147 52.01 4.528 0.7157 47.61 0.4906 -
It is noteworthy that in this system, because of the adsorption of organic molecules [32] and the dispersion effect [33] with the help of Warburg’s impedance, the actual capacitance deviated from the double-layer capacitance, so the curve did not show an intact semicircle for resistance. The thickness of the electrical double layer increased when Cu reacted in soft water. Simultaneously, the organic molecules adsorbed on the Cu surface and reduced the corrosion area and the capacitance of the electrode.
3.3 Surface morphology
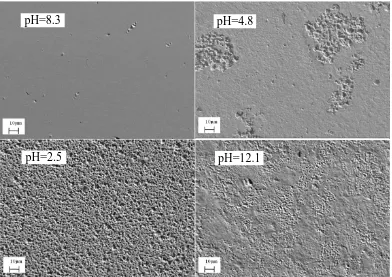
To further demonstrate the effects of water hardness on the Cu electrode, the SEM images of fresh polished copper surface after the electrochemical experiments are shown in Figure 5. When soft
[image:8.596.27.576.468.542.2]
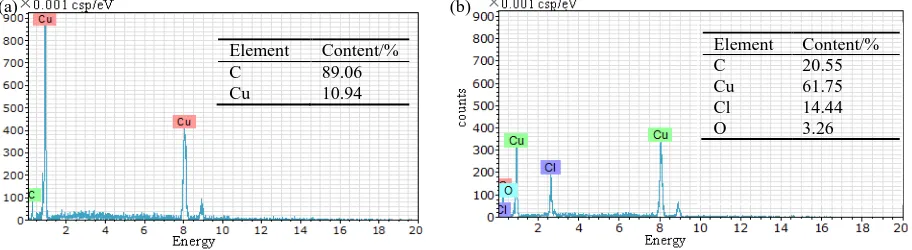
water was introduced, the polished trace was shallow, and the morphology seemed smooth, while the surface appeared coarse with hard tap water solutions. Around the polished scratch, it was evident that the copper surface was damaged by cavities and pitting, which were enlarged to some irregular holes and distributed along the worn orientation. Additionally, the surface residues under these two conditions were obtained from the EDS results (Figure 6). For the Cu was immersed in soft water, there were only Cu and C elements obtained on the surface. However, when the Cu electrode interacted with hard tap water, the C content increased; only 61.75% Cu was present on the surface, along with 14.44% of Cl and 3.26% of O elements. These results further indicated that oxygen and chlorine ions could react with the Cu surface and caused corrosion.
Figure 5. SEM images of Cu electrodes in (a) soft water and (b) hard tap water. (c) The high-resolution image of (b) after electrochemical experiments
Figure 6. EDS analysis of Cu electrodes after interaction with (a) soft water and (b) hard tap water solutions
3.4 Influence of pH value
Furthermore, the pH value could also be recognized as one of the key factors to alter the water. A separate insight into the influence of pH value on the Cu corrosion in O/W emulsions was obtained. The values of pH were set to 2.5, 4.8, 8.3 and 12.1.
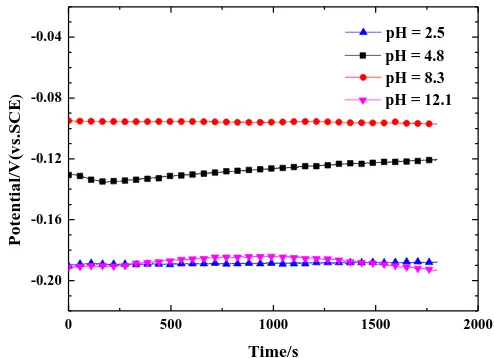
Figure 7 presents the variations in the open current potentials versus time of Cu electrodes immersed into emulsions with different pH. Clearly, the curves remained steady at the early stage of the process with negative OCP values. When the pH of the emulsion tended to an extreme value, such as 2.5 (a value approximate to strong acid) or 12.1 (close to strongly alkali), the potential reached a
Element Content/% C 20.55 Cu 61.75 Cl 14.44 O 3.26 Element Content/%
C 89.06 Cu 10.94
(a) (b)
(c) (b)
[image:9.596.58.546.250.369.2] [image:9.596.79.535.430.555.2]
more negative value, indicating the severe corrosion tendency of these two conditions. Once the pH returned to moderate conditions (pH=4.8 or pH=8.3), the mean potential of emulsions remained -0.09- -0.13 VSCE. This behaviour was ascribed to a slow-down of the reaction rate of the cathodic process because of the inhibiting effect of the amino acid surfactant and emulsifier and/or the deposition of corrosion products on the copper surface [34].
0 500 1000 1500 2000 -0.20
-0.16 -0.12 -0.08 -0.04
pH = 12.1 pH = 8.3 pH = 2.5
Pot
e
n
tial
/V
(vs.S
CE
)
Time/s
[image:10.596.174.421.170.349.2]pH = 4.8
Figure 7. Evolution of open current potential (OCP) of Cu in O/W emulsions with different pH from 2.5 to 12.1 (30 min, 373 K, soft water)
Then, the potentiodynamic polarization behaviour of Cu with different pH (from 2.5 to 12.1) emulsions is shown in Figure 8. In this regard, the anodic current density reached 5.0×10⁻⁴ A/cm2 when Cu was immersed into a strong acid (pH=2.5). This value was approximately 10 times the 1.7×10⁻⁵ A/cm2 in strong alkali (pH=12.1) and represented a more intense corrosion tendency. Its cathodic current density was also the highest compared with other conditions. The variation in current was sensitive in the weak polarization region (potential from -0.2 to 0.2 VSCE). It was found that a feeble anodic overpotential could increase the current, implying that the corrosion of Cu was mainly controlled by the electrochemical anodic reaction. Once the potential was over 0.3 VSCE, the passive layer with CuCl formed. Meanwhile, because of the rapid reaction velocity of Cu in the acidic liquid, the electrochemical polarization was transferred to the oxygen diffusion polarization and reduced the corrosion rate to some extent. Cu electrodes in emulsions with weak acid/alkali values (pH=4.8 and pH=8.3) exhibited a more ―moderate‖ electrochemical process. Clearly, in the acidic medium, the emulsions essentially slowed down the cathodic process, whereas in a weak to neutral medium, they hindered both anodic and cathodic processes [35]. It can be inferred that the corrosivity order of the four emulsions pH was found to be strong acid (pH=2.5) > strong alkali (pH=12.1) > weak acid (pH=4.8) > weak alkali (pH=8.3).
Cu electrodes were active, and the current density rose to 2.6×10⁻⁵ A/cm2. When they again reached a passive potential of 0.85 VSCE, the current density declined to 1.2×10⁻⁵ A/cm2, a value larger than (I). These processes were very similar to the general corrosion behaviour in the strong alkali [36, 37]. The formation of different passive regions contributed to the different corrosion products generated and adsorbed on the Cu surface to form the passive layers. For example, the corrosion product for (I) was Cu2O, while a mixture of CuO and Cu(OH)2 appeared for (II). It’s evident that the range of the passive region for (I) was smaller than that for (II), which illustrated that Cu2O possesses a pyknotic configuration compared with CuO and Cu(OH)2, and offers better protection.
10-7 10-6 10-5 10-4 10-3 10-2 -1.2
-0.8 -0.4 0.0 0.4 0.8 1.2 1.6
Pot
e
n
tial
/V
(vs.S
CE
)
pH=2.5
Current density/A·cm-2
pH=8.3
pH=12.1 pH=4.8
Figure 8. Polarization behaviour of Cu electrodes in O/W emulsions with different pH from 2.5 to 12.1 (45 min, 1 mV/s, 373 K, soft water)
[image:11.596.174.428.221.418.2]
Figure 9. SEM images of Cu electrodes in O/W emulsions with different pH after electrochemical polarization measurements
2 4 6 8 10 12 14 16 18 20
keV 0
1 2 3 4 5 6 7 cps/eV
C
O Cl
Cl Ca Ca
Cu Cu
2 4 6 8 10 12 14 16 18 20
keV 0
5 10 15 20 25 cps/eV
C
Cu Cu
S S Cl Cl
O
Figure 10 EDS of Cu electrodes surface in emulsions with (a) pH=2.5 and (b) pH=8.3 after electrochemical polarization measurements
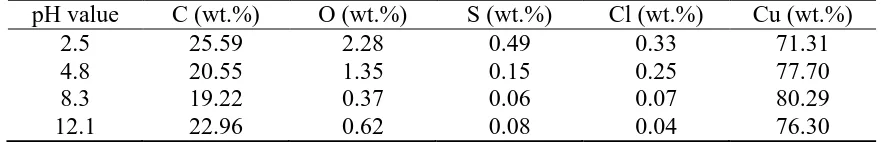
These corrosion products on the Cu surface in O/W emulsions with different pH were quantitatively measured with an EDS analysis, and the results are shown in Table 4, combined with the spectra of elements plotted in Figure 8. It can be seen that the cps for C ranged from approximately 20% to 25% and is due to a carbon spraying process before the measurement. The contents of Cl for the strong acid was higher than those in other solutions; this illustrated that chlorine severely corroded Cu, and the formation of a CuCl film could be inferred. These results were similar to Curkovic’s [35] study that CuCl was the main factor influencing the polarization curves of copper when the pH value ranged from 2.0 to 7.0, and the corrosion rate increased with decreasing pH. Furthermore, O was
(b) pH=8.3
(a) pH=2.5
pH=8.3 pH=4.8
[image:12.596.103.495.69.346.2] [image:12.596.77.529.415.556.2][image:13.596.77.518.160.231.2]
another dominant element in the copper corrosion, and it represented 2.28%, 0.37% and 0.62% for strong acid, weak alkali and strong alkali, respectively. This result verified the former discussion.
Table 5. The relative amount of elements on the Cu electrode surface with different pH values pH value C (wt.%) O (wt.%) S (wt.%) Cl (wt.%) Cu (wt.%)
2.5 25.59 2.28 0.49 0.33 71.31
4.8 20.55 1.35 0.15 0.25 77.70
8.3 19.22 0.37 0.06 0.07 80.29
12.1 22.96 0.62 0.08 0.04 76.30
4. CONCLUSIONS
Water hardness clearly influenced the corrosion tendency of copper in O/W emulsions. The corrosion current density of the Cu electrode increased by 1.6×10⁻³A/cm2 in hard tap water, and the electrochemical resistance was significantly reduced, resulting in in a disruption of the passive layer and accelerating corrosion. Cl and O elements were the main factors of the O/W emulsion to react with the copper surface, which caused the pitting corrosion.
The corrosivity order of the four emulsions with different pH values was found to be strong acid (pH=2.5) > strong alkali (pH=12.1) > weak acid (pH=4.8) > weak alkali (pH=8.3). It is essential to control the utilization of additives and keep the O/W emulsions in a weak alkali environment during the process of the actual metal processing.
ACKNOWLEDGMENT
The authors gratefully acknowledge the financial assistance provided by the National Natural Science foundation of China (No. 51474025).
References
1. E. Brinksmeier, D. Meyer and A. G. Huesmann-Cordes, CIRP. Ann-Manuf. Techn., 64(2015)605-628.
2. P. C. Priarone, M. Robiglio and L. Settineri, CIRP. Ann-Manuf. Techn., 65(2016)25-28. 3. D. Meyer, M. Redetzky and E. Brinksmeier, CIRP. Ann-Manuf. Techn., 66(2017)129-132. 4. C. L. Chuang, J. N. Aoh, J. Electron.Mater., 35(2006)1693-1700.
5. J. P. Byers, Metalworking fluids (2nd edition), Taylor & Francis, (2006), Boca Raton, United state.
6. S. Hymes, K. S. Kumar, S. P. Murarka, W. Wang and W. A. Lanford, J. Vac. Sci. Technol. B, 16(1998) 1107-1109.
7. D. W. Rice, P. Peterson, E. B. Rigby, P. B. P. Phipps, R. J. Cappell and R. Tremoureux, J. Electrochem. Soc., 128(1981)275-284.
8. H. T. Ren, S. Liu, P. Wang, S. Xu and H. B. Zhou, Appl. Mech.& Mater., 543-547 (2014) 3853-3856.
10.D. W. Rice, P. Peterson and E. B. Rigby, J. Electrochem Soc., 128(1981)275-284. 11.I. Platzman, R. Brener and H. Haick, J. Phys.Chem. C, 112(2008)1101-1108.
12.S. Suzuki, Y. Ishikawa, M. Isshiki and Y. Waseda, Mater. Trans. Jim., 38(1997) 1004-1009. 13.Z. Y. Chen, S. Zakipour, D. Persson and C. Leygraf, Corros., 61(2005)1022-1034.
14.G. Bech-Nielsen, M. Jaskula, I. Chorkendorff and J. Larsen, Electrochim. Acta, 47(2002)4279– 4290.
15.E. S. M. Sherif, R. M. Erasmus and J. D. Comins, J. Colloid Interface Sci., 311(2007)144-151. 16.Z. Zembura, J. Bugajski, Corros. Sci., 21(1981)69-78.
17.N. Boulay, M. Edwards, Water Res., 35(2001) 683-690.
18.M. H. Ghandehari, T. N. Andersen and H. Eyring, Corros. Sci., 16(1976)123-135. 19.C. J. Martin, W. J. Evans and J. Inorg Biochem., 27(1986)17-30.
20.M. M. Musiani, G. Mengoli, and M. Fleischmann, J. Electroanal. Chem. Interf. electrochem., 217(1987)187-202.
21.K. Tanaka, T. Kumagai and H. Aoki, J. Org. Chem., 66(2001)7328-7333. 22.M. A. Hegazy, M. F. Zaky, Corros. Sci., 52(2010)1333-1341.
23.X. Li, S. Deng and G. Mu, Corros. Sci., 50(2008)420-430. 24.H. J. Pearson, J. Electrochem Soc., 128(1981)2297-2303. 25.J. Newman, J. Electrochem. Soc., 113(1966)501-502.
26.S. Xiong, J.L. Sun and X. D. Yan, Int. J. Electrochem. Sci., 11(2016)10592-10606. 27.H.P. Lee, K. Nobe. J. Electrochem. Soc., 133 (1986) 2035-2043.
28.L. Guo, G. Ye and I. B. Obot, Int. J. Electrochem. Sci., 12(2017)166-177. 29.W. Li, L. Hu and S Zhang, Corros. Sci., 53(2011)735-745.
30.Sudheer, M. A. Quraishi, Corros. Sci., 70(2013)161-169. 31.D. Wang, B. Xiang and Y. Liang, Corros. Sci., 85(2014)77-86.
32.J. Wang, C.N. Cao and J.J. Chen. Soc. Corros. Prot., 15 (1995) 241-245. 33.K. Jüttner. Mater Sci Forum, 1990, 35(10)1501-1508.
34.E.E. Oguzie, Y. Li, F.H. Wang. Electrochim. Acta, 53 (2007) 909-914.
35.H. O. Curkovic, E. Stupnisek-Lisac, H. Takenouti. Corros. Sci., 52(2010)398-405. 36.J. Kunze, V. Maurice and L. H. Klein, Corros. Sci., 46(2004)245-264.
37.Y. H. Wang, J. B. He. Electrochim. Acta, 66(2012)45-51.