Horizontal Saddle Supported Storage Vessels:
Theoretical and Experimental Comparisons of
Plastic Collapse loads
A S Tooth, G C M Chan, J Spence and D H Nash
Department of Mechanical Engineering, University of Strathclyde, 75 Montrose Street, Glasgow, G1 1XJ, UK
ABSTRACT
Previous experimental work (1) on cylindrical vessels supported at the ends and subjected to central loading indicated that different collapse mechanisms could occur when the loading is applied either through loosely fitted saddles or through welded saddles. The modes of failure are dependent upon the value of the R/t ratio of the vessel. In general, progressive plastic collapse occurs in vessels with low values of R/t ratio, typically less than 200, and elastic-plastic buckling is observed in vessels with higher R/t ratios. The aim of this paper is to examine various theoretical analyses for plastic collapse loads, applicable to vessels with low values of R/t ratio, and compare these with the experimental results obtained by the authors and others. The theoretical behaviour appropriate for the thinner vessels, where the mode is failure is by buckling, has been previously examined by the authors elsewhere (2) although all the experimental values are included here for completeness. A number of classical and numerical analytical methods are employed to obtain the plastic collapse loads. Comparisons with the experimental results show that the elastic-plastic finite element analysis gives the best agreement. Further work in the form of a parametric study has been conducted on a range of vessels to enable a design method to be established. This is published as a companion paper in this volume.
NOTATION
b Distance to plastic hinges - see Figure 2.
b1 Width of saddle (mm) L Barrel length of vessel (mm)
P Load on one saddle (N)
Pex Experimental collapse load (kN)
Pmin Upper bound limit load by limit analysis
Pinc Inscribed yield solution by limit analysis
Pkrup Krupka's simplified solution by limit analysis
Plb Lower bound limit load by elastic compensation method
Pub Upper bound limit load by elastic compensation method
Pep Elastic-plastic collapse load by finite element analysis
R Mean radius of vessel (mm)
s Arc of contact in Krupka's analysis (= 2R )
t Shell thickness of vessel (mm)
2 Saddle embracing angle
y Yield strength of vessel material (N/mm2) R Maximum nodal stress (N/mm2)
1 INTRODUCTION
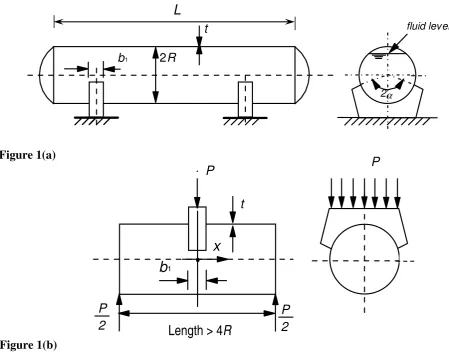
Horizontal vessels are widely used as storage vessels for liquids or gaseous products. These vessels are commonly supported above ground by twin saddles, which are either fitted loosely or welded on to the vessel, Fig 1a. Present design rules as given by the British Standard PD 5500 (3) limits the maximum stress in the saddle support region of the vessel to 1.25 times the design stress, that is typically a stress of 0.83 y. If a more detailed analysis is used to obtain the vessel stresses, then a 'Design-by-Analysis' approach, as outlined in Annex A of PD 5500, may be employed. In this case, the maximum value of primary plus secondary stress intensity is limited to twice the yield stress (2 y) or three times the design stress at the design temperature. From this it would appear that the 'Design-by-Analysis' approach permits of a higher value of the total vessel and contents weight. However, the maximum stress in the saddle horn region, as derived from PD 5500, is about half the corresponding stress derived using a more rigorous analysis (4). When the two stress levels are compared with their respective allowables, the difference between the two approaches is relatively small. There is, of course, much in favour of the rigorous approach when it comes to deriving an accurate value of the stresses in the vessel, as required for a fatigue assessment, as shown in Ref. (5).
from the collapse load, by dividing the collapse load by an appropriate factor, usually 1.5. It also avoids the necessity of categorising the stresses as required by the 'Design-by-Analysis' approach.
Plastic collapse loads have been investigated by the authors and by others in a range of experimental tests on end supported cylinders loaded centrally by an external saddle load, Fig 1b. The end supported cylinder model has been found to be a useful simplification for the study of a twin saddle supported horizontal vessel. Experimental work of the authors is reported in previous paper (1) where it was found that there are two main modes of collapse, a gradual plastic collapse and a more sudden elastic-plastic buckling failure. Plastic collapse occurs when the vessel radius to shell thickness is relatively small (typically R/t < 200) and is characterised by the sequential formation of plastic hinges which cause the eventual collapse of the vessel. The formation of plastic hinges is different for saddles which are welded to the vessel than for those where the vessel is placed loosely on the saddle. In the case of
welded saddles the hinges occur at the horns and (usually) on one side of the nadir close to the saddle. Loose saddles, on the other hand, have symmetric hinges which form round the periphery of the saddle/vessel interface; this ultimately results in a localised indentation on the shell surface under the saddle, referred to as a 'foot print'.
Previous authors, Tooth & Jones (6) and Krupka (7,8) have examined the collapse mechanism of loose and welded saddles and obtained equations to calculate the limit loads. In the case of Ref. (6), these equations have been derived for a rigorous upper bound limit analysis and inscribed yield solution and in Ref. (7) for a simplified yield equation. In addition to the classical limit analysis approach, finite element analysis has been employed to determine the collapse load using two different approaches namely, the "elastic compensation" method and the more conventional elastic-plastic routine. The "elastic compensation" method is a systematic procedure, developed by Mackenzie & Boyle (9,10) for estimating upper and lower bound limit loads. The method was developed from reduced modulus stress categorisation analysis in which the elastic modulus of the material is systematically reduced in regions of high stress and increased in regions of low stress. The net effect of this procedure is that the maximum stress will reduce and converge in subsequent iterations. This converged stress is a function of the limit load and thus lower and upper bound solutions can be obtained. The elastic-plastic method is a conventional non-linear analysis based on the plastic properties of the material used to determine the collapse load. This present paper examines these six different methods to obtain theoretical collapse loads and compare the predictions with those obtained from the experimental vessels.
2 EXPERIMENTAL RESULTS
A typical cylindrical vessel is shown in Figure 1(a) and assumed to be fluid filled as this represents the worst loading case. The vessel is unstiffened and has two saddle supports each with a saddle reaction force of P. If a portion of the vessel is isolated and inverted it can be considered to be loaded through one saddle with force P as in Figure 1(b). The force
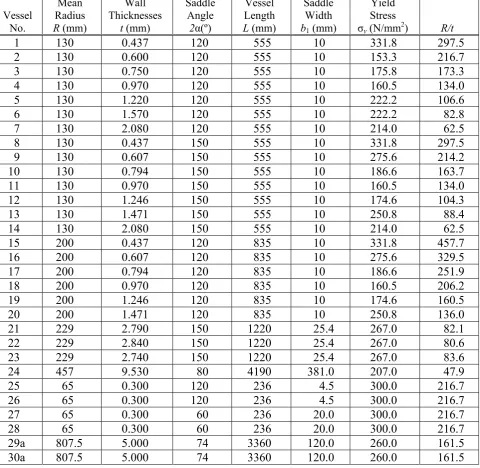
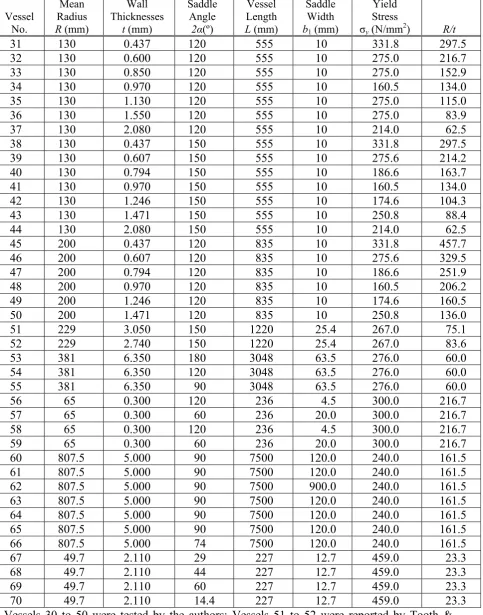
The present authors have reported the results of a programme of 40 experimental results, including both welded and loose saddles. Details of the test setup are given in Ref (1). These have been brought together with other similar experimental results to give a total experimental base for comparison of 70 tests. The main geometric features of the vessels are summarised in Tables 1 and 2. A range of saddle angles from 14.4º to 180º and R/t
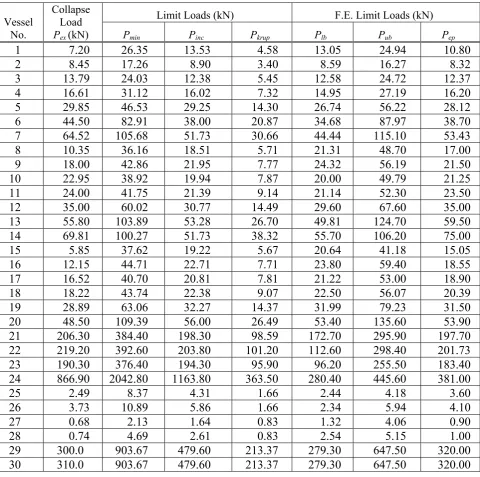
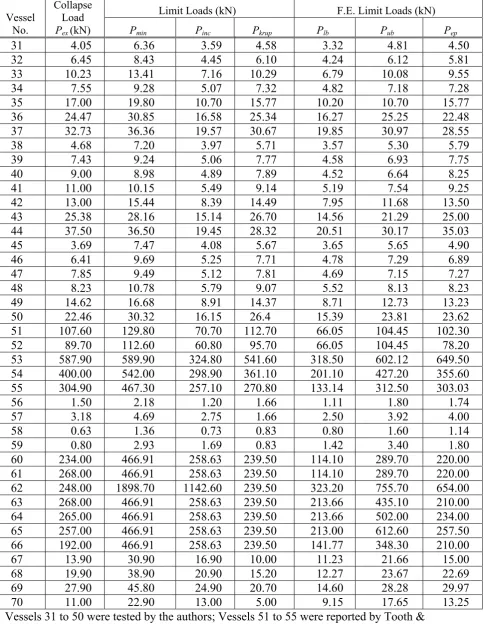
ratios from 23 to 457 are covered. Vessels 1 to 20 and 31 to 50 are from (1). Vessels 21 to 24 and 51,52 are from (6); vessels 25 to 30 and 56 to 66 are from Krupka (7,8); vessels 53 to 55 are from Wilson & Olsen (11) and vessels 67 to 70 are from White (12). The experimental collapse loads for the welded and loose saddles are listed in Tables 3 and 4, respectively. The collapse loads are simply the highest load sustained in the test.
3 RIGOROUS UPPER BOUND ANALYSIS
The rigorous upper bound analysis is based on the work of Tooth & Jones (6) which uses an upper bound limit analysis with a kinematically admissible velocity or displacement field. The material is idealised as rigid plastic and no allowances are made for the cylinder length or the effects of the ends. The postulated collapse mechanism is shown in Figure 2. This consists of three continuous shell regions I, II, and III and plastic hinges in the axial and circumferential directions together with an inclined hinge DE. The regions are symmetrical and only the quadrant OJEG is considered in the analysis. The derivations can be found in (6) and only the final limit equations are presented here.
3.1 Vessels with welded saddles
From (6) for welded saddles the upper bound limit load, Pminis found to be:
⎭ ⎬ ⎫ ⎩ ⎨ ⎧ ⎟ ⎠ ⎞ ⎜ ⎝ ⎛ +α − α + α = σ R b tb Rb b b t P y cos cos 2 cos 1 1 2 min ⎥ ⎦ ⎤ ⎢ ⎣ ⎡ ⎭ ⎬ ⎫ ⎩ ⎨ ⎧ α − ⎟ ⎠ ⎞ ⎜ ⎝ ⎛ +α − ⎟ ⎠ ⎞ ⎜ ⎝ ⎛ +
+ 0.5 1 4 1 sin sin
R b b R t R
... (1)
⎟ ⎠ ⎞ ⎜
⎝ ⎛ +α + R b b R sin 4
provided that b << R and α + . 2 π ≤ R b
The hinge distance, b, can be found through an iterative process from,
t R 4 0 sin 2 cos sin
sin ⎥− α =
⎦ ⎤ ⎢ ⎣ ⎡ ⎟ ⎠ ⎞ ⎜ ⎝ ⎛ +α − α − ⎟ ⎠ ⎞ ⎜ ⎝ ⎛ +α
R b R b R b ... (2)
Theoretical values of Pmincorresponding to the vessels in Table 1 are listed in Table 3.
3.2 Vessels with loose saddles
Similarly for loose saddles, the upper bound limit load is:
= σ 2 min t P y 1 sin cos cos cos
2 1 1
+ ⎭ ⎬ ⎫ ⎩ ⎨
⎧ α + α
+ ⎭ ⎬ ⎫ ⎩ ⎨ ⎧ ⎟ ⎠ ⎞ ⎜ ⎝ ⎛ +α − α b R R b R b tb Rb
+ ⎭ ⎬ ⎫ ⎩ ⎨ ⎧ ⎟ ⎠ ⎞ ⎜ ⎝ ⎛ + − + ⎟ ⎠ ⎞ ⎜ ⎝ ⎛ + R b b R R b b
R α α α
sin sin
sin 4
provided that b << R and α + . 2 π ≤ R b
The hinge distance, b, can be found as before through an iterative process from:
0 cos 2 cos 4 sin 2 sin sin 4 2 = α + ⎟ ⎠ ⎞ ⎜ ⎝ ⎛ +α − ⎟ ⎠ ⎞ ⎜ ⎝ ⎛ +α − ⎭ ⎬ ⎫ ⎩ ⎨ ⎧ α − ⎟ ⎠ ⎞ ⎜ ⎝ ⎛ +α
R b t R R b b R R b tb R
... (4)
Theoretical values of Pmin for the vessels with loose saddles are listed in Table 4.
3.3 Comparisons with experimental results
The upper bound collapse loads (upper bound limit loads) can be compared directly with the experimental results. The comparisons show that the rigorous upper bound approach gives loads which are too high for welded saddles. In many cases it predicts limit values of twice (or more than twice) the experimental collapse load. The comparisons of loose saddle cases also show predicted upper bound loads which are greater than the experimental results although the differences are not so great as for the welded saddles. For high R/t and small saddle angles the predictions were again more than twice the experimental values. However it should be borne in mind that for the higher R/t elastic buckling tends to intervene (1,2) giving lower experimental values than expected from plastic collapse considerations.
4 INSCRIBED YIELD SURFACE
Use of an inscribed yield surface is a well known way of reducing the estimates given by a rigorous upper bound approach. This tends to predict limit loads that are smaller than the upper bound limit loads and indeed smaller than the exact solution. The approximations to the inscribed yield surface used here are as proposed by Robinson (13). As with the upper bound case, only the final limit equation is presented. Further information of the derivation of the limit solutions can be found in (6).
4.1 Vessels with welded saddles
The inscribed yield surface limit load Pincis given as: =
σ 2 t P
y
inc 0.618
⎭ ⎬ ⎫ ⎩ ⎨ ⎧ ⎟ ⎠ ⎞ ⎜ ⎝ ⎛ +α − α + α R b bt R b b b cos cos 236 . 1 cos 1 1
+ 0.25 ⎥
⎦ ⎤ ⎢ ⎣ ⎡ ⎭ ⎬ ⎫ ⎩ ⎨
⎧ − α
⎟ ⎠ ⎞ ⎜
⎝ ⎛ +α − ⎟ ⎠ ⎞ ⎜ ⎝
⎛ +1 4 1 sin sin
R b b R t R
... (5)
+ 1.884 ⎟
⎠ ⎞ ⎜
⎝ ⎛ +α
R b b
R
sin
2.472 sin sin cos 0.147sin ⎟−1.089sinα=0 ⎠
⎞ ⎜
⎝ ⎛ +α + ⎭ ⎬ ⎫ ⎩ ⎨ ⎧ ⎟ ⎠ ⎞ ⎜ ⎝ ⎛ +α − α − ⎟ ⎠ ⎞ ⎜ ⎝ ⎛ +α
R b R b R b R b t R
... (6)
Again equations (5) and (6) are valid for b << R and
2 π ≤ + α R b . Predicted values of Pinc are included in Table 3.
4.2 Vessels with loose saddles
The inscribed yield surface limit load for loose saddles is given by:
548 . 0 sin cos 618 . 0 cos cos 236 .
1 1 1
2 ⎭⎬+
⎫ ⎩
⎨
⎧ α + α
+ ⎭ ⎬ ⎫ ⎩ ⎨ ⎧ ⎟ ⎠ ⎞ ⎜ ⎝ ⎛ +α − α = σ b R R b R b tb Rb t P y inc
+ 1.884
⎭ ⎬ ⎫ ⎩ ⎨ ⎧ ⎟ ⎠ ⎞ ⎜ ⎝ ⎛ +α − α + ⎟ ⎠ ⎞ ⎜ ⎝ ⎛ +α
R b b R R b b R sin sin 548 . 0
sin ... (7)
The equation for the hinge distance b is given by:
2.752 ⎟
⎠ ⎞ ⎜ ⎝ ⎛ + − ⎟ ⎠ ⎞ ⎜ ⎝ ⎛ + − ⎭ ⎬ ⎫ ⎩ ⎨ ⎧ − ⎟ ⎠ ⎞ ⎜ ⎝ ⎛ + R b t R R b b R R b tb
R α α α α
cos 472 . 2 sin 019 . 1 sin sin 2
+ 0.077 sin 1.166 0.28 ⎟cosα =0 ⎠ ⎞ ⎜ ⎝ ⎛ − + α t R b R
... (8)
with the same geometric range of validity as for the welded saddle.
Again calculated values for the vessels with loose saddles are given in Table 4.
4.3 Comparison with experimental results
A comparison of the inscribed yield surface limit loads (Pinc) with the experimental collapse results and the upper bound analysis can be made from Tables 3 and 4. As expected it generally gives a lower value compared with the upper bound analysis. Comparing the welded saddles, the inscribed yield solution gives loads which are roughly comparable to the experimental. For vessels with R/t between 80 and 217 and saddle embracing angles between 120º and 150º, the inscribed yield load is typically within ± 20% of the collapse load. For vessels with R/t ratios of 217 or greater, the inscribed yield load could be as high as two or three times the experimental collapse load. However, it should be noted as previously that in these cases, the experimental vessels tend to exhibit elastic buckling behaviour and the plastic limit analysis may be irrelevant. For vessels with R/t < 217 and
2 , < 120º, the inscribed yield surface limit load was higher by between 30 and 60%. For vessels with R/t of 80 or less and saddle angles between 120º and 150º, the inscribed yield load was lower than the experimental by up to about 25% (six cases).
5 SIMPLIFIED UPPER BOUND SOLUTION
Krupka (7,8) proposed a simplified upper bound solution to the collapse load of saddle supported vessels. The postulated mechanism consisted of a pair of parallel plastic hinges on each side of the saddle. Only the shell region under the saddle and the parallel hinges are considered. His analysis assumes that the saddle moves vertically with only radial shell movement in the collapse mechanism. The solution only applies for vessels with loose saddles. Strictly speaking, the mechanism is not kinematically admissible. However Krupka's simplified upper bound load, termed Pkrup, was given as:
R t st Pkrup = 2σy
where s in Krupka's formulationis 2R .
5.1 Comparison with experimental results
The comparison of Krupka's simplified equation with the experimental results is also shown in Tables 3 & 4. For completeness his solution is also compared with the welded saddles despite the above criticism. The comparison with the welded saddles (Table 3) show that his analysis underestimates the collapse load for almost all welded saddles, usually by a factor of two or three. However, loose saddles show a rather good correlation between his analysis and the collapse results. In most cases, the predicted limit loads vary by about ± 15%. For the larger R/t ratios the predicted loads tended to be high as expected. In the one case (Vessel No. 70) where the saddle embracing angle was very small, the limit load was less than half the experimental.
Broadly the comparison of the above analytical limit loads and the experimental collapse load show that the inscribed yield surface load method is reasonable for vessels with welded saddles and Krupka's simplified limit load is reasonable for loose saddles. Both solutions predict rather high limit loads for high R/t ratios (R/t >217 for the welded case and R/t>329 for the loose case), due no doubt to the onset of elastic buckling failure in the experiments.
6 ELASTIC COMPENSATION METHOD
Finite element methods will now be investigated. Two methods will be used, the first of these being the elastic compensation method.
linear elastic analyses, in which the elastic modulus of each element is modified according to an expression of the form:
) 1 ( ) 1 (
−
− σ
σ =
i n i i E E
where i = the iteration number n = a nominal stress
(i-1) = the maximum (non-averaged nodal effective stress (von Mises)) associated with the element calculated in the previous iteration. This iterative procedure redistributes the stress in the component and over a number of iterations the nett effect is to decrease the maximum stress in the model to a convergent value. As the iterative solutions are linear elastic, the stress magnitude is proportional to the applied load. A lower bound limit load can then be calculated by invoking the lower bound limit load theorem. The lower bound load is established by calculating the load required to make the maximum (non-averaged) nodal stress equal to y from simple proportionality. Considering the iteration giving the lowest value of maximum nodal stress as R, the limit load for a given load set P is:
R y lb P P
σ σ
= ... (10)
where Plb is the best estimate of the limit load.
The upper bound limit load can also be calculated from the converged iteration by comparing the strain energy (U) and the energy dissipation (D) in the deformed model. The upper bound limit load is proportional to the load set and is given as:
P U
D
Pub = ... (11)
where P is the load set and Pub is the upper bound limit load The finite element package used throughout was ANSYS. The procedures required to obtain the limit loads from this package can be performed fairly routinely using ANSYS Design Parametric Language (ADPL) macros. These macros were originally written in the Department of Mechanical Engineering in the University of Strathclyde (14).
6.1 Elastic compensation method - welded saddles
were not merged. Finer meshes were created near the saddle and vessel contact area where high stress gradients were expected in regions of uniform stress with a coarse mesh away from the saddle.
The set load, P, was applied as a pressure load on the saddle base. Elastic compensation was performed over 9 iterations which ensured convergence. The equations (10) and (11) were then used to evaluate the lower and upper bound limit loads. The resulting limit loads are tabulated in Table 3 as Plb and Pub, respectively.
6.2 Elastic compensation method - loose saddles
Vessels with loose saddles were treated in a similar way to the welded saddle cases. They differ in only one major aspect. With the loose saddles, there is a difficulty in correctly modelling the saddle interface reaction between the saddle and vessel. Although contact elements exist in the ANSYS formulation, they cannot easily be used with the elastic compensation method since, when the elastic modulus of the elements are increased, the rate of convergence of the contact elements decreases. Hence they do not converge readily to the required solution. The approach used here was to treat the saddle and vessel as two separate entities. Reaction forces from the saddle can be applied directly on the vessel and the elastic modulus of the elements in the vessel can then be reduced in the usual way. The reaction or interface forces can be obtained using an elastic shell analysis approach. This approach makes use of a computer program, "SADDLE", developed in the University of Strathclyde as reported by Ong (15) and validated by Tooth et al. (4). The program provides a series of radial interface pressures by assuming that (a) the interface is frictionless so that only radial interface forces are present and (b) the interface force is a pressure acting on a patch whose width is the width of the saddle. This means that constant interface force is assumed across the width of the saddle. It is further assumed that the magnitude of the interface forces is based on elastic analysis and does not change in subsequent iterations.
The resulting interface pressures effectively supply the loading to the cylinder and the elastic compensation method can then be applied as described above. The resulting lower and upper bound limit loads for the loose saddles are tabulated in Table 4.
7 ELASTIC-PLASTIC F.E. METHOD
and may slide relative to each other. The contact element is only capable of supporting compression in the radial direction and shear in the circumferential directions.
The vessel was stressed incrementally through a pressure acting on the saddle's base. A large deflection analysis was performed and an elastic perfectly plastic constitutive relationship was assumed for the material behaviour. The twice elastic slope method was used as a basis of obtaining the collapse load. This was obtained from a graph plotting the applied total load on the saddle and the vertical displacement of a node on the top (i.e. the base) of the saddle.
The results for the elastic-plastic analysis for the welded and loose saddle cases are included in tables 3 and 4, respectively.
8 COMMENTS ON THE ELASTIC COMPENSATION AND THE ELASTIC- PLASTIC METHODS
A comparison of the elastic compensation, the elastic-plastic and the experimental collapse load results can be made from Tables 3 & 4. For the welded saddles (Table 3) it is evident that for the elastic compensation method the upper bound limit loads (Pub) are twice those of the lower bound (Plb). The experimental collapse loads are generally within the upper and lower bound limits but are usually closer to the lower bound values except in cases where elastic buckling tends to intervene, i.e. high R/t values as in Vessels Nos. 1, 2, 8 & 9, 15, 16, 17, 27 & 28. In cases where the radius of the cylinder was 200mm, the experimental collapse loads were all almost lower than the lower bound limit loads (Vessel Nos. 15 to 19). The plastic comparisons with the experimental collapse results show that the elastic-plastic load are usually closer to the experimental results except when elastic buckling occurs (see above).
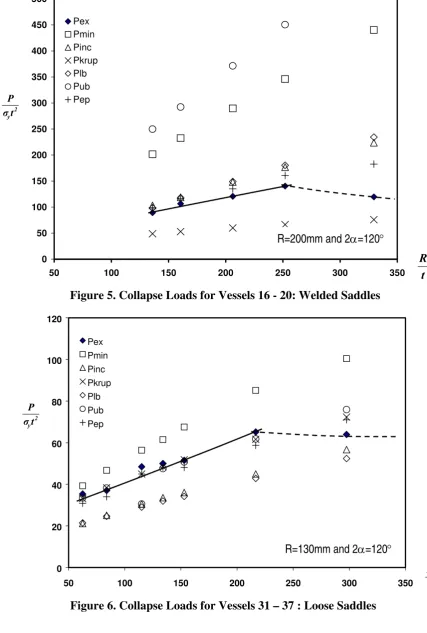
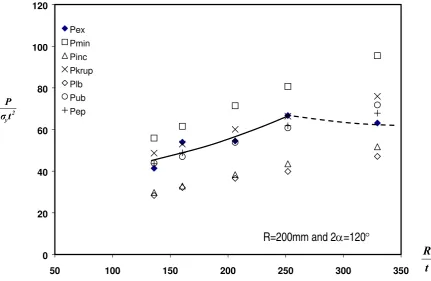
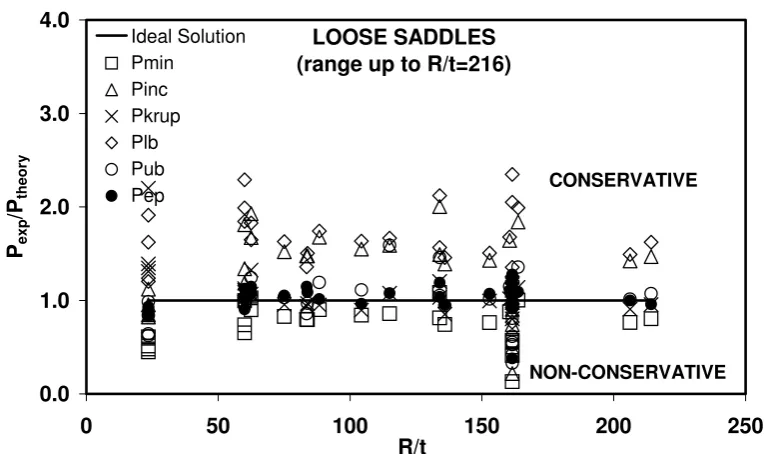
General comments on the loose saddle cases are more difficult to make as the collapse results are more scattered. However, the elastic compensation results show that the upper bound limit loads are generally (but not uniformly) 50% higher than the lower bound load. The experimental collapse results tend to be closer to the upper bound limit but are not bounded by Pub. The elastic-plastic results show a similar trend with the welded case, i.e. the results are generally in better agreement with the experimental results. The exceptions again are where elastic buckling seems to occur (Vessel Nos. 31, 38, 45, 58 & 59), whereupon the experimental collapse loads are lower than the elastic-plastic load.
9 COMPARISON OF ALL THEORETICAL RESULTS WITH SELECTED EXPERIMENTS
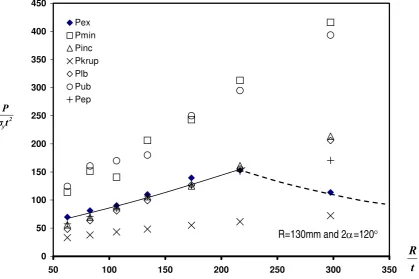
The discontinuity in the trend of the experimental results is evident; this has been discussed at some length in (1). Essentially the dotted line refers to the onset of elastic or elastic-plastic buckling. Obviously the theoretical results are all for elastic-plastic collapse type failure and should not be compared with the experiments beyond the cusp in the experimental line. Similarly, as has already been mentioned, some of the other experimental results in Tables 3 and 4, not plotted here, are also for high R/t and likely to be influenced by elastic buckling behaviour. For a given geometry it is not simple to predict when elastic buckling may intervene so the theoretical results have been shown for a wider range of R/t than that covered by the plastic collapse results in the authors' series.
A number of interesting trends can be detected, in particular between the welded and loose saddle cases, some of which have been mentioned earlier. However the main observation is that the elastic-plastic collapse load gives the best approximation to the experimental results. Figures 9 and 10 show the ratio of the experimental collapse load to theoretical collapse load, again plotted against R/t over the range 0 < R/t < 220. In this case all test results from Tables 3 & 4 in the range have been included. Accordingly this increases the scatter but it still emphasises the good agreement with the elastic-plastic result. Note that in this case the symbol for Pephas been changed to an infilled black circle for clarity.
10 CONCLUDING COMMENTS
This paper seeks to compare theoretical limit load approaches and various finite element-based methods with experimental collapse results for the simplified case of an end supported cylinder loaded centrally by a welded or loose saddle. These results should be useful in the context of twin saddle supported horizontal vessels. The limit load approaches are restricted since they treat the saddle-supported problem as a local problem and do not include the effect of the length of the vessel. It is partly for these reasons and in anticipation of design requirements that finite element methods were also examined.
REFERENCES
1 Chan G.C.M., Tooth A.S. and Spence J., ‘An experimental study of the collapse of horizontal saddle supported storage vessels.’ Proc. Inst. Mech. Engrs, Vol. 212, Part E, pp. 183-195.
2 Chan G.C.M., Tooth A.S. and Spence J., ‘A study of the buckling behaviour of horizontal saddle supported vessels.’ Bicentenary Conf. on Thin-Walled Structures, Univ. of Strathclyde, Dec. 1996. Publ. in Thin-Walled Structures, Vol. 30, No. 1-4, pp. 3-22, 1998.
3 British Standard PD 5500:2000, Specification for unfired fusion welded pressure vessels, British Standard Institution, London.
4 Tooth A.S., Duthie G., White G.C. and Carmichael J., ‘Stresses in horizontal storage vessels - a comparison of theory and experiment.’ J. Strain Analysis, Vol. 17, No. 3, 1982, pp. 169-176.
5 Tooth A.S. and Nash D.H., ‘Stress analysis and fatigue assessment of twin saddle supported pressure vessels.’ ASME-PVP Conf. on Pressure Vessels and Components, PVP Vol. 217, San Diego, 1991, pp. 41-48.
6 Tooth A.S. and Jones, N., ‘Plastic collapse loads of cylindrical pressure vessels supported by rigid saddles.’ J. of Strain Analysis, Vol. 17, No. 3, 1982, pp. 187-198.
7 Krupka V., ‘Saddle supported unstiffened horizontal vessels.’ In Acta Technica CSAV, No. 4, Prague, 1988, pp. 472-492.
8 Krupka V., "Plastic squeeze of circular shell due to saddle or lug." IUTAM Symp., Prague, 1990.
9 Mackenzie D. and Boyle J.T., ‘A method of estimating limit loads by interactive elastic analysis I - Simple examples.’ Int. J. Pres. Ves. and Piping, Vol. 53, 1993, pp. 777-96.
10 Mackenzie D, Boyle J.T. and Hamilton R., ‘The elastic compensation method for limit and shakedown analysis: a review.’ J. of Strain Analysis, Vol. 35, no. 3,2000, pp. 171-188.
11 Wilson W.M. and Olsen E.D., ‘Tests on cylindrical shells.’ Univ. of Illinois Eng. Exp. Station Bulletin No. 331, Sept. 1941.
12 White D.H., ‘Experimental determination of plastic collapse loads for cylindrical shells loaded radially through rigid supports.’ 2nd Int. Conf. on Pres. Ves. Tech., San Antonio, Oct. 1973, pp. 343-360.
13 Robinson M., ‘Comparison of yield surface for thin shell.’ Int. j. Mech. Sci., Vol. 13, 1971, pp.345-354.
15 Ong L S., ‘A computer program for cylindrical shell analysis.’ Int. J. Pres. Ves. and Piping, Vol. 32, pp. 131-149.
ACKNOWLEDGEMENTS
Table 1. Vessels with welded saddles
Vessel No.
Mean Radius
R (mm)
Wall Thicknesses
t (mm)
Saddle Angle
2 (º)
Vessel Length
L (mm)
Saddle Width
b1 (mm)
Yield Stress
y (N/mm2) R/t
1 130 0.437 120 555 10 331.8 297.5
2 130 0.600 120 555 10 153.3 216.7
3 130 0.750 120 555 10 175.8 173.3
4 130 0.970 120 555 10 160.5 134.0
5 130 1.220 120 555 10 222.2 106.6
6 130 1.570 120 555 10 222.2 82.8
7 130 2.080 120 555 10 214.0 62.5
8 130 0.437 150 555 10 331.8 297.5
9 130 0.607 150 555 10 275.6 214.2
10 130 0.794 150 555 10 186.6 163.7
11 130 0.970 150 555 10 160.5 134.0
12 130 1.246 150 555 10 174.6 104.3
13 130 1.471 150 555 10 250.8 88.4
14 130 2.080 150 555 10 214.0 62.5
15 200 0.437 120 835 10 331.8 457.7
16 200 0.607 120 835 10 275.6 329.5
17 200 0.794 120 835 10 186.6 251.9
18 200 0.970 120 835 10 160.5 206.2
19 200 1.246 120 835 10 174.6 160.5
20 200 1.471 120 835 10 250.8 136.0
21 229 2.790 150 1220 25.4 267.0 82.1 22 229 2.840 150 1220 25.4 267.0 80.6 23 229 2.740 150 1220 25.4 267.0 83.6
24 457 9.530 80 4190 381.0 207.0 47.9
25 65 0.300 120 236 4.5 300.0 216.7 26 65 0.300 120 236 4.5 300.0 216.7 27 65 0.300 60 236 20.0 300.0 216.7 28 65 0.300 60 236 20.0 300.0 216.7 29a 807.5 5.000 74 3360 120.0 260.0 161.5 30a 807.5 5.000 74 3360 120.0 260.0 161.5 a
Saddle offset at 760mm
Table 2. Vessels with loose saddles
Vessel No.
Mean Radius
R (mm)
Wall Thicknesses
t (mm)
Saddle Angle
2 (º)
Vessel Length
L (mm)
Saddle Width
b1(mm)
Yield Stress
y (N/mm2) R/t
31 130 0.437 120 555 10 331.8 297.5 32 130 0.600 120 555 10 275.0 216.7 33 130 0.850 120 555 10 275.0 152.9 34 130 0.970 120 555 10 160.5 134.0 35 130 1.130 120 555 10 275.0 115.0
36 130 1.550 120 555 10 275.0 83.9
37 130 2.080 120 555 10 214.0 62.5
38 130 0.437 150 555 10 331.8 297.5 39 130 0.607 150 555 10 275.6 214.2 40 130 0.794 150 555 10 186.6 163.7 41 130 0.970 150 555 10 160.5 134.0 42 130 1.246 150 555 10 174.6 104.3
43 130 1.471 150 555 10 250.8 88.4
44 130 2.080 150 555 10 214.0 62.5
Table 3. Collapse loads for vessels with welded saddles
Limit Loads (kN) F.E. Limit Loads (kN)
Vessel No.
Collapse Load
Pex (kN) Pmin Pinc Pkrup Plb Pub Pep
1 7.20 26.35 13.53 4.58 13.05 24.94 10.80
2 8.45 17.26 8.90 3.40 8.59 16.27 8.32
3 13.79 24.03 12.38 5.45 12.58 24.72 12.37 4 16.61 31.12 16.02 7.32 14.95 27.19 16.20 5 29.85 46.53 29.25 14.30 26.74 56.22 28.12 6 44.50 82.91 38.00 20.87 34.68 87.97 38.70 7 64.52 105.68 51.73 30.66 44.44 115.10 53.43 8 10.35 36.16 18.51 5.71 21.31 48.70 17.00 9 18.00 42.86 21.95 7.77 24.32 56.19 21.50 10 22.95 38.92 19.94 7.87 20.00 49.79 21.25 11 24.00 41.75 21.39 9.14 21.14 52.30 23.50 12 35.00 60.02 30.77 14.49 29.60 67.60 35.00 13 55.80 103.89 53.28 26.70 49.81 124.70 59.50 14 69.81 100.27 51.73 38.32 55.70 106.20 75.00
15 5.85 37.62 19.22 5.67 20.64 41.18 15.05
16 12.15 44.71 22.71 7.71 23.80 59.40 18.55 17 16.52 40.70 20.81 7.81 21.22 53.00 18.90 18 18.22 43.74 22.38 9.07 22.50 56.07 20.39 19 28.89 63.06 32.27 14.37 31.99 79.23 31.50 20 48.50 109.39 56.00 26.49 53.40 135.60 53.90 21 206.30 384.40 198.30 98.59 172.70 295.90 197.70 22 219.20 392.60 203.80 101.20 112.60 298.40 201.73 23 190.30 376.40 194.30 95.90 96.20 255.50 183.40 24 866.90 2042.80 1163.80 363.50 280.40 445.60 381.00
25 2.49 8.37 4.31 1.66 2.44 4.18 3.60
26 3.73 10.89 5.86 1.66 2.34 5.94 4.10
27 0.68 2.13 1.64 0.83 1.32 4.06 0.90 28 0.74 4.69 2.61 0.83 2.54 5.15 1.00 29 300.0 903.67 479.60 213.37 279.30 647.50 320.00 30 310.0 903.67 479.60 213.37 279.30 647.50 320.00
Table 4. Collapse loads for vessels with loose saddles
Limit Loads (kN) F.E. Limit Loads (kN)
Vessel No.
Collapse Load
Pex (kN) Pmin Pinc Pkrup Plb Pub Pep
31 4.05 6.36 3.59 4.58 3.32 4.81 4.50 32 6.45 8.43 4.45 6.10 4.24 6.12 5.81
33 10.23 13.41 7.16 10.29 6.79 10.08 9.55
34 7.55 9.28 5.07 7.32 4.82 7.18 7.28 35 17.00 19.80 10.70 15.77 10.20 10.70 15.77 36 24.47 30.85 16.58 25.34 16.27 25.25 22.48 37 32.73 36.36 19.57 30.67 19.85 30.97 28.55 38 4.68 7.20 3.97 5.71 3.57 5.30 5.79 39 7.43 9.24 5.06 7.77 4.58 6.93 7.75 40 9.00 8.98 4.89 7.89 4.52 6.64 8.25
41 11.00 10.15 5.49 9.14 5.19 7.54 9.25
42 13.00 15.44 8.39 14.49 7.95 11.68 13.50 43 25.38 28.16 15.14 26.70 14.56 21.29 25.00 44 37.50 36.50 19.45 28.32 20.51 30.17 35.03 45 3.69 7.47 4.08 5.67 3.65 5.65 4.90 46 6.41 9.69 5.25 7.71 4.78 7.29 6.89 47 7.85 9.49 5.12 7.81 4.69 7.15 7.27 48 8.23 10.78 5.79 9.07 5.52 8.13 8.23 49 14.62 16.68 8.91 14.37 8.71 12.73 13.23 50 22.46 30.32 16.15 26.4 15.39 23.81 23.62 51 107.60 129.80 70.70 112.70 66.05 104.45 102.30
52 89.70 112.60 60.80 95.70 66.05 104.45 78.20 53 587.90 589.90 324.80 541.60 318.50 602.12 649.50 54 400.00 542.00 298.90 361.10 201.10 427.20 355.60 55 304.90 467.30 257.10 270.80 133.14 312.50 303.03
56 1.50 2.18 1.20 1.66 1.11 1.80 1.74 57 3.18 4.69 2.75 1.66 2.50 3.92 4.00 58 0.63 1.36 0.73 0.83 0.80 1.60 1.14 59 0.80 2.93 1.69 0.83 1.42 3.40 1.80 60 234.00 466.91 258.63 239.50 114.10 289.70 220.00 61 268.00 466.91 258.63 239.50 114.10 289.70 220.00 62 248.00 1898.70 1142.60 239.50 323.20 755.70 654.00 63 268.00 466.91 258.63 239.50 213.66 435.10 210.00 64 265.00 466.91 258.63 239.50 213.66 502.00 234.00 65 257.00 466.91 258.63 239.50 213.00 612.60 257.50 66 192.00 466.91 258.63 239.50 141.77 348.30 210.00 67 13.90 30.90 16.90 10.00 11.23 21.66 15.00 68 19.90 38.90 20.90 15.20 12.27 23.67 22.69 69 27.90 45.80 24.90 20.70 14.60 28.28 29.97 70 11.00 22.90 13.00 5.00 9.15 17.65 13.25 Vessels 31 to 50 were tested by the authors; Vessels 51 to 55 were reported by Tooth &
d
fluid level
2α
b
12
R
t
P
P
t
P
2
P
2
x
b
1Length > 4
R
d
2
c
l
l
b
R
α
K H
B D
F E
J
G
Rη
Region III
RegionII
RegionI Hinges
S
add
le ar
ea
0
x - Axial direction [image:18.595.91.541.75.428.2]Figure 1(a)
Figure 2
d
fluid level
2α
b1 2R
t
P P
t
P
2 P
2
x
b
1 dL
L
sA
Length > 4
R
Figure 1(a)
Figure 1(b)
Figure 1 Geometric details of vessel and simple test arrangement
Figure 2 Geometric representation of plastic collapse regions
[image:18.595.191.449.503.755.2]0 50 100 150 200 250 300 350 400 450
50 100 150 200 250 300 350
Pex Pmin Pinc Pkrup Plb Pub Pep
[image:19.595.87.507.60.339.2]Figure 3. Collapse Loads for Vessels 1-7: Welded Saddles
0 100 200 300 400 500 600
50 100 150 200 250 300 350
Pex Pmin Pinc Pkrup Plb Pub Pep
[image:19.595.79.508.382.674.2]Figure 4. Collapse Loads for Vessels 8 - 14: Welded Saddles
t R
R=130mm and 2α=150°
2 yt P
R=130mm and 2α=120°
t R
0 50 100 150 200 250 300 350 400 450 500
50 100 150 200 250 300 350
Pex Pmin Pinc Pkrup Plb Pub Pep
Figure 5. Collapse Loads for Vessels 16 - 20: Welded Saddles
0 20 40 60 80 100 120
50 100 150 200 250 300 350
[image:20.595.72.500.92.726.2]Pex Pmin Pinc Pkrup Plb Pub Pep
Figure 6. Collapse Loads for Vessels 31 – 37 : Loose Saddles
t R
2 yt P
R=200mm and 2α=120°
2 yt P
t R
0 20 40 60 80 100 120
50 100 150 200 250 300 350
[image:21.595.89.505.61.344.2]Pex Pmin Pinc Pkrup Plb Pub Pep
Figure 7. Collapse Loads for Vessels 38 – 44 : Loose Saddles
0 20 40 60 80 100 120
50 100 150 200 250 300 350
Pex Pmin Pinc Pkrup Plb Pub Pep
Figure 8. Collapse Loads for Vessels 46 – 50: Loose Saddles R=130mm and 2α=150°
t R
2 yt P
t R
2 yt P
[image:21.595.94.526.413.694.2]WELDED SADDLES (range up to R/t=216)
0.0 1.0 2.0 3.0 4.0
0 50 100 150 200 250
R/t
Pexp
/ P
th
eo
ry
Ideal Solution Pmin
Pinc Pkrup Plb Pub Pep
NON-CONSERVATIVE
[image:22.595.100.486.60.290.2]CONSERVATIVE
Figure 9. Collapse Load Ratios : Welded Saddles
LOOSE SADDLES (range up to R/t=216)
0.0 1.0 2.0 3.0 4.0
0 50 100 150 200 250
R/t Pexp
/P
theory
Ideal Solution Pmin
Pinc Pkrup Plb Pub Pep
NON-CONSERVATIVE CONSERVATIVE
[image:22.595.98.481.355.582.2]