Chromatic and luminance sensitivity for skin and skinlike
textures
Tushar Chauhan
Department of Psychological Sciences, University of Liverpool, Liverpool, UK Universit ´e de Toulouse, Centre de Recherche Cerveau et Cognition, Toulouse, France Centre National de la Recherche Scientifique,
Toulouse, France
#
$
Kaida Xiao
School of Design, University of Leeds, Leeds, UKSophie Wuerger
Department of Psychological Sciences,University of Liverpool, Liverpool, UKDespite the importance of the appearance of human skin for theoretical and practical purposes, little is known about visual sensitivity to subtle skin-tone changes, and whether the human visual system is indeed optimized to discern skin-color changes that confer some evolutionary advantage. Here, we report discrimination thresholds in a three-dimensional chromatic-luminance color space for natural skin and skinlike textures, and compare these to thresholds for uniform stimuli of the same mean color. We find no evidence that discrimination performance is superior along evolutionarily relevant color directions. Instead, discriminability is primarily determined by the prevailing illumination, and discrimination ellipses are aligned with the daylight locus. More specifically, the area and orientation of discrimination ellipses are governed by the chromatic distance between the stimulus and the illumination. Since this is true for both uniform and textured stimuli, it is likely to be driven by adaptation to mean stimulus color. Natural skin texture itself does not confer any advantage for discrimination performance. Furthermore, we find that discrimination boundaries for skin, skinlike, and scrambled skin stimuli are consistently larger than those for uniform stimuli, suggesting a possible adaptation to higher order color statistics of skin. This is in line with findings by Hansen, Giesel, and Gegenfurtner (2008) for other natural stimuli (fruit and vegetables). Human observers are also more sensitive to skin-color changes under simulated daylight as opposed to fluorescent light. The reduced sensitivity is driven by a decline in sensitivity along the luminance axis, which is qualitatively consistent with predictions from a Von Kries adaptation model.
Introduction
Skin color and texture are used by humans in processing and accomplishing a variety of tasks, such as face recognition (Bar-Haim, Saidel, & Yovel, 2009), judgments of health (Stephen, Law Smith, Stirrat, & Perrett, 2009), and evaluation of attrac-tiveness (Fink et al., 2008; Fink, Grammer, & Thornhill, 2001; Stephen et al., 2009). Communica-tion of skin color has also been proposed as an important factor driving the evolution of human color vision (Changizi, Zhang, & Shimojo, 2006). However, relatively little is known about the performance of human observers in telling apart subtle changes in skin color.
Classical definitions of color appearance and color-difference metrics (defined through discrimi-nation thresholds) have relied on the use of uniform color stimuli. Many studies in the past have
measured discrimination thresholds for uniformly colored light fields and color patches (MacAdam, 1942; Melgosa, Hita, Poza, Alman, & Berns, 1997; Poirson & Wandell, 1990; Poirson, Wandell, Varner, & Brainard, 1990). These measurements have been used to develop color-appearance spaces such as CIE 1976 UCS (International Commission on Illumina-tion [CIE], 2004), CIELAB (CIE, 2004), and CIE-CAM02 (Moroney et al., 2002), some of which are also associated with color-difference metrics such as DELAB and DECAM02. The aim of these color spaces
is to propose a description of color based on appearance, where equal distances traversed in the
color space correspond to roughly equal perceived differences in appearance. Although these theories offer critical insights into the early mechanisms of human color vision, such as color opponency, they do not provide a convincing framework to study natural polychromatic stimuli. The response of the visual system to these stimuli is more complex, and relatively less understood. For instance, Webster and Mollon (1997) showed that the human visual system adapts to color distributions in natural scenes. In particular, when natural (or naturallike) stimuli are presented to observers, their color perception has been shown to be affected by factors such as the object’s textural properties (Vurro, Ling, & Hurlbert, 2013) and the observer’s memory of the object (Olkkonen, Hansen, & Gegenfurtner, 2008). Conse-quently, attempts to define and estimate discrimina-tion surfaces for polychromatic stimuli have been relatively fewer and more recent. Montag and Berns (2000) compared luminance thresholds for textures and uniform patches and found the luminance thresholds for textures to be higher by a factor of 2. Hansen, Giesel, and Gegenfurtner (2008) and Giesel, Hansen, and Gegenfurtner (2009) estimated chro-matic thresholds in an isoluminant plane for uniform patches, natural objects, and polychromatic textures with color distributions similar to natural stimuli.
In this article, we investigate how the human visual system responds to an ecologically important class of polychromatic natural stimuli: human skin. We do so by estimating discrimination thresholds for skin and skinlike patches not in an isoluminant chromaticity plane but in a more informative chromaticity-luminance color space. In the first experiment, we estimate thresholds for skin stimuli from two distinct ethnicities under simulated day-light and fluorescent day-lighting. We compare these thresholds to those obtained for uniform colors. We find that thresholds for skin are higher than those for uniform patches. The change in the magnitude of these thresholds with illumination is mediated by a luminance, and not a chromatic, mechanism. In the second experiment, we investigate how discrimina-tion thresholds are affected by the color of the illuminant and the mean color of the stimulus. Our results suggest that the chromatic discrimination ellipses change size with their chromatic distance from the ambient illuminant. Taken together, our data indicate that the human visual system shows adaptation to the spatio-chromatic structure of skin. In addition, our results on the discrimination
thresholds for skin stimuli lend themselves to a variety of applications such as the evaluation of skin prostheses and algorithms for automated dermato-logical examination.
Methodology
This section gives methodological details common to all the experiments described in this article. Experi-ment-specific details are described in the corresponding sections to avoid confusion.
Lighting conditions
All experiments were carried out in a lightproof anechoic chamber fitted with an overhead luminaire (GLE-M5/32; GTI Graphic Technology Inc., New-burgh, NY). Two illumination modes from the overhead luminaire were used—metameric daylight and cool-white fluorescent light. In the first experiment, an additional dark condition was also used, wherein the overhead luminaire was switched off. The light
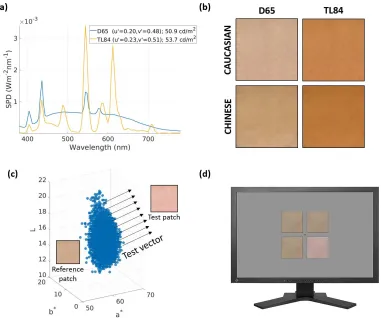
reaching the screen in each luminaire mode was measured using a spectroradiometer (PR-650; Photo Research Inc., North Syracuse, NY) and a standard white reflective tile placed at the same position as the center of the stimulus (which was presented on a screen). The measured spectral power distributions of the two illuminants are shown in Figure 1a.
The task and stimulus generation
In all experiments, thresholds were estimated using a four-alternative forced-choice task. Four patches were simultaneously displayed on the screen, of which three were copies of a single reference patch, while one—the
test patch—differed in color (Figure 1d). The observer’s task was to indicate the odd one out by pressing the corresponding button on a response box. The test patch was generated by adding atest vectorin 3-D CIELAB color space (CIE, 2004) to each pixel of the reference patch. The process is illustrated in Figure 1c.
The CIELAB space was chosen because of its wide acceptance as a uniform color space. This is achieved through nonlinear compression of opponency channels and a normalization to a reference white point. Intuitively, equal steps in CIELAB space correspond to (roughly) equal changes in the color appearance of the stimulus. The white point used for the normalization of this CIELAB space was fixed as the white point of the display used for the experiment, with CIE xyY
coordinates (CIE, 2004) of [0.28 0.30 106.1445]T. The thresholds were estimated along 14 directions such that the CIELAB space was sampled evenly. Six of these coincided with the cardinal 6L*, 6a*, and 6b*
controlled by the QUEST adaptive algorithm (Watson & Pelli, 1983), leading to 14 interleaved staircases. Theoretically, the measured threshold corresponded to an 86%score on the psychometric function. In the best-case scenario, each stairbest-case lasted approximately 40 trials, although if observers made frequent errors, some lasted for as many as 90 trials.
Stimulus presentation
The stimuli were presented on a color-calibrated monitor (ColorEdge CG243W; EIZO Corporation, Hakusan, Japan) using the ViSaGe graphics system (Cambridge Research Systems Ltd., Rochester, UK) The participants were seated 175 cm away from the screen. At this distance, the opposing edges of the individual 5 cm3 5 cm patches subtended an angle of’1.658 at the observer’s retina (while the diagonals subtended an angle
of ’2.38). In all cases except the dark condition, the screen was covered by a gray cardboard sheet with cutouts such that only the four patches remained visible. This occluded the self-luminous background, forcing the observer to further adapt to the ambient illumination. It also made the patches appear less like images presented on a self-luminous screen, akin to what is often described as anobject modeof stimulus presentation (Tangkijviwat, Rattanakasamsuk, & Shinoda,2010). We think this is a more ecologically valid method of presenting stimuli such as natural or known textures and surfaces on a computer screen.
In the dark condition, the gray cardboard was removed and the stimuli consisted of the four patches against a gray background of the same chromaticity as the simulated daylight from the luminaire (x¼0.32,y¼
[image:3.612.118.499.58.376.2]0.34) at 20 cd/m2. This chromaticity was chosen in order to avoid arbitrary adaptation to the textured self-luminous stimuli while also ensuring that the dark
Figure 1. Experimental methods. (a) Spectral power distributions of the overhead illuminants: Simulated daylight (6100 K, blue line) and cool-white fluorescent lighting (3900 K, yellow line). They are labeled D65 and TL84, respectively, as they are approximately metameric with standard D65 (6500 K) and TL84/F11 (4000 K) illuminants. (b) Simulated skin patches used as reference stimuli in
Experiment 1. Skin patches (Caucasian and Chinese) were simulated using the metameric daylight and cool-white fluorescent
condition remained comparable to the luminaire-illuminated D65 condition.
Response collection and analysis software
The observer responses were collected using a mechanical-contact response box (RB-350, Cedrus Corporation, San Pedro, CA). The experiment was programmed in MATLAB (MathWorks, Natick, MA) using the CRS (Cambridge Research Systems) Tool-box. The ellipsoid fitting and data analysis were performed in MATLAB and R.
Experimental protocol
The study began with an initial briefing where the four-alternative forced-choice odd-one-out task was explained and participants were instructed on how to use the response box. During this briefing the experimenter also mentioned that the study was designed to measure the observers’ ability to differentiate between small changes in skin appearance. Next, the participants were tested for color-normal vision using the Cambridge Colour Test (Regan, Reffin, & Mollon,1994). Due to the nature of the study, only participants with normal color vision were allowed to continue.
To avoid observer fatigue, testing was carried out in blocks held on separate days. Only one illumination condition was tested per block, due to the prohibitively high stabilization period of the luminaire. Before testing, the corresponding light source was allowed to stabilize for at least half an hour. Each block was divided into several sessions, each corresponding to the measurement of a separate discrimination boundary. Since the discrimination boundary was estimated by measurements along 14 directions, each session con-sisted of 14 randomly interleaved staircases operating along different directions in color space.
The sessions began with a test run of 30–50 easy trials (DELAB 5) which were not part of the main
experiment; the objective was to facilitate adaptation to the ambient illumination while at the same time making sure that the observers understood and remembered the task. After the test run, the observers remained in the lightproof chamber for another minute for further adaptation, before a long beep signaled the start of the main experiment. At this point, the observers pressed a button to start the presentation of the trials. Each trial consisted of on-screen display of the stimulus corre-sponding to a randomly chosen staircase, which timed out after a maximum of 5 s (the stimulus was displayed throughout the duration of the trial). If the observer failed to respond within 5 s in a given trial, the experiment advanced to the next randomly chosen
staircase while the state of the original staircase (for which the observer did not register a response) was not changed. A response or time-out was signaled by a beep, after which the experiment moved on to the next trial.
The thresholds for each condition were estimated thrice. There were breaks of 5–10 min. between the sessions, during which the observers were allowed to exit the lightproof chamber.
Ethical approval was gained from the University of Liverpool Ethics Sub-Committee, and the study was performed in accordance with the ethical standards laid down in the Declaration of Helsinki. Participants were recruited from the student population of the University of Liverpool. All subjects were reimbursed for their time. Prior to participation, informed consent was gained from each subject.
Data analysis
Color space
CIELAB is a device-independent uniform color space, with respect to a given white point. It expresses color as three numerical values:L*for the lightness and
a*andb*for the green–red and blue–yellow chromatic components. CIELAB includes a von Kries–type adaptation constant to account for appearance changes due to illumination changes. CIE 1976 UCS, on the other hand (whose axes are commonly labeled asu0and
v0), is a uniform chromaticity-scale diagram. It is a projective transformation of the CIE xy chromaticity diagram (CIE, 2004) designed to yield a more uniform perceptual color spacing. Its axes roughly denote the red–green and yellow–blue colors. Both spaces are attempts to improve perceptual uniformity of the standard tristimulus CIE XYZ space, but CIE 1976 UCS does not make any assumptions about the adaptational state of the visual system.
While CIELAB allows for sampling of the color-appearance space in a uniform manner, it also makes it difficult to compare absolute visual sensitivity across illumination conditions. Since we were interested in studying the effect of illumination changes, we analyzed our results in a color space composed of the CIE 1976 UCS and a scaled luminance axis. The luminance axis was scaled by 1/100 so that it followed the order of magnitude of the chromaticity values, akin to methods previously employed by Melgosa et al. (1997) for reporting suprathreshold ellipsoids for surface colors. We will refer to this space as theu0v0Y0space, whereY0is the scaled version of the CIE luminance coordinate Y.
Ellipsoid fitting
the three repetitions. For each set of 14 average thresholds (along each of the 14 directions of mea-surement), an ellipsoid centered at the mean stimulus color was fitted by minimizing the total least-squared distance of the points from the ellipsoid surface. This resulted in one fitted ellipsoid per observer per condition. A detailed mathematical description of the ellipsoid fitting is provided in Appendix 1.
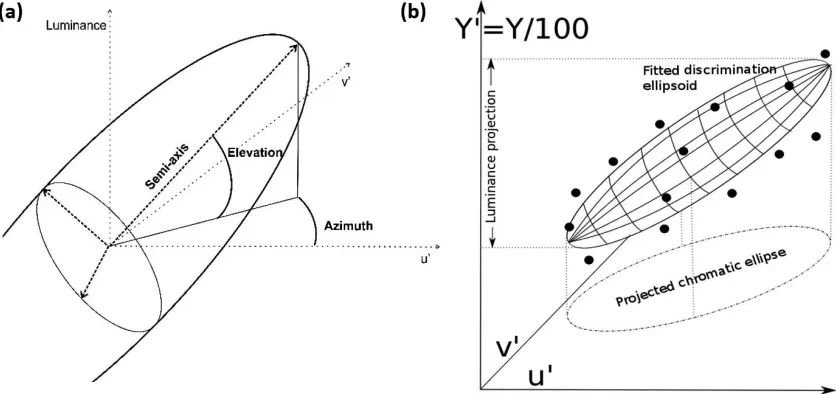
A set of meaningful parameters such as axis lengths and projections (see Figure 2 and Appendix 1) was extracted from the ellipsoids for analysis. One of the main parameters in our analysis was the volume of the ellipsoids, as it can be interpreted as a measure of the number of nondiscriminable stimuli given a fixed reference stimulus (the center of the ellipsoid). To further explore the discrimination boundaries, we divided the analysis into two parts: an analysis of the projections of these ellipsoids on the chromatic plane (theoretically, the envelope of chromatic discrimina-tion ellipses across luminance) and an analysis of the luminance projections of the ellipsoids (both projec-tions are illustrated in Figure 2b). This analysis of the discrimination ellipsoid in terms of luminance and chromaticity projections was driven by the indepen-dence in the chromaticity and luminance projections of discrimination ellipsoids reported by other re-searchers (Melgosa, P´erez, El Moraghi, & Hita, 1999) and later verified by results from the present study. It also breaks down the complicated 3-D discrimination boundaries into components that are relatively easier to interpret.
Software and statistics
The analysis was carried out using standard tool-boxes in R and MATLAB. Circular variables were analyzed using directional statistics (Fisher, 1953) through the circular package in R and the CircStat toolbox (Berens, 2009) in MATLAB. Both these packages use routines primarily based on the work of Jammalamadaka and Sengupta (2001).
Experiment 1: Skin images and
uniform patches
The aim of the first experiment was to investigate how discrimination boundaries for skin differ from those for the corresponding mean uniform color, and to determine the influence of lighting condition and skin ethnicity on the nature of these changes. The discrimination boundaries were estimated under three different ambient lighting conditions (dark, daylight D65, and cool-white fluorescent TL84), using calibrat-ed images of two skin types (Caucasian and Chinese). The choice of the two skin types was based on recent reports that ethnicity is highly correlated with the colorimetric yellowness of skin (Xiao et al., 2017).
Skin images: Acquisition and simulation
[image:5.612.97.515.61.258.2]Images of a Caucasian and a Chinese female face were captured under controlled D65 lighting in a
Verivide DigiEye light booth using a calibrated Nikon D7000 camera. The images were calibrated for size by including a marker of known dimensions in the frame. Patches approximately 535 cm were cropped from the forehead regions of two selected images (one image per ethnicity). The cropping was done such that the patches looked uniformly lit, planar, and textured. Care was taken to minimize cues besides color and texture, such as obvious illumination gradients, shadows, furrows, wrinkles, blemishes, and facial and stray hair. These cropped patches were then used for the reconstruction of the reflectance spectrum at each pixel (Agahian, Amirshahi, & Amirshahi,2008; Babaei, Amirshahi, & Agahian, 2011; Shen, Cai, Shao, & Xin, 2007; Xiao et al., 2016) using a Silicon skin-color chart manufactured by Spectromatch. Compared to standard calibration techniques such as the MacBeth chart, this skin-specific calibration provides better accuracy within the specific region of skin gamuts.
These spectral imagesallowed for the simulation of the color of each pixel under any given illuminant using the simple illuminant-reflectance-sensor equation for each pixel:
Xi ¼
Z 780nm
380nm
Lð Þk ^rpixelð Þk xið Þk dk;i2f1;2;3g ð1Þ
Here, kis the wavelength in the visible spectrum, L(k) is the spectrum of the illuminant,r^pixelð Þk is the estimated reflectance spectrum calculated for each pixel,xið Þk is the ith CIE 1931 XYZ color-matching function, andXi is theith tristimulus coordinate corresponding toxið Þk . In this experiment, values of L(k) correspond to the spectral power distribution
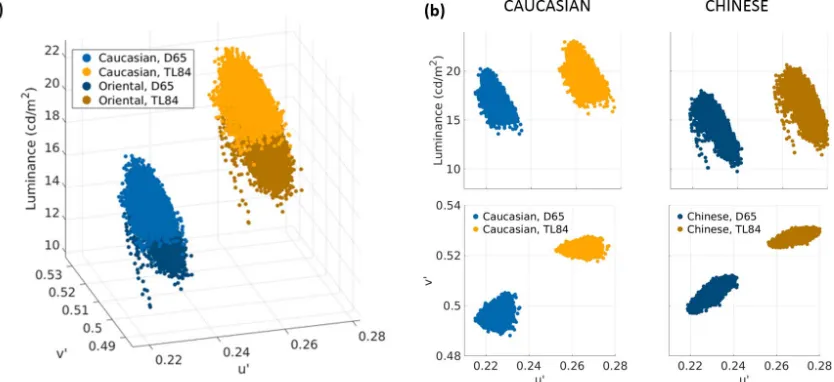
curves shown in Figure 1. The color gamuts of the patches simulated using both overhead illuminants are shown in Figure 3a, while the luminance and chromatic projections of these distributions are shown in Figure 3b. The first row shows plots of luminance (ordinate) against the u0 coordinate (abscissa), while the second row shows u0v0 chromaticity plots (v0 ordinate, u0
abscissa).
A more detailed description of the color distribution of the two patches is shown in Table 1. The specific skin images used were prototypical images for both
ethnicities with a mean color and luminance approx-imately in the center of the distribution for each ethnicity (Xiao et al., 2016). The gamut of the Chinese patch was found to have a higher luminance range in each illumination condition, and the gamuts for each ethnicity showed higher volumes and areas in D65 compared to TL84. A principal-components analysis of the chromatic projections of the gamuts further showed that the variance explained by the first principal component was reasonably high in all cases. An analysis of the orientation of this first principal component showed that while the color distribution of the Caucasian patch varied along the u0 axis in both illumination conditions, the Chinese patch showed variation along an inclined axis, with the inclination changing markedly with the illuminant.
Stimuli
[image:6.612.102.519.61.252.2]All stimuli were generated by applying the procedure described under The task and stimulus generation. For
Figure 3. Color distribution of the stimuli. (a) The color distribution in theu0v0Yspace. The skin patches were simulated (Equation 1)
using D65 and TL84 illuminant spectral power distributions (Figure 1a) and pixel-wise reconstructed reflectance spectra. Displayed stimuli were always consistent with the ambient illumination in the test booth. (b) Luminance and chromatic spreads of the stimuli. Patches are shown column-wise (left column, Caucasian; right column, Chinese). The first row shows the luminance spreads
the measurement of skin thresholds, thereference imageswere the skin patches described under Skin images: Acquisition and simulation. In addition, discrimination thresholds for two uniform color patches were also measured using the same procedure as the skin patches. These two uniform color patches corresponded to the mean CIELAB colors of the two skin patches (Caucasian and Chinese), respectively.
Experimental protocol
The experiment was conducted in two stages. In both stages, the protocol outlined earlier under
Experimen-tal protocol was used. The first stage measured thresholds for skin stimuli in 18 participants. In the second stage, eight of the 18 participants were recalled for the measurement of uniform skin-color discrimi-nation thresholds.
Within a given illumination block (see the first Experimental protocol section), stimuli derived from the two ethnicities (Caucasian and Chinese) were tested alternately, three times each, leading to a total of six sub-blocks. On average, the observers respond-ed to approximately 40 trials per staircase; and since there were 14 interleaved staircases, each sub-block consisted of at least 550 trials lasting from 20 to 25 min. A total of 252 thresholds (3 illuminants32 patch ethnicities33 repetitions314 measurement direc-tions) were measured for each type of stimulus—skin images and uniform patches—amounting to about 7.5 hr of testing per participant per stimulus type. The participants were compensated for their time with a fee.
Results
The mean discrimination ellipsoids for skin images are shown in Figure 4a, and those for uniform patches in Figure 4b. The average measured threshold along each of the 14 directions is plotted as a small sphere, with the standard error across participants represented by a black line along the direction of measurement. The fluorescent illuminant (TL84) condition is plotted in yellow, simulated daylight (D65) in blue, and the dark condition in gray. An examination of the average ellipsoids in Figure 4 reveals that the ellipsoids for skin images (Figure 4a) are larger than those for uniform colors (Figure 4b).
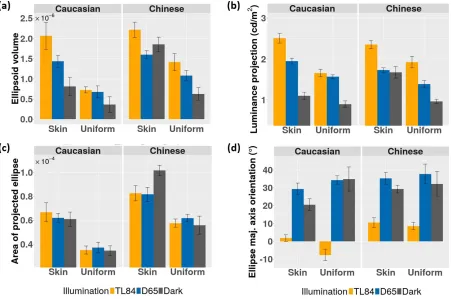
This is also reflected in the plot of the ellipsoid volumes shown in Figure 5a. To further examine these discrimination volumes, they were projected on the luminance axis and the u0v0 chromaticity plane (for details, see Data analysis and Appendix 1). The length of the luminance projection (a line segment) and the area of the chromaticity projection (an ellipse) are shown in Figure 5b and 5c, respectively. Both
luminance and chromatic thresholds are higher for skin stimuli than for uniform patches. Furthermore, the luminance projections for skin images are, on average, larger in TL84 than the other two illumination
conditions.
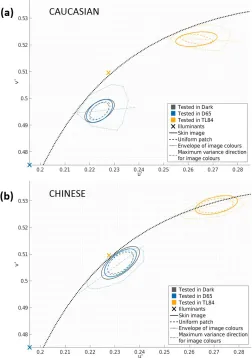
[image:7.612.40.289.59.460.2]Figure 6 shows the mean chromatic projections (discrimination ellipses) on the u0v0chromaticity plane. The chromatic ellipses for skin images (solid lines) are larger than those for the corresponding uniform patches (dashed lines). It is also interesting to note that while the area of these chromatic ellipses changes between the two ethnicities (being higher for the
Figure 4. Ellipsoids fitted to mean thresholds. (a) Skin patches
(N¼18). (b) Uniform colors (N¼8). The average thresholds
Chinese skin patch), there is little variation within the illumination conditions. Besides the area, the orienta-tion of these ellipses (Figure 5d) also shows an
interesting trend: The ellipses for the TL84 illumination condition differ markedly in their orientation from the dark and D65 conditions. These effects are also reflected in the individual observer data (Supplemen-tary File S1).
Discussion
[image:8.612.82.533.373.672.2]Skin stimuli
Figure 5a shows that human observers are better at discriminating small differences in skin appearance under simulated daylight than under artificial fluores-cent lighting (irrespective of the ethnicity of the stimuli). Interestingly, this variation in discrimination
Figure 5. Discrimination ellipsoid parameters with 95% confidence intervals (Cousineau,2005; Morey, 2008). Only observers common
to both conditions (N¼8) are considered. The parameters are derived by fitting ellipsoids to each observer’s threshold data. The
colors of the bars code the ambient illumination. (a) Ellipsoid volume. (b) Length of the luminance projection. (c) Area of the projected chromatic ellipse. (d) Orientation of the chromatic ellipse’s major axis. A detailed derivation of these parameters is given in Appendix 1.
Mean (u0,v0,Y, in cd/m2)
Volume
(3106)
Luminance range
(in cd/m2)
Area
(3104)
Orientation of first PC
(in8fromu0axis), with variance explained
Caucasian patch
D65 (0.224, 0.495, 17.40) 7.44 6.63 2.42 5.1 (61%)
TL84 (0.263, 0.522, 19.98) 5.82 7.42 1.69 2.7 (87%)
Chinese patch
D65 (0.232, 0.507, 14.31) 7.78 8.24 1.97 34.3 (89%)
TL84 (0.271, 0.528, 16.60) 6.46 9.18 1.40 13.5 (92%)
Table 1. The color distributions of the two skin patches (Caucasian and Chinese) described using five parameters.Notes: Mean¼the
mean color of the patches inu0v0Yspace. Volume¼calculated by fitting a convex hull to the distributions inu0v0Y0space. Luminance
range¼calculated by using maximum and minimum luminance values in the distributions. Area¼calculated by fitting a convex hull
to the chromatic projections of the data on theu0v0plane. Orientation of first PC (principal component)¼calculated by performing a
principal-components analysis on the chromatic projections and computing the angle made by the first principal component with the
ability is not reflected equally in the luminance and chromatic dimensions. While the luminance projections of the ellipsoids change between the TL84 and D65 conditions, (Figure 5b), the chromatic projections remain roughly the same area (Figure 5c), differing only in orientation (Figure 5d).
Furthermore, the azimuths of the chromatic ellipses for skin stimuli (solid lines in Figure 6) show a
systematic variation. This variation could be explained in two plausible ways. First, we observe that the azimuths for both the patches seem to be aligned with the daylight locus. This supports the theory that discrimination thresholds are minimally orthogonal to the caerulean line—the line representing natural illuminants (Danilova & Mollon, 2010); and observers
tend to confuse colors that lie along the daylight locus more than the colors that lie orthogonal to it. A second explanation could be that the alignment of the ellipses is influenced by the color gamut of the respective skin patches. This is similar to the results obtained by Hansen et al. (2008), who found that isoluminant discrimination ellipses roughly follow the direction of maximum chromatic variation in natural stimuli (banana, orange, and lettuce). These two explanations are by no means exclusive, and could be reconciled by the very interesting possibility that color distributions of natural surfaces and textures under varied lighting conditions fall maximally along the daylight locus.
The dark condition
In the simulated daylight and fluorescent conditions, the reference images represent ecologically valid simu-lations where the ambient illumination is consistent with the simulated appearance of the skin patch. The dark condition, on the other hand, does not represent an ambient illumination and is always inconsistent with the rendered skin patch (which is simulated using the D65 illuminant). The patches in this condition could easily be made out by the observers to be self-luminous images displayed on a screen. Even so, an interesting observation can be made if one compares the simulated daylight and the dark conditions. Although the two conditions use stimuli simulated using the same illuminant (luminaire D65), they have different viewing parameters in terms of the display mode (object mode in D65 vs. self-luminous surface patch in dark), the surround (gray cardboard reflecting ambient lighting in D65 vs. self-luminous gray screen in the dark condi-tion), and the luminance of the illumination (’51 cd/m2 simulated daylight from an overhead luminaire in D65 vs.’20 cd/m2simulated daylight from the surround in the dark condition). Bearing this in mind, we observe that the chromatic projections of the discrimination ellipsoids under these two conditions display remark-ably similar orientations (Figure 5d), whereas the discrimination ellipsoids themselves differ in overall volume (Figure 5a). This could suggest that while the chromatic mechanisms which respond to the skin stimulus depend on the spectrum of the foveal stimulus (which is the same in both dark and D65 conditions), the relative activations of these mechanisms are influenced by the adaptation conditions (which differ markedly between the two conditions).
Skin versus uniform stimuli: Adaptation to color distributions
[image:9.612.40.292.63.421.2]Figure 7 shows the ratio of ellipsoid parameters for skin images and the corresponding uniform patches. Skin images are harder to discriminate, with ellipsoid
Figure 6. Average chromatic projections (ellipses) of the
discrimination ellipsoids on theu0v0plane. (a) Caucasian patch.
volumes about 2–3 times larger than those for uniform patches (Figure 7a). This difference is found along both chromatic (Figure 7b) and luminance (Figure 7c) dimensions, though the ratios are higher for chromatic projections. A similar increase in chromatic thresholds was reported by Hansen et al. (2008) for natural textures, and for synthetic textures with color distri-butions similar to natural textures. Montag and Berns (2000) also reported similar effects in luminance thresholds. A possible explanation of these results could lie in the proposition by Webster and Mollon (1997) that polychromatic natural stimuli entail not only adaptation to the mean luminance of the scene but also a contrast adaptation to the color distribution within the scene. They reasoned that although light adaptation could adjust for changes in mean color, it cannot compensate for changes in the statistics of the color distributions. They further proposed that con-trast-adaptation mechanisms might operate by whit-ening the stimulus color distribution based on changes in postreceptoral channel tunings, with new tunings emerging due to inhibition between channels which produce the most correlated responses (Atick, Li, & Redlich, 1993; Barlow & F¨oldi´ak, 1989; Webster & Mollon, 1997). Considering that in the current study the observer could view the entire scene (the interior of the testing booth), one cannot ignore contrast adapta-tion regardless of whether the tested stimuli were uniform or textured. Even so, it is likely that the amount of possible contrast adaptation in case of uniform stimuli was lower than that for the simulated skin patches (since there is no contrast within a uniform foveal stimulus). Thus, the observers were compara-tively less adapted, and hence less capable of constancy or discounting the illuminant in the uniform color condition, which in turn would predict better discrim-ination performance or lower thresholds compared to skin stimuli.
Discrimination of skin stimuli along the u0 and v0 directions
So far, we have reported the discrimination thresh-olds in terms of the parameters of fitted discrimination boundaries. In industrial processes such as 3-D printing of skin prostheses, measurements are often made along the axes of the color space. Thus, to better use our data in practical applications, it is important to analyze the projections of discrimination boundaries onto the u0
and v0 axes.
Chromatic discrimination ellipses for skin stimuli (see Appendix 2) show that the just-noticeable differ-ences along the two axes are, in general, not equal. While the distortion is very high in the artificial fluorescent (TL84) illuminant, simulated daylight illu-mination (D65) produces roughly similar thresholds along the two axes. In D65, the thresholds range from 0.005 to 0.01 along either axis (for comparison, uniform color just-noticeable differences in u0v0 are around 0.005), and thev0thresholds are about 0.7 times theu0 thresholds. Thus, to a first approximation under a daylight illuminant, the commonly used u0v0 space can indeed be quite useful to predict whether two skin patches will look the same.
Experiment 2: Skinlike color
distributions
[image:10.612.43.569.61.186.2]In Experiment 1 we showed that discrimination thresholds for skin stimuli are higher than those for uniform patches, and that both sets of stimuli are affected by the illumination condition. But what are the properties of the stimulus and the ambient illumination which drive these thresholds? This was investigated in Experiment 2; the specific question addressed here was to what extent the illuminant and the mean location of the stimulus in color space affect the discrimination
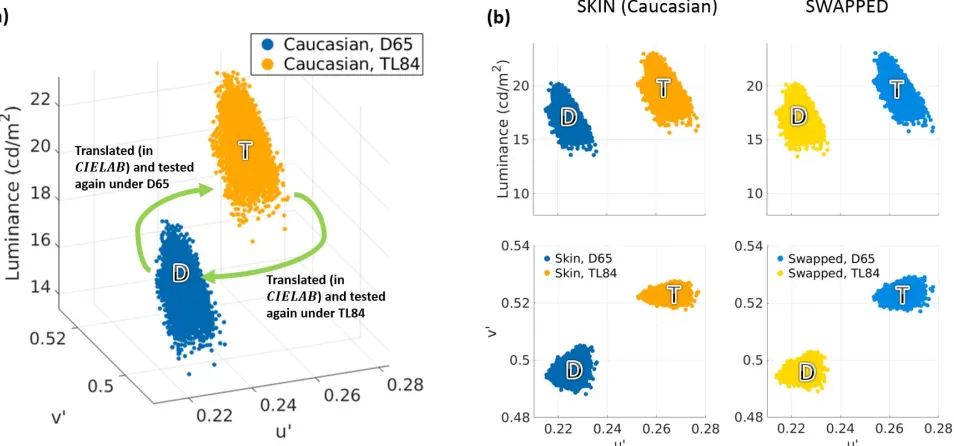
thresholds. In Experiment 1, the simulated skin patches were ecologically valid (i.e., the appearance of each stimulus was simulated such that they were consistent with the ambient illumination). For Experiment 2, the color distributions of these ecologically valid stimuli from Experiment 1 were translated such that the mean colors in the two illumination conditions were swapped (Figure 8), while their relative distributions remained intact. Our hypothesis was that if the thresholds are simply driven by the location of the textures in color space, swapping of the means should also swap the discrimination thresholds of the stimuli in the two illumination conditions.
Reference stimuli and illumination conditions
In Experiment 1, the reference stimuliwere color-accurate renderings of skin patches such that their appearance was consistent with the ambient illumina-tion (D65 or TL84). In Experiment 2, the reference stimuli were obtained by translating the color distri-bution of simulated skin under one illuminant (say D65) such that its mean moved to the mean color of
simulated skin under the other illuminant (in this case, TL84). Note that this manipulation, while swapping the means of the stimuli under the two illuminants, maintains their original relative color distributions (Figure 8a). Since the swap involved colors measured under different illuminants, it was carried out in the CIELAB space, which has some degree of inbuilt adaptation. To reduce the testing time per participant, only stimuli based on the original Caucasian patch were tested, and the ecologically inconsistent dark condition was dropped. Thresholds for uniform patches derived from the mean CIELAB colors of the stimuli were also measured.
Figure 8b shows the luminance and chromatic gamuts of the skin images (left column) and the mean-swapped images (right column). The illumination condition is shown by the color of the distribution (light and dark blue: D65; yellow and brown: TL84).
Experimental protocol
[image:11.612.71.548.62.285.2]The experiment followed the exact same protocol as Experiment 1except that only a subset of the observers
Figure 8. Stimuli used in Experiment 2. (a) Generation of polychromatic reference stimuli for Experiment 2, shown inu0v0Ycolor
space. Only the Caucasian patch was used in this experiment. The mean colors of the Caucasian patch simulated under D65 and TL84
are labeled‘‘D’’and‘‘T,’’respectively. In Experiment 2, the reference stimulus to be tested in D65 was generated by translating the
distribution under D65 such that its mean was shifted to T. Similarly, the reference stimulus tested under TL84 was generated by translating the TL84 skin distribution such that its mean was shifted to D. This essentially swapped the means of the two distributions while maintaining the relative positions of the colors (the relative distribution). Thus, in Experiment 2, T is the mean color of the reference stimulus tested under D65, while D is the mean color of the stimulus tested under TL84. (b) Luminance and chromatic spreads of the simulated skin patches (left column) and the stimuli generated by swapping their relative distributions in CIELAB space (right column). In each case, the color of the points represents the illumination used for testing the corresponding patch (light and
dark blue: D65; yellow and brown: TL84). The first row shows the luminance spreads (luminance along the ordinate,u0along abscissa)
(N¼6) from Experiment 1 were recruited. In total, 168 thresholds (2 illuminants32 stimulus types: uniform and textures33 repetitions314 measurement
directions) were measured, amounting to about 6 hr of testing per participant.
Results
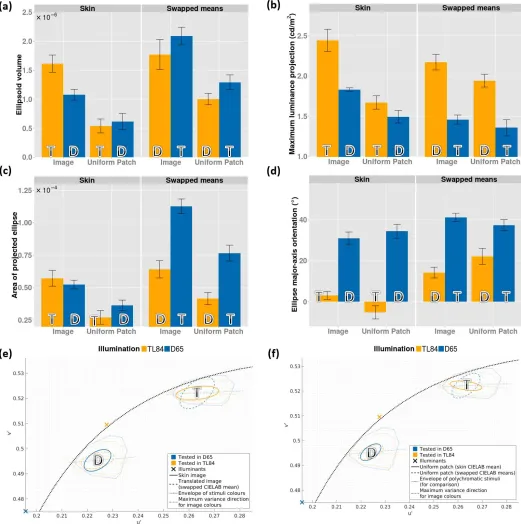
In Figure 9we show the results from Experiment 2, along with a subset of the results from Experiment 1 for comparison (only participants common to all tested conditions are shown). The ellipsoid volumes for textured (‘‘Image’’) and uniform stimuli in Experiment 2 (‘‘Swapped means,’’ right subpanel, Figure 9a) show the same trend as Experiment 1 (left subpanel, Figure 9a), with the volumes for textures or images being larger than those for uniform stimuli. In Experiment 1 we found this difference to be distributed over both the luminance and chromatic thresholds (see left subpanels from Figure 9b and 9c, respectively). This is not found to be the case in Experiment 2—we observe that while thresholds along the luminance axis are similar for textures or images and uniform patches (right subpanel, Figure 9b), the areas of the chromatic projections are markedly higher in D65 as compared to TL84 (right panel, Figure 9c), suggesting a differential effect of illumination on chromatic-discrimination performance.
The mean chromatic ellipses are shown in Figure 9e (polychromatic stimuli) and 9f (uniform stimuli). The symbols and conventions used in these plots are the same as in Figure 6, except that the solid and dashed ellipses now denote data from Experiments 1 (solid lines) and 2 (dashed lines). Furthermore, the orienta-tion of the major axis across the observers is shown in Figure 9d. Similar to the results from Experiment 1, we observe a strong effect of the ambient illumination on the orientation of the ellipses, with the TL84 ellipses being closer in orientation to theu0 axis than the D65 ellipses for both polychromatic and uniform stimuli.
Discussion
Illumination and the mean stimulus color
The change in discrimination-ellipsoid volume from Experiment 1to Experiment 2 is not consistent with respect to the illumination or the mean color of the stimulus (Figure 9a). However, resolving the discrim-ination volume into chromatic and luminance projec-tions yields more consistent trends. The luminance projections of the threshold are higher for the
fluorescent TL84 illuminant, irrespective of the location in color space (Figure 9b). This effect of the ambient illumination (also observed in Experiment 1) is
qualitatively consistent with a simple Von Kries model
(Chauhan et al., 2014), which, given the illuminants used in the experiment (Figure 1a), predicts higher luminance thresholds under the TL84 illuminant than simulated daylight.
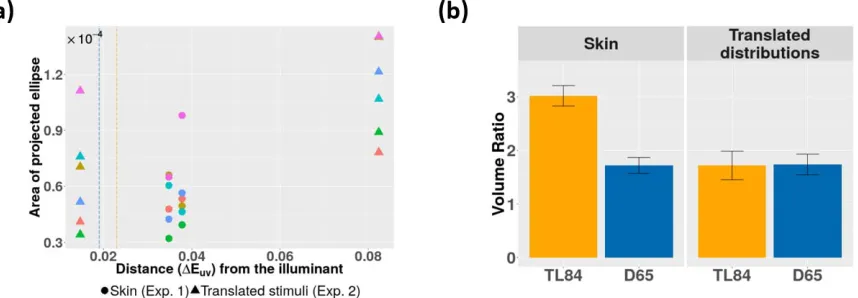
The area of the chromatic projections, on the other hand, seems to be modulated by the distance of the reference stimulus from the chromaticity of the ambient illumination. Figure 10a shows the area of the
chromatic ellipses from both experiments as a function of the distance between the reference stimulus and the illuminant chromaticity. The observers are coded by color, while the shape of the marker codes the
experiment (circles are Experiment 1 and triangles are Experiment 2). In addition, vertical lines are drawn to indicate the lengths of the principal axes of the stimulus color distribution (coded by the illuminant color: blue for D65 and yellow for TL84)—taken here as an approximate measure of the spread of the distribution. Although the sampling is insufficient to draw a strong conclusion, we observe that the area of the ellipse tends to increase with the chromatic distance. This effect has also been reported by Giesel et al. (2009) for areas of discrimination ellipses measured along an isoluminant plane using natural stimuli and textures. We observe that, taken together, the luminance and chromatic effects (luminance thresholds are governed the ambient illumination, while chromatic thresholds depend on the chromatic distance of the stimulus from the illuminant) do indeed explain the trend observed in discrimination volumes across both experiments so far. Furthermore, the aforementioned effects of ambient illumination and chromatic distance of the stimulus from the illuminant are observed for both textured and uniform stimuli, suggesting that they are global mechanisms, likely to be driven by the mean adaptation to the illumination condition.
Higher order statistics of skin
Figure 9. Parameters of discrimination boundaries from Experiments 1and 2. (a) Ellipsoid volumes. (b) Luminance projections of the discrimination ellipsoids. (c) Areas of the discrimination ellipses. (d) Orientations of the major axes of the
chromatic-discrimination ellipses with respect to the positiveu0axis. (e) Average chromatic ellipses for polychromatic stimuli from Experiments
1 and 2. (f) Average chromatic ellipses for uniform stimuli from Experiments 1 and 2. The color of the bars indicates the ambient
illumination (yellow: TL84; blue: D65). Labels T and D refer to the mean color (inu0v0Y0 color space) of the Caucasian skin patch
simulated under TL84 and D65 illuminants (see Figure 8a). In (a–d), Experiment 1 is shown in the left subpanel (‘‘Skin’’) and Experiment 2 is shown in the right subpanel (‘‘Swapped means’’). The solid ellipses in (e–f) show the results for Experiment 1, while
mechanisms (Webster & Mollon, 1997) which rely on higher order color statistics in natural stimuli.
General discussion
In this section, we make three general observations regarding our findings. First, our result that discrim-ination thresholds for skin and skinlike polychromatic stimuli are higher than those for their mean uniform colors stands in stark contrast to findings by Tan and Stephen (2013), who reported a decrease in discrimi-nation thresholds for human faces. Their stimuli were images of complete faces and uniform patches of the corresponding mean color; they found no changes in luminance thresholds, and an increased sensitivity along chromatic directions for faces. Apart from methodological differences, this could also suggest that an isolated skin patch, without shape cues, is not as discriminable as a complete face—even when flat displays are used to display both stimuli.
Second, it is important to note that polychromatic natural stimuli have both a chromatic and a spatial structure. In a separate, complementary experiment, we estimated discrimination thresholds for intact and spatially scrambled skin stimulus under the D65 illuminant (see Appendix 3). This disrupted the spatial structure of the stimulus while maintaining the color distribution. We found that the thresholds for scram-bled skin stimuli are in between those for uniform patches and intact skin, suggesting that the contrast-adaptation mechanisms proposed by Webster and Mollon (1994) could have a spatio-chromatic form. This would explain the observed order of the magni-tude of discrimination thresholds, as the spatio-chromatic mechanisms tuned to skin stimuli would be
maximally driven by skin, partially driven by scrambled skin, and minimally driven by uniform color. It must be noted that our evidence is only indicative, and we think more rigorous experiments are needed to understand the spatio-chromatic nature of adaptations to natural textures and scenes.
Third, it must be noted that the discrimination thresholds we report are for skin stimuli presented on flat, self-luminous computer displays. Although the appearance of the stimuli was simulated in accordance with the ambient illumination, care must be taken in generalizing our results to real skin.
Conclusion
In line with previous studies (Giesel et al.,2009), our results support the idea that the human visual system adapts to higher order spatio-chromatic properties of natural stimuli. However, the discrimination thresholds for both skin (Figure 4) and skinlike (Figure 9a and Appendix 3) stimuli are higher than those for uniform colors, suggesting that natural skin texture itself does not confer any advantage for discriminability of subtle changes in skin tone or lightness.
Lastly, we think that discrimination thresholds for skin stimuli measured in Experiment 1 could, on their own, be very useful in defining skin-specific difference metrics and appearance spaces. Such spaces could be important for applications such as printing of skin prostheses, automated assessment of dermatological conditions, and design of psychophysical studies such as those involving face-morphing spaces.
Keywords: discrimination thresholds, skin perception thresholds, JNDs, natural textures
Figure 10. (a) Area of chromatic ellipses as a function of distance (in theu0v0 chromaticity plane) from the illuminant. The data for
each observer are shown in a different color. For reference, we also use dashed vertical lines to show the extent of the skin gamut along the direction of the first principal component (D65: blue; TL84: yellow). (b) Ratio of ellipsoid volume for polychromatic stimuli
to uniform stimuli. The ratio is shown for Experiment 1in the left panel and Experiment 2 in the right panel. Only observers common
[image:14.612.96.525.61.210.2]Acknowledgments
This work was supported by EPSRC grant EP/ K040057 awarded to SW.
Commercial relationships: none.
Corresponding author: Tushar Chauhan. Email: [email protected].
Address: CerCo (CNRS UMR5549), Toulouse, France.
References
Agahian, F., Amirshahi, S. A., & Amirshahi, S. H. (2008). Reconstruction of reflectance spectra using weighted principal component analysis. Color Research & Application, 33(5), 360–371.
Atick, J., Li, Z., & Redlich, N. (1993). What does post-adaptation color appearance reveal about cortical color representation? Vision Research, 33(1), 123– 129.
Babaei, V., Amirshahi, S. H., & Agahian, F. (2011). Using weighted pseudo-inverse method for recon-struction of reflectance spectra and analyzing the dataset in terms of normality. Color Research & Application, 36(4), 295–305.
Bar-Haim, Y., Saidel, T., & Yovel, G. (2009). The role of skin colour in face recognition.Perception,38(1), 145–148.
Barlow, H., & F¨oldi´ak, P. (1989). Adaptation and decorrelation in the cortex. In J. Editor (Ed.), The computing neuron(pp. 54–72). Boston, MA: Addi-son-Wesley Longman Publishing Co., Inc.
Berens, P. (2009). CircStat: A MATLAB toolbox for circular statistics. Journal of Statistical Software,
31(10), 1–21.
Changizi, M. A., Zhang, Q., & Shimojo, S. (2006). Bare skin, blood and the evolution of primate colour vision. Biology Letters, 2(2), 217–221.
Chauhan, T., Perales, E., Xiao, K., Hird, E., Karatzas, D., & Wuerger, S. (2014). The achromatic locus: Effect of navigation direction in color space.
Journal of Vision,14(1):25, 1–11, https://doi.org/10. 1167/14.1.25. [PubMed] [Article]
Cousineau, D. (2005). Confidence intervals in within-subject designs: A simpler solution to Loftus and Masson’s method. Tutorials in Quantitative Meth-ods for Psychology, 1(1), 42–45.
Danilova, M., & Mollon, J. (2010). Parafoveal color discrimination: A chromaticity locus of enhanced
discrimination.Journal of Vision, 10(1):4, 1–9, https://doi.org/10.1167/10.1.4. [PubMed] [Article] Fink, B., Grammer, K., & Thornhill, R. (2001). Human
(Homo sapiens) facial attractiveness in relation to skin texture and color. Journal of Comparative Psychology, 115(1), 92–99.
Fink, B., Matts, P. J., Klingenberg, H., Kuntze, S., Weege, B., & Grammer, K. (2008). Visual attention to variation in female facial skin color distribution.
Journal of Cosmetic Dermatology, 7(2), 155–161. Fisher, R. (1953). Dispersion on a sphere. Proceedings
of the Royal Society A: Mathematical, Physical and Engineering Sciences, 217(1130), 295–305.
Giesel, M., Hansen, T., & Gegenfurtner, K. (2009). The discrimination of chromatic textures. Journal of Vision, 9(9):11, 1–28, https://doi.org/10.1167/9.9. 11. [PubMed] [Article]
Hansen, T., Giesel, M., & Gegenfurtner, K. (2008). Chromatic discrimination of natural objects. Jour-nal of Vision, 8(1):2, 1–19, https://doi.org/10.1167/ 8.1.2. [PubMed] [Article]
International Commission on Illumination (CIE). (2004). 15.3: 2004 Colorimetry. Vienna, Austria: CIE Central Bureau.
Jammalamadaka, S. R., & Sengupta, A. (2001).Topics in circular statistics. Singapore: World Scientific Publishing Co. Pte. Ltd.
MacAdam, D. (1942). Visual sensitivities to color differences in daylight. Journal of the Optical Society of America, 32(5), 247–274.
Melgosa, M., Hita, E., Poza, A. J., Alman, D. H., & Berns, R. S. (1997). Suprathreshold color-differ-ence ellipsoids for surface colors. Color Research & Application, 22(3), 148–155.
Melgosa, M., P´erez, M. M., El Moraghi, A., & Hita, E. (1999). Color discrimination results from a CRT device: Influence of luminance. Color Research & Application, 24(1), 38–44.
Montag, E. D., & Berns, R. S. (2000). Lightness dependencies and the effect of texture on supra-threshold lightness tolerances. Color Research & Application, 25(4), 241–249.
Morey, R. D. (2008). Confidence intervals from normalized data: A correction to Cousineau (2005).
Reason, 4(2), 61–64.
Moroney, N., Fairchild, M., Hunt, R. W. G., Li, C., Luo, M. R., & Newman, T. (2002). The CIE-CAM02 color appearance model. In10th Color and Imaging Conference Final Program and Proceedings
(Vol. 2002, pp. 23–27).
object shape, texture, and illumination changes.
Journal of Vision, 8(5):13, 1–16, https://doi.org/10. 1167/8.5.13. [PubMed] [Article]
Poirson, A., & Wandell, B. (1990). Task-dependent color discrimination.Journal of the Optical Society of America A, 7(4), 776–782.
Poirson, A., Wandell, B., Varner, D., & Brainard, D. (1990). Surface characterizations of color thresh-olds. Journal of the Optical Society of America A,
7(4), 783–789.
Regan, B. C., Reffin, J. P., & Mollon, J. (1994). Luminance noise and the rapid-determination of discrimination ellipses in color deficiency. Vision Research, 34(10), 1279–1299.
Shen, H.-L., Cai, P.-Q., Shao, S.-J., & Xin, J. (2007). Reflectance reconstruction for multispectral imag-ing by adaptive Wiener estimation.Optics Express,
15(23), 15545–15554.
Stephen, I. D., Law Smith, M. J., Stirrat, M. R., & Perrett, D. I. (2009). Facial skin coloration affects perceived health of human faces. International Journal of Primatology, 30(6), 845–857.
Tan, K. W., & Stephen, I. D. (2013). Colour detection thresholds in faces and colour patches. Perception,
42(7), 733–741.
Tangkijviwat, U., Rattanakasamsuk, K., & Shinoda, H. (2010). Color preference affected by mode of color appearance. Color Research & Application,
35(1), 50–61.
Vurro, M., Ling, Y., & Hurlbert, A. (2013). Memory color of natural familiar objects: Effects of surface texture and 3-D shape. Journal of Vision, 13(7):20, 1–20, https://doi.org/10.1167/13.7.20. [PubMed] [Article]
Watson, A., & Pelli, D. (1983). QUEST: A Bayesian adaptive psychometric method. Perception & Psy-chophysics, 33(2), 113–120.
Webster, M., & Mollon, J. (1994). The influence of contrast adaptation on color appearance. Vision Research, 34(15), 1993–2020.
Webster, M., & Mollon, J. (1997). Adaptation and the color statistics of natural images. Vision Research,
37(23), 3283–3298.
Xiao, K., Yates, J., Zardawi, F., Sueeprasan, S., Liao, N., Gill, L., . . . Wuerger, S. (2017). Characterising the variations in ethnic skin colours: A new calibrated data base for human skin.Skin Research and Technology,23(1), 21–29.
Xiao, K., Zhu, Y., Li, C., Connah, D., Yates, J., & Wuerger, S. (2016). Improved method for skin reflectance reconstruction from camera images.
Optics Express, 24(13), 14934–14950.
Appendix 1: Ellipsoid fitting
An ellipsoid with a known center is completely defined by six independent parameters—the lengths of the three axes, and the three Tait–Bryan angles. The Tait–Bryan angles of an ellipsoid represent the sequence of orthogonal rotations about the cardinal axes required to achieve its axis orientations; they are not readily interpretable in terms of the physical parameters of the ellipsoid. Therefore, after optimiza-tion, the parameters were converted to more intuitive quantities for analysis, such as the volume, the axis lengths and orientations, and the area and orientation of the projected ellipse on the chromaticity plane. Let a discrimination ellipsoid in a real 3-dimensional R3 space (u0v0Y0 space in our case) be denoted byE. The threshold boundary of this ellipsoidEcan be written as
E[fxj jjRUTðxcÞjj ¼1g; ðA1Þ
wherex R3is a color on the threshold boundary,Ris a diagonal matrix ½ rii 3i¼1 with its entries representing
the squared inverse lengths of the semiaxes, Uis an orthogonal matrix with each column representing a unit vector along one of the ellipsoid axes, and cis the center of the ellipsoid (defined as the average color of the tested stimulus in this study). Here,UTis essentially a rotation matrix in three dimensions, and thus can be decomposed into a set of Tait–Bryan angles or rotation angles. The Tait–Bryan angles of an ellipsoid describe the sequence of rotations one must perform on the cardinal axes of the color space such that they are aligned with the ellipsoid axes. Although the mapping from UT to Tait–Bryan angles is not bijective (it is many–one), a branch of the solution suffices to cover all real 3-D cases computationally. If R¼UT ¼
rij
3
i;j¼1 is the rotation matrix,H¼ hx hy hz
T
are Tait–Bryan angles for the three axes, and atan(x, y) represents the four-quadrant arctangent (which takes two arguments and has a range different from that of the standard arctangent, which is denoted in this appendix as tan1x), a sufficient mapping forHis given by
hy¼ asinðr31Þ
hx¼
atanðr12;r13Þ; r312 f 1;1g
atan r32
coshy;
r33
coshy
; otherwise
(
ðA2Þ
hz¼
0; r312 f 1;1g
atan r21
coshy;
r11
coshy
; otherwise
(
.
stimulus, the optimization was performed for only for the entries ofR andH—that is, six parameters. Suppose the estimated thresholds for a given condition and a given observer are given by the set {x1, x2,. . ., x14}, such that each ofx1 throughx14 represents the threshold along one of the 14 measured directions. Furthermore, letE(R, H) be an ellipsoid defined by the parameters {R, H}. Let us also define a metric d(x, E) which denotes the distance (Euclidean in our case) between a pointxand an ellipsoidE. The optimization problem to be solved for fitting an ellipsoid with optimized parameters Ropt;Hopt
can now be formu-lated as
Ropt;Hopt
¼arg min
R;H X14
i¼1
dðxi;EðR;HÞÞ: ðA3Þ
The Tait–Bryan angles Hare not a very intuitive parameter for a discrimination ellipsoid. For this reason, after optimization it was transformed back to the more easily interpretable orthogonal matrixUof unit vectors along the axes of the ellipsoid. From these optimal estimates, the elevations (hi) and azimuths (ui)
for each columnui¼½u1iu2i u3iT ofUwere derived
simply by converting them to polar coordinates using
hi¼tan1
ui3
ffiffiffiffiffiffiffiffiffiffiffiffiffiffiffiffiffi
u2i1þu2i2
q ;hi2
p 2;
p 2
n o
ðA4Þ
and
ui ¼atanðui1;ui2Þ; ui2 pf ;pg: ðA5Þ
The volumeVof a given ellipsoid with scaling matrix
Rwas calculated by using
V¼4
3pj jR 1=2
: ðA6Þ
Furthermore, assume that there is a plane Ldefined by
L[fxjx¼dþTtg; ðA7Þ
such thatd is any point on the plane, Tis the set of basis vectors defining the plane, andt is the vector of weights for each of the basis vectors—that is, the local coordinates of the pointx on the planeL. With d¼0
andT ¼ 1 0 0 1 0 0 2 4 3
5; one can model this planeL to
represent the zero-luminance chromaticity plane in the
uv0Y0 color space. The parallel projectionPE of an ellipsoidE(as defined in Equation A1) on this planeL
can be calculated to be
PE[fx~j jjR~U~ðx~c~Þjj ¼1g; ðA8Þ
wherex~is a point on the projected ellipse PE, ~c¼TT
cd
ð Þis the center of the ellipse, andU~ andR~ are the
left singular-vector matrix and the inverse of the truncated singular-value matrix respectively, found by the singular-value decomposition of TTUR1. The matrices U~and R~ have interpretations in a 2-D chromaticity plane analogous to those ofUand Rin a 3-D space—that is, U~ is a matrix such that each of its columns is one of the axes of the projected ellipse PE, andR~ is a diagonal matrix with each entry denoting the squared inverse length of the corresponding semiaxis. The area of this projected ellipse is given by
A¼pR~ 1=2: ðA9Þ
The azimuthu~1 of the major axis of the projected ellipse (often referred to as the orientation of the ellipse) is calculated simply by using the first column of the U~matrix u~1¼½u~11u~21
T
, which denotes a unit
vector along the major axis of PE:
~
u1¼tan1ðu~21=u~11Þ;u~12 p 2;
p 2
n o
: ðA10Þ
Appendix 2: Projecting chromatic
discrimination ellipses on u
0and v
0axes
In this appendix , we show the mean u0 and v0
[image:17.612.345.546.517.666.2]projections of chromatic ellipses for skin stimuli from Experiment 1 (Figure A2). These plots can be used to assess how the u0v0 chromaticity plane describes skin appearance. The artificial lighting (TL84, fluorescent) produces a large difference in thresholds along the two axes, whereas simulated daylight (D65) produces
Figure A2. Projections inu0 (light gray) andv0(dark gray) of
chromatic-discrimination ellipses for skin stimuli in Experiment
1. These projections can be used to compare the changes in
just-noticeable differences as one moves along theu0 andv0
thresholds which are similar. The thresholds are 0.005– 0.01 unit along either axis.
Appendix 3: Comparing intact and
scrambled skin stimuli
In this appendix, we show the average discrimination ellipsoids estimated for intact and scrambled skin, and
uniform stimuli of an equivalent mean color (Figure A3). These results are not directly comparable to the main results for two reasons: First, the skin stimulus used was not the same, and second, the measurements were made along only 10 directions (two luminance directions and eight chromatic directions), as opposed to 14. Even so, the trends in the data are quite
[image:18.612.145.467.206.321.2]indicative—with the average discrimination volume for scrambled skin stimuli lying between the average discrimination volumes for intact skin (largest) and uniform (lowest) stimuli.
Figure A3. Average discrimination ellipsoids for five participants measured along 10 directions: two luminance directions (6Y) and
eight chromatic directions in theu0v0 plane (6u0,6v0, and the diagonals of the four quadrants). The three discrimination ellipsoids