No
W
Int
The tow how for incr out pol serv com app sup effi1 D. outa the of S Eco Aca Resea Consid under vulner energy with p Wan-J scient of Bat La Bra presen interje fashio person
o. 225/No
Consu
An An
Wan-Ju
troduction
ere is a deci wards a dere wever, might generators t reasing the tages.1 Facedicy-makers vice reliabili mbination of plied to ma pply that is
icient.
. F. Layton an ages to hetero mixed gamm Simulation M onomics, A. ademic Press.
rch for this dering its Unc
the Seventh rability of the
y insecurity m producing cou
Jung Chou an tific director o th. Andrea Big anche is asso nt concise, p ecting the vie on. Unless oth
nal capacity a
ovember 2
umer
nalysis
ng Cho
Robert
n
ided movem egulated framt lack the ne o maintain h risk of gen d with such a
to envisage ity in the fu f regulatory a
aintain adeq socially o
nd K.Moeltne ogeneous hou ma-lognormal
Methods in E Alberini and
paper was ca certainties, Ri Framework P e EU to the d mitigation stra
ntries. nd Alistair Hu
f BC3 Basque ano is senior ociate researc policy-oriented ews of CEPS
herwise indic nd not to any
2010
Valua
s of Su
ou, Alist
ta Pierf
ment in EU e mework. Th ecessary ince high service r neration and a challenge, i e consumer uture so that
and economi quate securi optimal and
er (2004), “Th useholds – An
distribution”, Environmental d R. Scarpa
arried out in isks and Econ Programme. T ifferent energ ategies, inclu
unt are resea Centre for Cl researcher an cher at the In
d analyses o researchers a cated, the vie institution wi
ation
urvey R
tair Hun
federic
energy marke his framewor entive structu reliability, th d transmissi it is crucial fvaluation an acceptab ic tools can ity of ener economical
he cost of pow n application in Applicatio l and Resour (eds), Kluw
the context nomic Implica The project d gy supply risk ding investme
rch officers a imate Change nd Roberta Pie nstitute of Po of topical iss and associates ews expressed ith which he is
of Ene
Results
nt, Anil
i and S
ets rk, ure hus on for of ble be rgy lly wer of ons rce wer Th se el M th co re w liv de en pa w Ita da w 20 U
of the SECU ations), funde develops appr ks, and for pr ent, demand
at the Univers e and Professo erfederici juni olitical Studie sues in Europ
s into the po d are attribu s associated.
ergy S
s in Th
l Marka
Stephan
his study in ecurity of va lectricity, n Moreover, wh
his kind foc ontributes to esearch to tw we believe, a ves. Our res erive moneta nergy insecu ay (WTP) to were impleme aly and the ata, and wer with heads of
00 household UK.
URE project (S ed by the Eur ropriate tools romoting the side manage
sity of Bath. or of Economic or researcher es, Grenoble. pean affairs, olicy-making p utable only to
Suppl
hree EU
andya, A
ne La Br
nvestigates arious types atural gas hilst the maj cused on ele
the literatur wo other type
are increasin search objec ary estimate urity and 2) o improve s ented in thr United Kin e carried out f households. ds in France
Security of E ropean Comm for evaluatin optimisation ment and dia
Anil Markand cs at the Univ
at FEEM. Step CEPS Policy
with the a process in a t o the authors
y Sec
U Coun
Andrea
ranche
consumer v s of energy and transp jority of prev
ectricity sup re by expand
es of energy ngly import ctives were
s of the wel to assess th security of s ree EU coun ngdom – to t via face-to . The final ra , 222 in Italy
Energy ission ng the of EU alogue dya is versity phane Briefs im of timely s in a
curity:
ntries
Bigano
valuation of supply, nam ort fuels ( vious studie pply, this st ding the scop supplies wh tant in peop two-fold: 1 lfare impact e willingnes supply. Surv ntries – Fra
collect prim -face intervi aw data conc y and 303 in
2 | Chou, Hunt, Markandya, Bigano, Pierfederici & La Branche
1.
Survey findings on WTP
1.1 Reliability of electricity supply
Four attributes were selected to characterise the security (reliability) of electricity supply to household consumers. They represent how often power cuts take place, how long on average a power cut lasts, and when power cuts occur (during which months and at what time of the day).
The results show that domestic users in different countries demonstrate notably different preferences for the characteristics ascribed to the reliability of electricity supply. For example, respondents in France
[image:2.595.66.527.253.396.2]are willing to pay for the certainty of knowing the seasons during which a power cut would take place and to avoid power cuts occurring in the evening. But French respondents are not willing to pay to reduce the frequency or the duration of power cuts. By contrast, respondents in the UK and Italy are willing to pay to reduce the number of power cuts and their average duration. UK households are willing to pay to avoid a cut during the daytime whilst those in France are willing to pay to avoid a cut in the evening. Respondents in Italy, however, prefer knowing in which season a blackout would occur, whilst the time of day at which it occurs is not important. Table 1summarises our principal WTP results.
Table 1. Reliability of electricity supply: Key WTP results
Annual WTP per household* UK (£) France (€) Italy (€)
To avoid one power cut over a period of five years 10.09 -6.43 6.0
To avoid a one-hour interruption 19.23 -25.17 17.14
Having power cuts in April-September
To avoid not knowing the season of power cuts -8.85 80.14 44.71
To avoid October-March -9.40 -115.0 0.0
Having power cuts at any time during the day
To avoid daytime (6:00-18:00) 4.87 0.0 0.0
To avoid evening (18:00-6:00) 0.0 24.07 0.0
*“0” represents statistically insignificant results at the 10% significance level.
1.2 Reliability of gas supply
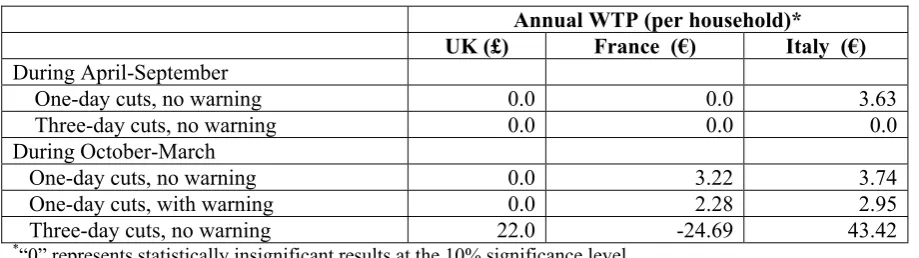
To determine the reliability of gas supply to homes, this study considered the number of one-day and three-day disruptions during each of two halves of the year: April to September and October to March. In general, we find that households in the three countries are not willing to pay to avoid a supply disruption during the warm months (April-September), though in Italy there is a positive WTP to avoid a one-day cut without a warning. When it comes to a supply disruption during the cold months (October-March), the associated negative impact is evident in all three countries. The difference between a one-day cut with warning and a one-day cut without warning is considered the willingness to pay to avoid the
uncertainty, and a positive WTP can be observed in France and Italy. Contrasting the one-day cut (no warning) with the three-day cut (no warning) shows that the impact of a supply disruption appears non-linear with the duration time. Note, however, that households in France are willing to pay to avoid one-day cuts during the cold months, but not to avoid a three-day cut. This may be because they judged such a prolonged cut unlikely and hence they were unwilling to pay to prevent it. UK households are willing to pay to avoid a three-day cut during the winter months, whereas the results suggest that a one-day cut during the cold months will have no impact on welfare. Results are summarised in Table 2.
Table 2. Reliability of gas supply: Key WTP results
Annual WTP (per household)* UK (£) France (€) Italy (€)
During April-September
One-day cuts, no warning 0.0 0.0 3.63
Three-day cuts, no warning 0.0 0.0 0.0
During October-March
One-day cuts, no warning 0.0 3.22 3.74
One-day cuts, with warning 0.0 2.28 2.95
Three-day cuts, no warning 22.0 -24.69 43.42
[image:2.595.70.530.637.766.2]1.3 Quality of transport fuels
This study looked at two issues relating to the insecurity of transport fuel supply. One is the dependence on crude oil that makes consumers constantly vulnerable to fluctuations in oil prices. The second concerns climate change impact caused by greenhouse gas emissions. Two attributes are adopted in the survey design to address these two dimensions of insecurity. The first refers to the share of substitute fuel used by consumer vehicles; it is presumed that higher shares of substitute fuel reduce the impact of oil price fluctuations, given the implied reduced reliance on oil. The second attribute defines the levels of CO2 in gram per kilometre emitted by consumer vehicles when in motion. This represents the extent of climate change impact as a result of using transport fuels. Therefore, rather than consider fuel supply disruptions, we consider differences in the qualities of
the good linked to reduced vulnerability and environmental concerns.
Table 3 below summarises the preferences for the two aspects of security associated with transport fuels – environmental impact and the reliance on fossil fuels. Households in Italy demonstrate a willingness to pay for an increase in the shares of substitute fuels and for a reduction in the level of CO2 emissions of a fuel mix. By contrast, households in the UK are willing to pay for a reduction in CO2 emissions but evaluate negatively an increase in substitute fuels. Those in the France provide a negative valuation of a decrease in CO2 emissions and show, at the 90% confidence level, no preferences for an increase or a decrease in substitute fuels. These results suggest that the total welfare gain/loss at a national level, as a result of implementing an energy policy that combats CO2 emissions by increasing shares of substitute fuels, might be inconclusive across Europe.
Table 3. Quality of transport fuels: key WTP results
Annual WTP (per household)* UK (£) France (€) Italy (€)
To have 1% increase in substitute fuela¶ -9.5 0.0 8.0
To avoid 1 gram CO2/kilometreb 2.5 -3.89 4.33
*“0” represents statistically insignificant results at the 10% significance level. a For example, to blend more biofuel (from 1% to 2%) into fossil fuels.
b A passenger car that emits 160 g of CO2/kilometre and has annual mileage of 10,000 miles produces 2.575 tonnes of CO2 per year. The reduction of 1 g of CO2/kilometre leads to a reduction of 0.016 tonne of CO2 per year.
2. Policy
implications
Domestic user preferences for the reliability of electricity supply are not identical across the three countries. The current levels of reliability of supply in each country do not seem to explain many of the observed differences in household preferences for the attributes of supply reliability. When it comes to a decision on improving a given aspect of reliability of supply, the implication is therefore that policy-makers in different countries should have different priorities. The extent of the economic impact of a disruption on gas supply depends on its duration and the season in which it takes place. Household preferences for the level of supply reliability vary from country to country. To obtain an aggregate economic impact of a given type of supply disruption, one can multiply the associated estimated price by the total number of households that are currently dependent on gas supply in each of the three countries, or regions within the countries. Such aggregate measures would then constitute a valuable indicator of the costs of supply
unreliability, or benefits of supply reliability, based on which policy-makers/energy suppliers should make decisions on the amount of economically justifiable further investment required to secure a certain level of reliability of supply to domestic users.
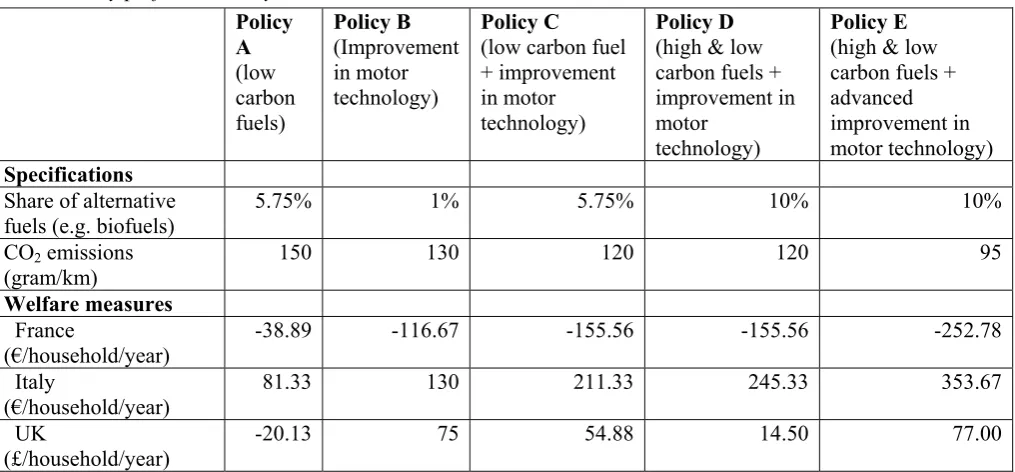
The welfare measures for five hypothetical policies2 related to transport fuels are shown in Table 4. In France the welfare measures for these five policies are negative and this can suggest that no benefits would be gained from introducing any of them. In Italy positive welfare measures for all five policies suggest that applying any of them would have positive benefits. The results for the UK suggest that a policy that only sets a target for biofuels without encouraging improvement in motor technologies has negative benefits, whereas one that mainly promotes technological development has positive welfare impacts. These results strongly imply that, despite an existing EU-wide policy framework/directive promoting the use of biofuels or the cutting of CO2 emissions related to transport fuels, country-specific strategies in the process of compliance are crucial.
4 | Chou, Hunt, Markandya, Bigano, Pierfederici & La Branche
Table 4. Policy preferences: Key WTP results
Policy A
(low carbon fuels)
Policy B
(Improvement in motor technology)
Policy C
(low carbon fuel + improvement in motor technology)
Policy D
(high & low carbon fuels + improvement in motor
technology)
Policy E
(high & low carbon fuels + advanced improvement in motor technology)
Specifications
Share of alternative fuels (e.g. biofuels)
5.75% 1% 5.75% 10% 10%
CO2 emissions (gram/km)
150 130 120 120 95
Welfare measures
France
(€/household/year)
-38.89 -116.67 -155.56 -155.56 -252.78
Italy
(€/household/year)
81.33 130 211.33 245.33 353.67
UK
(£/household/year)
-20.13 75 54.88 14.50 77.00
3. Conclusion
In this study, the estimated value of the security of electricity supply can be considered a lower bound because the sample households rely jointly on electricity supply and gas supply in their homes. It is believed that households that rely only on electricity are likely to have a higher WTP for the reliability of electricity supply. A future study that attempts to derive a nation-wide valuation of electricity supply security should account for this explicitly.
About
CEPS
E-mail: [email protected] Website : www.ceps.eu Founded in Brussels in 1983, the Centre for
European Policy Studies (CEPS) is among the most experienced and authoritative think tanks operating in the European Union today. CEPS serves as an leading forum for debate on EU affairs, but its most distinguishing feature lies in its strong in-house research capacity, complemented by an extensive network of partner institutes throughout the world.
Goals
• To carry out state-of-the-art policy research leading to solutions to the challenges facing Europe today. • To achieve high standards of academic excellence
and maintain unqualified independence. • To act as a forum for discussion among
stakeholders in the European policy process • To provide a regular flow of authoritative
publications offering policy analysis and recommendations.
• To build collaborative networks of researchers, policy-makers and business representatives across the whole of Europe.
• To disseminate our findings and views through our publications and public events.
Assets
• Multidisciplinary, multinational & multicultural research team.
• Complete independence to set its own research priorities and freedom from any outside influence. • Seven research networks, comprising numerous
other highly reputable institutes, to complement and consolidate CEPS’ research expertise and to extend its outreach.
• An extensive membership base of Corporate and Institutional Members, which provide expertise and practical experience and act as a sounding board for CEPS policy proposals.
Programme Structure
Research Programmes
Economic & Social Welfare Policies •
Financial Markets & Institutions •
Energy & Climate Change •
Regulatory Policy •
EU Foreign, Security & Neighbourhood Policy •
Justice & Home Affairs •
Politics & Institutions •
Agricultural & Rural Policy •
Research Networks
European Capital Markets Institute (ECMI) •
European Climate Platform (ECP) •
European Credit Research Institute (ECRI) •
European Network for Better Regulation •
(ENBR)
European Network of Economic Policy •
Research Institutes (ENEPRI)
European Policy Institutes Network (EPIN) •
European Security Forum (ESF) •
CEPS organises a variety of activities, involving its members and other stakeholders in the European policy debate, including national and EU-level policy-makers, academics, corporate executives, NGOs and the media. Its funding is obtained from a variety of sources, including membership fees, project research, foundation grants,